Biological Journal of the Linnean Society, 2008, 95, 425–436. With 6 figures
Using digital images to reconstruct three-dimensional biological forms: a new tool for morphological studies YLENIA CHIARI1*†‡, BING WANG2†, HOLLY RUSHMEIER2 and ADALGISA CACCONE1 1
Department of Ecology and Evolutionary Biology and YIBS-Molecular Systematics and Conservation Genetics Laboratory, Yale University, 21 Sachem Street, New Haven, CT 06520-8106, USA 2 Department of Computer Science, Yale University, PO Box 208285, New Haven, CT 06520-8285, USA Received 18 October 2007; accepted for publication 2 January 2008
We examined two image-based methods, photogrammetry and stereo vision, used for reconstructing the threedimensional form of biological organisms under field conditions. We also developed and tested a third ‘hybrid’ method, which combines the other two techniques. We tested these three methodologies using two different cameras to obtain digital images of museum and field sampled specimens of giant tortoises. Both the precision and repeatability of the methods were assessed statistically on the same specimens by comparing geodesic and Euclidean measurements made on the digital models with linear measurements obtained with caliper and flexible tape. We found no substantial difference between the three methods in measuring the Euclidean distance between landmarks, but spatially denser models (stereo vision and ‘hybrid’) were more accurate for geodesic distances. The use of different digital cameras did not influence the results. Image-based methods require only inexpensive instruments and appropriate software, and allow reconstruction of the three-dimensional forms (including their curved surfaces) of organisms sampled in the field. © 2008 The Linnean Society of London, Biological Journal of the Linnean Society, 2008, 95, 425–436.
ADDITIONAL KEYWORDS: 3D reconstruction – computer vision – digital photography – photogrammetry – stereo vision – tortoise.
INTRODUCTION Reconstructing the three-dimensional (3D) form of living organisms in their natural habitat is a chal lenge and, currently, there are no methods enabling reconstruction over a wide range of field conditions and animal sizes and forms. Field work conditions present a variety of problems, including variable lighting, rain and humidity, difficulty in accessing locations, and long distances between sampling locali ties. In addition, live animals sampled in their habitat can move and their bodies are deformable. Data capture in the field requires instruments that are easily transportable, easily operated, inexpensive, resistant to rain, humidity, and mechanically durable. *Corresponding author. E-mail:
[email protected] †These authors contributed equally to this study. ‡Current address: Institut des Sciences de l’Evolution: ISE-M, Université Montpellier 2, Place Eugène Bataillon, Bât. 22/RdC/CC 064, 34095 Montpellier cedex 5, France.
Moreover, using the instruments should pose no harm to the organisms under study. With the lack of 3D reconstruction methods suit able for field use, researchers have often resorted to analyzing the morphology of a limited number of samples available in museums. Alternatively, they may analyze two-dimensional (2D) reconstructions or use only a small number of distance measurements taken on field sampled individuals (Olson, Goodman & Yoder, 2004; Fritz et al., 2006), thereby risking losing critical information to study patterns of intraand inter-specific morphological variation. Moreover, distance data do not recover the geometry of the original form (Rohlf, 1990; Rohlf & Marcus, 1993). Instead, 2D or 3D coordinates of landmark points represent the geometry of the organism or structure studied. Distance-based methods have been developed to obtain 2D and 3D coordinates from measured dis tances (e.g. multidimensional scaling, Euclidean dis tance matrix analysis; Dryden & Mardia, 1998), but
© 2008 The Linnean Society of London, Biological Journal of the Linnean Society, 2008, 95, 425–436
425
426
Y. CHIARI ET AL.
these methods require exhaustive measurements (every pair of landmark taken in each possible com bination). Carpenter, Sommer & Marcus (1996) devel oped a method to obtain landmark coordinates in a 2D or 3D space from distance data by a simplification of the multidimensional scaling algorithm and based on 2D truss networks (Strauss & Bookstein, 1982). However, not every subset of the possible exhaustive measurements is adequate for an accurate recon struction. As noted by Rohlf & Marcus (1993), for incomplete sets of measurements for which the structure is not uniquely specified, reconstruct ing the shape from polygon to polygon may result in large errors for distances computed between distant polygons. Distances and 2D coordinate data represent the form as a 2D entity. Biological organisms and their parts are 3D entities. Simplifications to a 2D form are usually applied if one of the three dimensions is considered irrelevant to the study question or deemed unimportant compared to the other two (Zelditch et al., 2004). A possible misinterpretation of shape changes can be created by the study of a composed 3D structure in a 2D space (Bock, 1966; Reig, 1996). Collecting true 3D data avoids making assumptions about the symmetry of the organism that are needed when 2D data is extrapolated to create a 3D model (Dean, 1996). There are still major obstacles to 3D data gathering for biological study, including the cost, availability, and the suitability of instrumentation for field studies (Zelditch et al., 2004). Digital based methodologies to reconstruct 3D forms are available (e.g. 3D touch probe digitizers, reflex microscopes, optical scanners, and computerized axial tomographic imaging), and are currently used primarily on museum specimens or in medical applications (Zollikofer & Ponce de Leon, 2002; Claude et al., 2003). However, only optical scan ners can recover curved surfaces but, because of their high cost, these devices are not widely available. Alternatives devices for 3D data capture have been suggested, but involve either complex sets of instru �� ther, 1985; Corti et al., ments (Guillet, Doyle & R u 1996) or constraints on positioning of the necessary instruments used that are not feasible in the field (Spencer & Spencer, 1995; Fadda, Faggiani & Corti, 1997; Stevens, 1997). In the field, organisms are not always in an open space, and the instruments need to be carried for long distances and assembled each time, when searching for individuals scattered over a wide area. Techniques from photogrammetry and computer vision using digital photography have been used widely in geomorphology, architecture, biometry, forensic, medical, geographic, and archeological studies. However, they have been applied to only a
small number of biological systems (Bythell, Pan & Lee, 2001; Van der Meijden & Chiari, 2005). Thus far, these applications have used photogrammetric methods to reconstruct models that are flat between user specified landmarks. In the present study, we applied and tested two techniques from the fields of photogrammetry and computer vision that are available in commercial soft ware packages. We also implemented and tested a new ‘hybrid’ method that combines the advantages of these two techniques to reconstruct the 3D form from digital images. All of the methods use images from widely available digital cameras with no additional expensive or cumbersome devises. We tested the accu racy of the results for cameras from different manu facturers available at different price points. We tested the methods on a tortoise sampled in a museum and on one sampled in the field. Tortoise carapaces are well suited for testing and developing these methodologies on live animals because they offer a simplified setting. Their carapace has easily identifiable landmarks (e.g. suture points between epidermal shields), which simplify the landmark identification of our methods. Moreover, the animals move slowly, and their shell is rigid.
MATERIAL AND METHODS
MATERIAL
A museum specimen (YPM R16084) of Aldabrachelys
gigantea, the giant Aldabra tortoise (male, curve cara-
pace length = 1250 mm), was used to test the three
methods. Two of the methods (‘hybrid’ and photo-
grammetry) were also tested on a living specimen
of a Galápagos giant tortoise, Geochelone porteri
(male, curve carapace length = 919 mm, Santa Cruz,
Galapagos Islands, Ecuador).
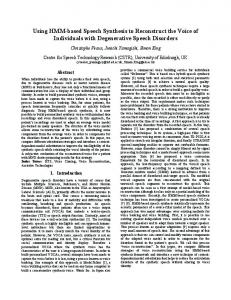
METHODS Linear measurements Calipers (resolution = 0.1 mm) were used to take Euclidean (linear) measurements on both the museum and field tortoises’ specimens. Each possible binary combination for each landmark (Fig. 1; see Appendix, Tables A1, A3) was measured for the Aldabra tortoise, whereas only six measurements were taken for the Galápagos tortoise (SW1/2N, SW2N, SW3N, SW2/3N, SL1/2C and SL2/3C; Fig. 1; see Appendix, Table A5). A flexible tape (resolution = 1 mm) was used to obtain geodesic distances (curve measurements taken along the surface) on the cara pace of the Aldabran tortoise in binary combination for each landmark (see Appendix, Tables A2, A4).
© 2008 The Linnean Society of London, Biological Journal of the Linnean Society, 2008, 95, 425–436
3D BIOLOGICAL FORM RECONSTRUCTION
Figure 1. Carapace of Aldabrachelys gigantea. Numbers indicate the landmark points (modified from Gerlach, 2004). Landmark labels: 3–16, SW1/2N; 4–15, SW2N; 6–13, SW3N; 5–14, SW2/3N; 15–19, SL1/2C; 13–20, SL2/3C.
These data were used as ‘true values’ to evaluate the precision of each method. Camera hardware Two types of cameras were used, a Canon Digital Rebel XT camera (Canon EF-S; 18–55 mm f3.5–5.6 lens with a pixel resolution of 1728 ¥ 1152), and a much less expensive camera, the Pentax Optio W10 (pixel resolution of 1600 ¥ 1200), to take the digital images of the specimens and of the calibration targets (see below). For the Galápagos giant tortoise, digital images were obtained only with the Pentax camera because our analyses on the museum specimen showed that the two cameras perform similarly (see Results). Imaging software and data capture procedure In the present study, a method from photogrammetry was used that produces a sparse set of geometric points from images taken with a single camera, a method from computer vision was used that produces a dense set of points from images taken with a pair of mechanically linked cameras, and a ‘hybrid’ method was used combining the advantages of the other two techniques. In all three methods, the 3D form of an object was computed by identifying the image location of the points in two or more camera views (Fig. 2). The triangulation principle was used in all of the methods. The camera views may be obtained from one camera that moves around, or from multiple cameras triggered in unison (Lu et al., 2004).
427
Figure 2. A point ‘P’ is observed by two or more cameras. A single camera is insufficient because the appearance of the point in one image means only that the point lies along a particular ray (ray 1 for P in camera view 1). Two cameras, 1 and 2, have each an associated image. If the camera positions and orientations relative to each other are known, the position of P can be computed from the baseline distance between the cameras and the angles of the rays through the pixels (x1, y1) and (x2, y2). The angles from the camera positions to P can be determined by knowing the orientation of the cameras, the camera focal length and any corrections for optical lens distortions.
Camera positions and orientations are referred to as extrinsic camera parameters. Camera focal lengths and lens corrections are referred to as intrinsic camera parameters. The methods used vary in how they determine the camera parameters, and so the procedures to capture the images differ. The intrinsic parameters, in particular the camera focal length, cannot change between taking pictures of the object and of the calibration target. The determination of camera parameters is referred to as camera calibra tion (Zhang, 2000). The processing steps for all three methods are provided in more detail in the software tutorials and on the webpage of the ‘hybrid’ method (http:// graphics.cs.yale.edu/bjls). Photogrammetric method: The first method consid ered is a method from photogrammetry as imple mented in the commercial software PhotoModeler® Pro 5.2.3 (Eos System Inc.). PhotoModeler® computes the locations of user identified landmarks using a series of images taken with a single camera. This is necessary to find the extrinsic camera parameters. The calibration phase is necessary to determine the intrinsic camera parameters, which are computed
© 2008 The Linnean Society of London, Biological Journal of the Linnean Society, 2008, 95, 425–436
428
Y. CHIARI ET AL.
from a series of images of a known target (provided with the software). At least eight images were taken for each calibration. Images of the organism were taken from multiple views as indicated in the software tutorial. Digital pictures were taken moving around the animal, freely choosing the distance or angle from it. All computa tional processing of the images was performed after returning from the site of the images capture. To process the images, the user needs to identify each landmark that appears in each image. Using the input from the user and the camera calibration data, the program produces a surface that consists of polygons connecting user specified landmarks. The program also computes all of the extrinsic parameters of the camera views for the images that were taken. Stereo vision method: The second method used was a stereo vision method from the field of computer vision and as implemented in the commercial software SRI Small Vision System (SVS) 4.2 (Videre Design Inc.). This method uses images from a pair of cameras bolted together a fixed distance apart to produce a spatially dense set of points on the specimen surface (or alternatively a single camera with a set of mirrors and prisms to create two ‘virtual’ cameras could be used). The distance between the cameras is deter mined by the size and distance to the specimen to be measured, and was 20 cm in the present study. In the stereo vision method, both the intrinsic and extrinsic camera parameters are determined in the calibration phase (performed prior or after taking the organism images). The calibration for the stereo vision method requires taking a series of images of a target, which is provided with the software. At least eight images pairs were taken for each calibration. Pairs of images of the specimen were taken and used to reconstruct the portion of the specimen that is visible in each image in the pair (stereo matching). Multiple overlapping imaging pairs were required to capture the form of the complete specimen. All com putational processing of the images was performed after returning from the site of the images capture. Because both intrinsic and extrinsic camera param eters were obtained in calibration, the software is able to compute 3D locations from the images without user interaction. The result of processing with the SVS software is not a 3D model, but a portion of the specimen surface (partial model). The partial models were aligned with one another by having the user specify the approxi mate locations of three corresponding points in each pair of overlapping partial models. The precise align ment of partial models was then computed using the iterative closest point method (Besl & McKay, 1992) and an integrated single 3D model is produced. The
SVS software does not provide for this alignment, and so a series of software modules was implemented for performing this alignment and integration based on the freely available software components (available at http://graphics.cs.yale.edu/bjls). ‘Hybrid’ method: The photogrammetric method is easier to use in the field because it requires a single camera. It is limited, however, to only reconstructing user specified landmarks. The ‘hybrid’ method extends the photogrammetric method by combining it with stereo vision to compute a spatially dense model. The hybrid method begins with the intrinsic camera calibration procedure from PhotoModeler®. Images were then taken of the specimen using a single camera. However, instead of simply insuring that landmarks of interest appear in multiple images, pairs of views were taken that are approximately similar in distance apart as views from the stereo camera pair would be. After the images were processed as in PhotoModeler®, our own software (freely available with additional information from http://graphics.cs.yale. edu/bjls) was used to convert the PhotoModeler® com puted extrinsic camera parameters to create virtual calibration images using standard computer graphics techniques (e.g. as described in Shirley et al., 2005) for use in the SVS system in place of captured images of the SVS target. Given the camera calibration images, the processing of the data continued as though each pair of images captured with the single camera were captured with the mechanically coupled cameras (stereo vision method). Scaling For all of the above methods, the 3D models need to be scaled to the actual dimension of the object. The scale value can be computed by comparing at least one caliper distance physically measured on the actual object and the corresponding Euclidean distance mea sured from the 3D digital model. Euclidean distances were measured on the digital model using the freely available Rapidform Basis software (INUS Technology, www.rapidform.com). To reduce the influence of mea surement error due to either error in obtaining the physical distance measurements and/or limitation of the caliper resolution, this value was computed with the least square method (Moore & McCabe, 2004) on multiple distance measurements. The Euclidean dis tances used in this study were: SW1/2N, SW2N, SW2/3N and SW3N (Fig. 1), according to the formula:
s = arg min (( SW1 2N p − a × SW1 2N c ) + ( SW2N p − a 2
a
2
2
× SW2N c ) + ( SW2 3N p − a × SW2 3 N c ) 2
+ ( SW3N p − a × SW3Nc )
)
© 2008 The Linnean Society of London, Biological Journal of the Linnean Society, 2008, 95, 425–436
3D BIOLOGICAL FORM RECONSTRUCTION
429
Table 1. P-values obtained using the t-test paired two sample for means PM
Euclidean Geodesic
SVS
‘Hybrid’
Canon
Pentax
Canon
Pentax
Canon
Pentax
0.05 < 0.01
0.63 < 0.01
0.79 0.77
0.40 0.10
0.57
0.70
0.37 –
P < 0.01 indicates that the measurements from the reconstructed three-dimensional model with each method are statistically significantly different from the ones obtained using the caliper or flexible tape on the actual specimen. PM, SVS and ‘hybrid’ refer to the photogrammetry, stereo vision, and ‘hybrid’ methods, respectively. The ‘hybrid’ method has not been tested with the Pentax camera for the geodesic distances (–) (see Appendix).
where s is the scaling values, SW1/2Np, SW2Np, SW2/ 3Np, and SW3Np are distances measured with caliper on the actual tortoise, and SW1/2Nc, SW2Nc, SW2/ 3Nc, and SW3Nc are the distances measured on the reconstructed 3D models. Statistical analysis Both the error and repeatability of the measurements taken on the 3D models were evaluated. The error was calculated as the absolute values of the measure obtained with each method minus the corresponding physical measure (obtained with the caliper or tape ruler). Repeatability of the photogrammetric and ‘hybrid’ methods was tested by running a correlation analysis (Moore & McCabe, 2004; with the test run in Microsoft Office Excel) using two independent mea surement sets taken on two different 3D models of the Aldabra tortoise carapace reconstructed using two distinct sets of digital images and different users. The precision of each method was tested using the t-test paired two sample for means (Moore & McCabe, 2004; with the test run in Microsoft Office Excel). Prior running the test, each distance value obtained on the 3D model was transformed according to the formula: distance obtained on the 3D model/corresponding dis tance obtained with the caliper (or tape ruler). The test was run by comparing the transformed distance value obtained on the digital model reconstructed with the photogrammetric or ‘hybrid’ method with the caliper or flexible tape measurements. The two differ ent cameras cannot be compared for the ‘hybrid’ method because each of them was used on the differ ent tortoises. Because multiple comparisons were made (to rank which method performs better), a Bon ferroni correction was applied with n = 5 (five com parisons; Table 1) to control for misleading P-values (Moore & McCabe, 2004).
RESULTS For the Aldabra tortoise, 11 pictures were processed in PhotoModeler®, 26 pictures in the Small Vision
System, 36 pictures in the ‘hybrid’ method, and 24 pictures each for the repeatability test for the ‘hybrid’ and photogrammetry methods. For the Galápagos tortoise, 24 digital images were processed for only the photogrammetric and the ‘hybrid’ methods because of the limitation of the field work in using the two physically linked cameras necessary to test the stereo vision method. The time needed for taking all the images for a single individual varied in the range 10–30 min, depending on the method used (10–15 min for the stereo vision method and 20–30 min for each of the other methods), the size of the object, and on how much the animal moves. The processing time was longer than the image capturing time. To obtain a 3D model with PhotoModeler®, it takes approxi mately 1–5 h per individual of picture processing by the user. The large time range depends on how many images are used, the quality of the images (how visible are the landmarks on each picture), and how many landmarks are identified in total. In the present study, a total of 51 landmarks were marked on the Galápagos tortoise, and 53, 58, and 52 land marks were marked on the Aldabra tortoise (for pic tures taken with both cameras, and for the repeatability experiment respectively). For the stereo vision method, only 1–3 h of processing time per individual was needed because the longest step of the previous method, landmark identification, was carried out by the software rather than by the user. The range in time depends on how many images pairs are used, and how many partial models need to be aligned. For the ‘hybrid’ method for a single speci men, 2–8 h are needed. These times refer to usertime and not computer processing time. Figure 3 shows the reconstructed 3D model of the Aldabra tortoise carapace obtained with the photo grammetric (Fig. 3B) and vision-based methods (Fig. 3C). Although both methods capture the overall form of the carapace, the stereo vision-based method captures more geometric details. Figure 4 shows the reconstructed model of the Galápagos tortoise cara
© 2008 The Linnean Society of London, Biological Journal of the Linnean Society, 2008, 95, 425–436
430
Y. CHIARI ET AL. A
B
1
2
3
1
2
3
C
Figure 3. Reconstructed 3D form of the carapace of Aldabrachelys gigantea. A, photography of the tortoise. B, reconstructed three-dimensional (3D) form with PhotoModeler: (1) textured model, (2) untextured model, and (3) wireframe model. C, reconstructed 3D form with Small Vision System: (1) textured model, (2) untextured model, and (3) wireframe model. A wireframe model is a visual presentation of a 3D object used in 3D computer graphics. A
B
C
Figure 4. Reconstructed three-dimensional form of the carapace of Geochelone porteri. A, photography of the tortoise. B, textured mapped model with PhotoModeler. C, textured model with the ‘hybrid’ method.
pace obtained with the photogrammetric (Fig. 4B) and the ‘hybrid’ methods (Fig. 4C). Table 1 shows the results of the t-test used to assess the precision of each method and camera. Based on the P-values obtained with the t-test, all the methods show high precision compared with the corresponding caliper or flexible tape measurements. The only exception is for the geodesic measurements obtained
on the model reconstructed using the photogrammet ric method. Tables 2 and 3 show the results of the statistical analysis to evaluate whether the measurements obtained with the caliper or flexible tape and the ones obtained on the reconstructed models were signifi cantly different. The correlation coefficients obtained for the repeatability test suggest that both methods
© 2008 The Linnean Society of London, Biological Journal of the Linnean Society, 2008, 95, 425–436
3D BIOLOGICAL FORM RECONSTRUCTION
431
Table 2. Basic statistic of the error in reconstructing the three-dimensional model of the Aldabra and Galápagos tortoise’ carapaces with the Canon or Pentax cameras (for measurements, see Appendix) PM Error (mm)
Canon
SVS Pentax
‘Hybrid’
Canon
Pentax
Canon
Pentax
Euclidean Distances
Average ± SD Maximum Minimum
1.6 ± 1.0 3.2 0.0
1.0 ± 0.7 2.2 0.2
1.4 ± 0.8 2.8 0.1
2.4 ± 1.2 3.9 0.5
1.1 ± 0.6 2.1 0.2
1.1 ± 1.0 2.6 0.1
Geodesic Distances
Average ± SD Maximum Minimum
15.2 ± 6.1 22.4 6.5
14.0 ± 5.9 21.2 6.0
3.3 ± 1.8 6.0 0.4
4.3 ± 3.1 9.7 1.4
1.6 ± 1.1 3.4 0.1
– – –
PM, SVS and ‘hybrid’ refer to the photogrammetric, stereo vision and ‘hybrid’ methods, respectively. Maximum and minimum error are absolute obtained values. Dashes indicate data not available. Table 3. Statistical error in reconstructing the three-dimensional model of the Aldabra tortoise’ carapace with the Canon camera using two different sets of images and two different users to process the images (for measurements, see Appendix) Error (mm)
PM
‘Hybrid’
Euclidean distances
Average error ± SD Maximum error Minimum error Correlation coefficient
1.0 ± 0.5 1.7 0.4 1.0
1.8 ± 0.7 3.8 0.2 1.0
Geodesic distances
Average error ± SD Maximum error Minimum error Correlation coefficient
15.2 ± 4.4 20.6 8.4 0.96
2.3 ± 1.1 3.7 0.5 0.99
PM, SVS and ‘hybrid’ refer to the photogrammetric, stereo vision and ‘hybrid’ methods, respectively. Maximum and minimum error are absolute obtained values.
are highly repeatable (Table 3). Moreover, there is no clear evidence for any method of an association between the length of the distance measured and the error associated with it (Fig. 5A, B). A strong corre lation is shown between Euclidean measurements obtained with the caliper and those obtained on the models reconstructed with any of the methods (R2 = 1; Fig. 6A), whereas, for the geodesic measurements, the stronger correlation was found with the ‘hybrid’ method (R2 = 1; Fig. 6B).
DISCUSSION All three methods perform similarly for Euclidean distances independently of the camera used (Table 1). Minor differences in precision are likely to be related to a less precise camera calibration. Thus users can decide which camera and method to use depending on their specific needs. When dealing with geodesic distances, both the ‘hybrid’ and the stereo vision methods perform much better than the photogrammetric (Table 1). That is mainly because of the dense reconstruction obtained
with the stereo vision method (thus the ‘hybrid’ method) for geodesic distances. Even the pyramiding (‘bumps’) of the carapace was well reconstructed because the method automatically calculates corre sponding points everywhere on the carapace. In the stereo vision method, the Canon camera outper formed the Pentax (Table 1) because the stereo vision method requires high quality textures in the digital images for stereo matching. Given the high accuracy obtained with these meth odologies, their repeatability, the limited cost of the materials, and the fact that no framer or other devices are necessary to fix the position of the camera, they are especially suitable for field work. One of the reasons for the larger body of literature on 2D rather than 3D morphometric data analysis is the high cost of the instruments necessary to obtain the 3D data. The methods described in the present study, even if time consuming during the processing phase, offer an easy, minimally invasive and non-expensive way to obtain accurate 3D reconstruction of animal forms, recovering curved surfaces and surface texture when needed. Although these methodologies were not tested
© 2008 The Linnean Society of London, Biological Journal of the Linnean Society, 2008, 95, 425–436
432
Y. CHIARI ET AL. A 3.0 2.0
Error (mm)
1.0 0.0 0
50
100
150
200
250
300
350
-1.0 -2.0 -3.0 -4.0
Caliper measurements (mm) B
25 20
Error (mm)
15 10 5 0 290 -5
295
300
305
310
315
320
325
330
335
-10
Tape measurements (mm)
Figure 5. Plot indicating the relationship between the statistic error due to each method and the length of the distance measured. A, Euclidean distances. B, geodesic distances. Triangles, squares, and circles refer to measures obtained on the carapace reconstructed with the stereo vision-based, photogrammetric and ‘hybrid’ methods, respectively. Data are based on images taken with the Canon camera on the Aldabra tortoise.
on different organisms, the results obtained demon strate that the error is not related to the measured distances (Fig. 5). Thus, it is proposed that these techniques could be used successfully on nondeform able structures in other animals. The 3D reconstruc tions can be used to calculate the volume and mass of the animals or used for functional morphology, as well as morphometric studies. Digital images can further be made easily accessible to other researchers to address other biological questions without the need of repeating the sampling. In the photogrammetric method, the data capture is easier because only one camera is needed, whereas the data processing is more time-consuming than the stereo vision method because of the dependence on user interaction. Practicing with the methodology, highlighting the landmarks, and high quality pictures all help to reduce the user interaction error and the time required to reconstruct each carapace. When working with live organisms in the field, trading time in post processing versus convenience may be desir
able. Because the same levels of precision are obtained by both methods, the decision about which method to use can be based purely on the field con dition logistics and the kind of information that the user needs. The new ‘hybrid’ method combines the advantages of photogrammetric and stereo vision methods, the easier data collection (only one consumer grade digital camera is needed), and the high precision and detail, making this method extremely suitable for field work. Another advantage of this method is that, if the field images are not of high enough quality to allow the reconstruction of curve surfaces, the same images can always be processed using the photogram metric method. Furthermore, because they recon struct spatially denser models, the ‘hybrid’ and the stereo vision methods allow the user to mark and recover the 3D coordinates of any point on the surface of the model, whereas the photogrammetric method only allows the user to recover the 3D coordinates of previously marked landmarks.
© 2008 The Linnean Society of London, Biological Journal of the Linnean Society, 2008, 95, 425–436
3D BIOLOGICAL FORM RECONSTRUCTION
433
Figure 6. Plot indicating the relationship between the measurements calculated on each reconstructed model and the ones obtained with the caliper or flexible tape. A, Euclidean distances. B, geodesic distances. Triangles, squares, and circles refer to measures obtained on the carapace reconstructed with the stereo vision-based, photogrammetric and ‘hybrid’ methods, respectively. Data are based on images taken with the Canon camera on the Aldabra tortoise.
ACKNOWLEDGEMENTS We are grateful to G. Watkins-Colwell, R. O. Prum, K. Zyskowski, and S. Hochgraff for allowing us to work on the specimens of A. gigantea. J. Lu helped during obtaining the digital images of the museum specimen. The EOS System Technical support helped us with numerous questions about PhotoModeler®. We are thankful to A. van der Meijden for fruitful discussion on the topic of this article and to the StatLab at Yale University for their consulting on statistics. The comments of three anonymous reviewers greatly improved an early version of this manuscript. S. Glaberman offered numerous comments on later version. T. Fritts, S. Glaberman, J. Gibbs, J. Guo,
C. Hyseni, C. Marquez, L. Marquez, and M. Mendez helped during the field work. This work was sup ported by a National Geographic Grant to A.C. and Y.C. (number 8017-06).
REFERENCES Besl PJ, McKay ND. 1992. A method for registration of 3-D shapes. IEEE Transactions on Pattern Analysis and Machine Intelligence 14: 239–256. Bock WJ. 1966. An approach to the functional analysis of the bill shape. Auk 83: 10–51. Bythell JC, Pan P, Lee J. 2001. Three-dimensional morpho metric measurements of reef corals using underwater photogrammetry techniques. Coral Reefs 20: 193–199.
© 2008 The Linnean Society of London, Biological Journal of the Linnean Society, 2008, 95, 425–436
434
Y. CHIARI ET AL.
Carpenter KE, Sommer HJ III, Marcus LF. 1996. Con verting truss interlandmarks distances to Cartesian coor dinates. In: Marcus L, Corti M, Loy A, Naylor G, Slice D, eds. Advances in morphometrics, NATO ASI Series A: Life Science, Vol. 284. New York, NY: Plenum Publishing Corp. Claude J, Paradis E, Tong H, Auffray J-C. 2003. A geo metric morphometric assessment of the effects of environ ment and cladogenesis on the evolution of the turtle shell. Biological Journal of the Linnean Society 79: 485– 501. Corti M, Fadda C, Simson S, Nevo E. 1996. Size and shape variation in the mandible of the fossorial rodent Spalax ehrenbergi. A Procrustes analysis of three dimensions. In: Marcus L, Corti M, Loy A, Naylor G, Slice D, eds. Advances in morphometrics, NATO ASI Series A: Life Science, Vol. 284. New York, NY: Plenum Publishing Corp. Dean D. 1996. Three-dimensional data capture and visual ization. In: Marcus L, Corti M, Loy A, Naylor G, Slice D, eds. Advances in morphometrics, NATO ASI Series A: Life Science, Vol. 284. New York, NY: Plenum Publishing Corp. Dryden IL, Mardia KV. 1998. Statistical shape analysis. Chichester: John Wiley & Sons. Fadda C, Faggiani F, Corti M. 1997. A portable device for the three dimensional landmark collection of skeletal ele ments of small mammals. Mammalia 4: 622–627. Fritz U, Angelo S, Pennisi MG, Lo Valvo M. 2006. Varia tion of sicilian pond turtles, Emys trinacris. What makes a species cryptic? Amphibia-Reptilia 27: 513–529. Gerlach J. 2004. Giant tortoises of the Indian Ocean. Frank furt am Main: Chimaira. �� ther H. 1985. The combination of Guillet A, Doyle WS, R u photogrammetry and finite elements for a fine grained func tional analysis of anatomical structures. Zoomorphology 105: 51–59. Lu Y, Zhang JZ, Wu QMJ, Li ZN. 2004. A survey of motion-parallax-based 3D reconstruction algorithms. Systems, Man and Cybernetics, Part C, IEEE Transactions 34: 532–548. van der Meijden A, Chiari Y. 2005. Reconstruction of 3D coordinates of turtle shells from digital photographs using
commercial photogrammetry software. I Congress of Italian Evolutionary Biologists, Ferrara, Italy. Moore DS, McCabe GP. 2004. Introduction to the practice of statistics, 5th edn. New York, NY: Freeman and Company. Olson LE, Goodman SM, Yoder AD. 2004. Illumination of cryptic species boundaries in longtailed shrew tenrecs (Mammalia: Tenrecidae; Microgale), with new insights into geographic variation and distributional constraints. Biologi cal Journal of the Linnean Society 83: 1–22. Reig S. 1996. Correspondence between interlandmark dis tances and caliper measurements. In: Marcus L, Corti M, Loy A, Naylor G, Slice D, eds. Advances in Morphometrics, NATO ASI Series A: Life Science, Vol. 284. New York, NY: Plenum Publishing Corp. Rohlf FJ. 1990. Morphometrics. Annual Review of Ecology and Systematics 21: 299–316. Rohlf FJ, Marcus LF. 1993. A revolution in morphometrics. Trends in Ecology and Evolution 8: 129–132. Shirley P, Ashikhmin M, Gleicher M, Marschner S, Reinhard E, Sung K, Thompson W, Willemsen P. 2005. Fundamentals of computer graphic, 2nd edn. Natick, MA: A. K. Peters Ltd. Spencer MA, Spencer GS. 1995. Technical note: video-based three-dimensional morphometrics. American Journal of Physical Anthropology 96: 443–453. Stevens WP. 1997. Reconstruction of three-dimensional ana tomical landmark coordinates using video-based stereopho togrammetry. Journal of Anatomy 191: 277–284. Strauss RE, Bookstein FL. 1982. The truss: body form reconstruction in moprhometrics. Systematics Zoology 31: 113–135. Zelditch ML, Swiderski DL, Sheets HD, Fink WL. 2004. Geometric morphometrics for biologists. A primer. San Diego, CA: Elsevier Academic Press. Zhang Z. 2000. A flexible new technique for camera calibra tion. IEEE Transactions on Pattern. Analysis and Machine Intelligence 22: 1330–1334. Zollikofer CPE, Ponce de Leon MS. 2002. Visualizing patterns of craniofacial shape variation in Homo sapiens. Proceedings of the Royal Society of London Series B, Bio logical Sciences 269: 801–807.
APPENDIX Physical measurements (in mm) obtained on the museum specimen of Aldabra tortoise and on the Galápagos tortoise with the caliper (Euclidean distances), with the flexible tape (geodesic distances), on the model reconstructed with the stereo vision based (SVS), with the photogrammetric (PM) and with the ‘hybrid’ methods. The repeatability indicates the same measurements obtained on the second reconstruction made of the Aldabra tortoise (see Material and Methods). The first column lists the landmarks numbered as in Figure 1. Table A1. Euclidean measurements of the Aldabra tortoise using the Canon camera
Landmarks
Caliper
‘Hybrid’
‘Hybrid’ (repeatability)
PM
PM (repeatability)
SVS
7–8 7–9 7–10 7–11
90.9 200.5 293.2 269.5
90.7 201.1 294.3 267.7
90.7 201.3 293.5 266.0
91.9 201.0 293.2 268.5
91.3 201.8 294.8 270.7
90.1 199.0 291.2 271.3
© 2008 The Linnean Society of London, Biological Journal of the Linnean Society, 2008, 95, 425–436
3D BIOLOGICAL FORM RECONSTRUCTION
435
APPENDIX Continued Landmarks
Caliper
‘Hybrid’
‘Hybrid’ (repeatability)
PM
PM (repeatability)
SVS
7–12 8–9 8–10 8–11 8–12 9–10 9–11 9–12 10–11 10–12 11–12
228.5 122.4 248.7 275.0 266.2 154.0 245.8 279.0 154.0 233.2 95.5
227.5 123.2 249.8 273.7 264.3 153.7 245.4 276.9 155.5 234.2 94.7
227.1 124.1 250.6 273.3 262.2 155.2 247.3 275.2 155.5 232.5 93.1
226.1 120.0 247.9 274.3 264.2 153.0 243.4 276.6 151.5 230.0 96.7
226.8 123.9 249.3 276.6 265.1 154.7 246.5 277.9 154.5 232.7 96.0
229.3 124.6 246.4 274.5 265.5 151.2 244.0 279.1 154.4 235.2 96.7
Table A2. Geodesic measurements of the Aldabra tortoise using the Canon
Landmarks
Tape ruler
‘Hybrid’
‘Hybrid’ (repeatability)
PM
PM (repeatability)
SVS
6–13 4–15 8–11 5–16 3–14 5–12 7–14 7–10 9–12
317.0 297.0 295.0 310.0 330.0 315.0 310.0 310.0 300.0
317.7 296.9 291.6 312.7 327.9 316.6 312.1 311.4 299.6
314.1 298.4 291.3 310.5 327.2 311.7 311.5 311.6 297.0
295.5 289.5 273.6 303.5 319.7 300.3 295.2 292.6 277.6
296.4 281.6 274.9 301.6 314.1 303.7 298.3 294.6 279.6
314.9 291.0 299.4 308.6 329.6 318.7 305.5 307.6 304.9
Table A3. Euclidean measurements of the Aldabra tortoise using the Pentax camera Landmarks
Caliper
PM
SVS
7–8 7–9 7–10 7–11 7–12 8–9 8–10 8–11 8–12 9–10 9–11 9–12 10–11 10–12 11–12
90.9 200.5 293.2 269.5 228.5 122.4 248.7 275.0 266.2 154.0 245.8 279.0 154.0 233.2 95.5
93.1 202.6 293.9 267.9 228.0 122.6 247.9 273.9 265.6 153.1 243.7 278.8 153.8 232.8 96.8
91.4 202.8 291.7 265.9 224.6 124.4 252.4 272.2 265.0 153.0 243.4 282.9 154.5 237.0 98.5
© 2008 The Linnean Society of London, Biological Journal of the Linnean Society, 2008, 95, 425–436
436
Y. CHIARI ET AL.
Table A4. Geodesic measurements of the Aldabra tortoise using the Pentax camera Landmarks
Tape ruler
PM
SVS
6–13 4–15 8–11 5–16 3–14 5–12 7–14 7–10 9–12
317.0 297.0 295.0 310.0 330.0 315.0 310.0 310.0 300.0
297.7 289.4 273.9 304.0 321.9 302.3 296.4 293.9 278.8
308.0 295.0 285.3 312.4 326.5 309.5 311.4 307.5 302.5
Table A5. Euclidean measurements of the Galápagos tortoise using the Pentax camera Distances
Caliper
‘Hybrid’
3–16 4–15 6–13 5–14 15–19 13–20
202.0 195.0 222.0 170.0 181.0 209.0
203.2 195.6 221.9 168.0 178.4 208.6
© 2008 The Linnean Society of London, Biological Journal of the Linnean Society, 2008, 95, 425–436