The Journal of Mental Health Policy and Economics J. Mental Health Policy Econ. 3, 175–186 (2000) DOI: 10.1002/mhp.96
Using Epidemiological Data to Model Efficiency in Reducing the Burden of Depression Gavin Andrews1,2∗ Kristy Sanderson1,2 Justine Corry1,2 and Helen M. Lapsley1,3 1
WHO Collaborating Centre in Epidemiology and Health Policy, St. Vincent’s Hospital, Sydney, Australia 2 School of Psychiatry, University of New South Wales, Australia 3 School of Health Services Management, University of New South Wales, Australia
Abstract Background: The Global Burden of Disease study has suggested that mental disorders are the leading cause of disability burden in the world. This study takes the leading cause of mental disorder burden, depression, and trials an approach for defining the present and optimal efficiency of treatment in an Australian setting. Aims of the Study: To examine epidemiological and service use data for depression to trial an approach for modelling (i) the burden that is currently averted from current care, (ii) the burden that is potentially avertable from a hypothetical regime of optimal care, (iii) the efficiency or cost-effectiveness of both current and optimal services for depression and (iv) the potential of current knowledge for reducing burden due to depression, by applying the WHO five-step method for priorities for investment in health research and development. Methods: Effectiveness and efficiency were calculated in disability adjusted life years (DALYs) averted by adjusting the disability weight for people who received efficacious treatment. Data on service use and treatment outcome were obtained from a variety of secondary sources, including the Australian National Survey of Mental Health and Wellbeing, and efficacy of individual treatments from published meta-analyses expressed in effect sizes. Direct costs were estimated from published sources. Results: Fifty-five percent of people with depression had had some contact with either primary care or specialist services. Effective coverage of depression was low, with only 32% of cases receiving efficacious treatment that could have lessened their severity (averted disability). In contrast, a proposed model of optimal care for the population management of depression provided increased treatment contacts and a better outcome. In terms of efficiency, optimal care dominated current care, with more health gain for less expenditure (28 632 DALYs were averted at a cost of AUD295 million with optimal care, versus 19 297 DALYs averted at a cost of AUD720 million with current care). However, despite the existence of efficacious technologies for treating depression, only 13% of the burden was averted from present active treatment, primarily because of the low effective coverage. Potentially avertable burden is nearly three times this,
* Correspondence to: Gavin Andrews, M.D., UNSW Psychiatry at St. Vincent’s Hospital, 299 Forbes Street, Darlinghurst, NSW 2010, Australia. Email address:
[email protected] Source of funding: This study was part of a project funded by the Australian National Health and Medical Research Council (No. 113807). Contract grant sponsor: Australian National Health and Medical Research Council Contract grant number: 113807
if effective treatments can be delivered in appropriate amounts to all those who need it. Discussion: This paper reports a method to calculate the burden currently averted from cross-sectional survey data, and to calculate the burden likely to be averted from an optimal programme estimated from randomized controlled trial data. The approach taken here makes a number of assumptions: that people are accurate in reporting their service use, that effect sizes are a suitable basis for modelling improvements in disability and that the method used to translate effect sizes to disability weight change is valid. The robustness of these assumptions is discussed. Nonetheless it would appear that while optimal care could do more than present services to reduce the burden of depression, current technologies for treating depression are insufficient. Implications for Health Care Provision and Use: There is an urgent need to educate both clinicians (primary and specialist) and the general public in the effective treatments that are available for depression. Implications for Health Policies: Over and above implementing treatments of known efficacy, more powerful technologies are needed for the prevention and treatment of depression. Implications for Further Research: Modelling burden averted from a variety of secondary sources can introduce bias at many levels. Future research should examine the validity of approaches that model reductions in disability burden. A powerful treatment to relieve depression and prevent relapse is needed. Copyright 2000 John Wiley & Sons, Ltd. Received 17 August 2000; accepted 27 December 2000
In the Global Burden of Disease (GBD) project1 – 3 depression was ranked fourth in terms of global burden. It was predicted to rank second by 2020, but not because the burden of depression would increase dramatically. Instead the burden of respiratory infections, diarrhoeal and perinatal diseases would lessen, and epidemiological transition would place more populations at risk of disorders present in high-income countries.2 Depression is common and is defined by a persistent lowering of mood, reduction in energy and decrease in activity.4 The persistence of the burden of depression, at least in the affluent world, is a puzzle because four classes of antidepressant drugs, cognitive behaviour therapy and electro-convulsive therapy have been shown, in replicated randomized controlled trials, to be significantly superior to placebo.5 In the light of the evidence of efficacious treatment there are three possibilities as to why the burden of depression persists in established 175
Copyright 2000 John Wiley & Sons, Ltd.
market economies: the burden estimates are wrong; people do not receive treatment; or people do not receive effective treatment. Data from the Australian National Survey of Mental Health and Wellbeing6 were used to inform the report on the burden of disease and injury in Australia. This 1999 report7 confirmed the original estimates of the burden of depression and did not suggest that the burden was decreasing, at least in respect to the estimates of the original 1990 global burden of disease report. Further analysis of the National Survey data8 showed that the burden persisted because nearly half of the people who met criteria for a major depressive disorder during the year did not seek treatment during the year, and of those that did seek treatment only half received one of the treatments listed above. Coverage, competence and compliance are the three big issues in reducing the burden of any disease by clinical intervention. In depression, coverage and competence are poor, a finding evident in other national surveys.9 There are two reasons why efficacious treatments for depression might not be effective in practice. The first is the magnitude of the placebo response.10 Depression is an episodic disorder and spontaneous remission within months is not uncommon. The placebo effect, the response to the encouragement of being in treatment, is also considerable. In randomized placebo controlled trials, the improvement attributed to spontaneous remission and the placebo effect are together twice the size of the additional improvement attributed to the active treatment. Secondly, as depression is a remitting disorder11,12 doctors have the view that depression is easy to treat and that recovery from the episode is the mark of success. Unfortunately it is also a recurring disorder,13 with a 12 year follow-up of treated clinic cases showing that people have symptoms for 60% of the time and meet full diagnostic criteria for 15% of the time.14 Depression is associated with an increased risk of premature death, particularly from suicide.15 Twenty percent, not necessarily the most severe, are resistant to or reluctant to access treatment.14 Elsewhere we have argued that depression should be managed proactively as a chronic disorder.16 It is unreasonable to expect people who have relapsed, losing motivation and hope in the process, to actively seek or comply with treatment. The GBD study introduced a new metric, the disability adjusted life year (DALY),1 which estimated the years of healthy life lost by summing premature death and living with a disability. It was developed as a measure of burden expressed as DALYs lost. Measured burden may be partially suppressed by existing services,17 resulting in a lesser burden than would otherwise have been apparent in the absence of those services. It may therefore be feasible to determine the impact of current services on observed burden from population service use data. The DALY was also developed as a measure of outcome in cost-effectiveness analysis, expressed as DALYs averted. The benefits of a treatment in DALYs averted can therefore be in reduced mortality or in reduced morbidity, or both. Reduced morbidity, with which this paper is largely concerned, can be 176 Copyright 2000 John Wiley & Sons, Ltd.
measured from changes in the disability severity weight. Depression will be used as the example to illustrate a method whereby epidemiological and service use data can inform the reduction in DALYs from current care. The same procedure will be used to model a hypothetical scenario of the maximum burden avertable from optimal care. This approach is illustrated in Figure 1. The overall impact of current and optimal care in reducing burden, and the maximum burden avertable from existing technologies, can then be summarized through the application of the WHO five step method for priorities for investment in health research and development.18 This study examines epidemiological and service use data for depression to trial an approach for modelling (i) the burden that is currently averted from current care, (ii) the burden that is potentially avertable from a hypothetical regime of optimal care, (iii) the efficiency or cost-effectiveness of both current and optimal services for depression and (iv) the potential of current knowledge for reducing burden due to depression, by applying the WHO five step method.18
Method Definition of Current and Optimal Care Burden averted from current care was estimated for the proportion of cases who had met criteria for depression during the past 12 months who had been in contact with the health system in the past 12 months. Outcomes for current care were attributed to the smaller proportion who had been in contact with notionally efficacious care (defined below), estimated from the National Survey.6 Optimal care represented a hypothetical population management strategy for depression for present coverage, to estimate the gains possible if all those already in contact with the health system received efficacious treatment. For adults this strategy was adapted from the New Zealand National Health Committee work on the treatment of depression,19 and revised by an expert group for the Royal Australian and New Zealand College of Psychiatrists evidence-based clinical practice guideline project (Ellis and Smith, unpublished manuscript). Depression was stratified by severity, with the numbers in each category sourced from the Australian National Survey.6 An additional school-based screening programme for young people at risk of anxiety and depression was also included.20
Data Analytic Methods The data sources and values for calculating burden, burden averted and costs of care are presented in Table 1. Calculating the Burden of Disease from Depression The number of years of healthy life lost to depression was calculated as the sum of years of life lost due to premature death (YLLs) and the years lived with disability (YLDs). YLLs are calculated from the remaining life expectancy at age of death (how many years one G. ANDREWS ET AL. J. Mental Health Policy Econ. 3, 175–186 (2000)
Figure 1. Inputs required to model efficiency of current treatment and optimal treatment in reducing the burden of disease USING EPIDEMIOLOGICAL DATA TO MODEL EFFICIENCY Copyright 2000 John Wiley & Sons, Ltd.
177 J. Mental Health Policy Econ. 3, 175–186 (2000)
Table 1. Summary of variable sources and values for calculating burden, burden averted and efficiency for depression in Australia Secondary sources Australian National Survey Literature review a
Burden of diseasec Deaths in population Prevalence in population Incidence in population Duration in yearsd Disability weighte DALYS averted Disability weight change Effect size changef Pharmacotherapy Psychological therapy Self-help therapy 1 SD conversion factor Costs of careg (AUD) Current care (per person) Optimal care (per person)
Other published sources
b
Primary sources Commissioned studies
— 301 613 229 890 — —
— — — 1.3 —
46 — — — —
— — — — 0.417
— — — —
0.55 0.82 0.75 —
— — — —
— — — 0.152
— —
— —
2012 Various unit costs
— 824
The Australian National Survey of Mental Health and Wellbeing6 was a representative survey of households (N = 10 461). Refer to reference.7,30 – 32 Data on deaths were from data tables supplied by the Australian Bureau of Statistics. c ICD-104 prevalence modelled in DISMOD to obtain incidence estimates consistent with observed prevalence from the survey and duration from the literature. The DISMOD disease-modelling computer programme is described by Murray and Lopez.1 Prevalence was adjusted to account for comorbidity. d Estimate of duration from non-clinical, community samples.11,12 Burden was based on cases and not episodes, and thus the duration is a combination of the expected number of episodes and the duration of each episode for incident cases. e From Australian-based vignettes valued by general practitioners with the person trade-off method. f Refer to reference.26 – 28,41 g Costs of current care were based on a top-down approach, by using health system expenditure7 on depression and dividing by the number of people with depression in treatment. Costs of optimal care were calculated with a bottom-up approach, by specifying a hypothetical disease management strategy and costing each component. a
b
would have lived if not dying early), applied to all deaths attributed to depression. YLDs are calculated as the product of incidence, duration of disabling sequelae and severity of disability. Severity is measured with a disability weight derived from preference scores, which have a value between 0 (best health state imaginable) and 1 (worst health state imaginable). These weights represent the social value of a disorder.1 We applied the methods described in the Global Burden of Disease report1 to Australian data for 1997 on the mortality and epidemiology of depression. The sources and values of this data are described in Table 1. Mortality data was obtained from data tables supplied by the Australian Bureau of Statistics. Prevalence was adjusted to account for comorbidity by including only the 70% of people with depression who nominated it as their only or main complaint, referred to as core depression. The episodic nature of depression was accounted for by using a point prevalence of current cases (the subset of those with 12 month depression who had been symptomatic in the previous 4 weeks, 2.2%, N = 301 613). As burden was based on cases of depression rather than episodes, duration was estimated from both the expected number of episodes and their median length.11,12 Internally consistent estimates of incidence were obtained from this prevalence and duration through use of the DISMOD software package,1 developed specifically for this purpose. A disability weight of 0.417 was used, representing the weighted mean for mild (weight = 0.09), moderate (weight = 0.34) 178 Copyright 2000 John Wiley & Sons, Ltd.
and severe (weight = 0.70) depression. These weights were obtained in a separate study with valuations made using the person trade-off method, and are similar to those obtained in a Dutch study.21 In the original study1 age weighting and 3% discounting were applied. These have not been applied for the present illustration. Estimating Burden Averted from Current and Optimal Care Methods for estimating change in the DALY components, particularly those related to YLDs, are still being developed.22,23 Changes in YLDs requires showing change in epidemiology (prevalence, incidence, duration) and/or disability (the preference-based disability weight). Reductions in prevalence (the number of remitted or cured cases) were not estimated, as outcome studies usually focus on reductions in symptoms and disability, seldom reporting changes in caseness. While it is possible to artificially define a cut-off for ‘cured’ cases, this approach fails to capture the gains made by people who improved but did not remit, and was not adopted. Effectiveness calculations for both current and optimal care were thus based on estimated changes in the disability weight, based on the number of people who had received efficacious treatment. For current care this was estimated from self-reported treatment contacts in the National Survey, with efficacious treatment notionally defined as seeing a health professional more than once and receiving either cognitive behaviour therapy or a prescription for medication. For optimal care, a G. ANDREWS ET AL. J. Mental Health Policy Econ. 3, 175–186 (2000)
hypothetical treatment scenario that modelled ideal treatment is presented. For both current and optimal care, the change in disability weight due to efficacious treatment was estimated from meta-analyses of published controlled trials. Treatment outcome in controlled trials is measured by changes in symptoms and functioning. Preferences, which could inform the expected change in disability weight with treatment, are not. A method was therefore devised to estimate the reduction in disability weight from observed changes on symptom and functioning measures expressed as effect sizes. The effect size measures the superiority of the treatment group over the control group, expressed as standard deviation shifts in symptoms and disability. It incorporates the change made by all those in treatment, including those who could be classed as ‘cured’ in addition to those who make more modest gains. A description of the relationship between this treatment outcome and changes in preferences would provide a simple method of modeling preference weight change from the change observed in controlled trials. This relationship is not available from the literature in psychiatry, and expert opinion is not ideal. This relationship for depression (and four other mental disorders for the purposes of similar analysis) was therefore described in a prospective fashion by obtaining preference weights for experimentally manipulated vignettes. Four descriptions of depression that represented one standard deviation increments in severity were valued using the rating scale and time trade-off methods. The difference in preference score between adjacent vignettes represents the relationship between a 1 SD improvement in health status and the associated change in disability weight. The average improvement in preference score for depression with a one standard deviation improvement in disability and symptoms was 0.152, averaged across severity levels and method of preference elicitation. A final decision then presents itself: whether to estimate the benefit of the specific treatments alone or including the placebo effect. There is one meta-analysis24 that argues that one-third of the progress of the placebo control group was due to natural history (spontaneous remission and regression to the mean) and two-thirds due to the true placebo effect of being in treatment. In that study the placebo effect was twice as large as the drug effect, whereas in data collected for another purpose25 we estimate that the placebo effect, while still important, produced improvement equivalent in magnitude to the active treatment agents. As there is discussion as to whether the placebo effect is permanent, we have taken the lower of these two estimates. In each case the non-specific and specific effects are additive. We therefore provide data that illustrate the burden averted attributable to the specific or active remedies, and then to the burden averted that is attributable to the combined effect of placebo and active treatment but not including the change due to spontaneous remission. The calculation of averted disability for both optimal and current care therefore required the mean effect size change (with and without the placebo effect), obtained from the controlled trial literature. Meta-analyses were USING EPIDEMIOLOGICAL DATA TO MODEL EFFICIENCY Copyright 2000 John Wiley & Sons, Ltd.
selected on the basis of recency and methodological rigor. Meta-analysis of the efficacious treatment of depression is associated with a 0.55 SD improvement over placebo for pharmacotherapy26 and 0.82 for psychological therapy (cognitive therapy and cognitive behaviour therapy).27 Using the translation factor of 0.152 described above, these gains would correspond to a 0.084 and 0.125 improvement in disability weight, respectively, which were then applied to the proportion of treatment-seekers that had received each intervention. Improvements that include the placebo effect (but not the natural history) are 0.168 and 0.250. An additional estimate of the efficacy of self-help therapies28 was also obtained for the optimal care calculation, with the effect size of 0.75 converted to a disability weight change of 0.114 (and 0.228 including placebo). The apparently greater efficacy of self-help in relation to medication was due to the milder cases who enroll in trials of self-help. Efficiency: Cost-effectiveness of Current and Optimal Treatment Two estimates of efficiency are calculated for current and optimal care: the cost per treated case and the cost per DALY averted. Cost per case for current care was estimated by simply dividing the number of depressed people treated in 1997 by the expenditure on depression for that year. The 1999 Burden of Disease and Injury in Australia7 listed the amounts spent on each disease category for 1993/94 (including specialist inpatient and community mental health services, general practitioner contacts, and pharmaceuticals). The cost of affective disorders is listed as $644 million7 (Table 6.6). For the present purposes this figure will be taken as correct and adjusted for likely expenditure in 1998/99 (the amount expended on mental health rose by about a quarter in that time), giving a figure of $800 million. Depression is only part of the affective disorders and Kessler in the US National Comorbidity survey29 reported that 90% of people with an affective disorder were suffering from depression. Presuming, for the sake of the present argument, that the costs per case of dysthymia and mania are comparable, we will use the figure of 90% of $800 million or $720 million as the amount expended on depression. We confine our attention to adults, as expenditure on children is listed separately. Treatment regimes for optimal care were costed for each level of depression severity. The cost of optimal treatment was limited to direct variable costs, such as staff costs (psychiatrists, clinical psychologists and general practitioners (GPs)), pharmaceuticals, bed days and treatment programme materials. Unit costs were obtained from published sources.30 – 32 Cost per treated case was based on modeled service provision and the unit costs. Total cost was based on modeled coverage in the Australian population. Potential of Current Knowledge for Reducing Burden Due to Depression The potential of current knowledge for averting burden due to depression in Australia was estimated using the WHO five step method for priorities for investment in 179 J. Mental Health Policy Econ. 3, 175–186 (2000)
health research and development.18 This framework takes the total burden of disease (current burden plus burden currently averted) as a baseline, and calculates the proportion of total burden averted by current services, potentially avertable by improved efficiency and unavertable with existing interventions.
Results Burden of Depression The burden of depression for the present analysis was calculated as 127 166 DALYs lost (YLLs = 284, YLDs = 126 882). YLLs were low due to the small number of deaths that had depression coded as the primary cause (n = 46), which all occurred in the 65+ age group. YLDs were based on a population point prevalence of 2.2%, and a disability weight of 0.417. As the contribution of YLLs to DALYs was so small, and the calculations of effectiveness described below relate to averted YLDs, DALYs in the analyses below refers to YLDs only.
Effectiveness of Existing Services: Burden Currently Averted Of the people with core depression, 32% (N = 205 288) had received an efficacious treatment (defined as seeing a health professional more than once and receiving a prescription for medication or cognitive behaviour therapy). This will be an overestimate because judging from Sturm and Wells33 not all would have received and taken an antidepressant. Of this 32%, 24% had received cognitive behaviour therapy and 91% medication. We attributed the CBT effect size (and corresponding disability weight change) to the 24% (as this treatment is more effective than medication), and the antidepressant effect size to the remaining 76% who did not receive CBT. The DALYs averted from treatment are thus calculated as the number receiving adequate treatment multiplied by the change in disability weight. The disability weight change estimated from effect sizes for medication (0.084) and psychological therapy (0.125) were applied to the 76% and 24% of cases who had received each, respectively. This provided 19 297 DALYs averted through lessened severity, double this if the placebo effect was added.
Efficacy of Optimal Care: Burden Potentially Averted There are two target populations for optimal care. We are firstly modelling the delivery of services to adults that seek treatment (see Table 2), which represents the 55% (n = 357 903) with core depression who consulted once or more times for a mental problem during the year. The second group are young people at risk of developing anxiety and depression. Early intervention can reduce the risk of developing depression in those at risk, which will result in a lowered prevalence in the future from the reduction in incidence. A hypothetical disease management 180 Copyright 2000 John Wiley & Sons, Ltd.
regime for adults, based on clinical practice guidelines,19 and young people at risk is shown in Table 2, and is described in some detail below. Adults with depression are categorized by severity (mild, moderate, severe, severe with pronounced comorbidity or treatment-resistant depression). (i) Young people at risk. Those identified as being at risk of anxiety or depression (15% of all people aged 13 years 20 ) should have a 20 hour group programme on coping with emotions and stress. While the costs are incurred in the reference year, the benefits are incurred in the future, and thus are not included in the estimate of DALYs averted. (ii) Mild depression. 50% will remit spontaneously or after seeing a GP for two sessions, and a further 20% will elect to use self help books to recover. The remaining 30% will see a GP five times for counselling and structured problem solving and 5% will take an SSRI for three months and a similar number will seek psychological therapy for six sessions. (iii) Moderate depression. 30% will remit spontaneously or with self-help books after two sessions with a GP, the remainder will average six sessions of psychoeducation, counselling and structured problem solving with a GP, 50% will take an SSRI for 6 months and 20% will be referred for six sessions of psychological therapy. (iv) Severe depression. 10% will remit spontaneously or with self-care after four sessions with a GP, the remainder will see a GP for an average of eight sessions for psychoeducation, counselling and structured problem solving; 80% will take an SSRI for 12 months, 20% will have six sessions of psychological therapy, 50% will see a specialist an average of four times, 10% will spend an average of 8 days in hospital and a further 10% will require 20 sessions of support from a community health service. (v) Severe depression with pronounced comorbidity. All will see a GP for eight sessions in the year and all will see a specialist an average of eight times. All will take an SSRI for 12 months and 20% will also receive six sessions of psychological therapy. 20% will spend an average of 10 days in hospital during the year and 20% will need an average of 20 sessions of support from a community mental health service or drug and alcohol service. (vi) Treatment-resistant depression. Some 20% of all people with a depressive illness become chronic and treatment resistant whatever is done. They are not always the most severe. We have done two surveys: one a 15 year follow-up of cases from specialist care34 and the other a six month follow-up of cases identified in general practice.35 On the basis of these surveys it is likely that many cease treatment, and we can estimate that 20% would find the self-help book useful. As Calman36 argued, they are entitled to continuing primary and emergency care. We have estimated an G. ANDREWS ET AL. J. Mental Health Policy Econ. 3, 175–186 (2000)
USING EPIDEMIOLOGICAL DATA TO MODEL EFFICIENCY
Copyright 2000 John Wiley & Sons, Ltd.
181
J. Mental Health Policy Econ. 3, 175–186 (2000)
38 312 357 903 58 123 142 875 42 662 42 662 71 581
0 50 15 5 0 0
100
0 0 0 0 0
20 15 5 0 20
0 30 70 90 100 80
0 5 50 80 100 50
0
Medication (%)
5 20 20 20 0
0
Psychologist (%)
0 0 50 100 0
0
Psychiatrist (%)
0 0 10 20 0
0
CMHC (%)
0 0 10 20 5
0
Inpatient (%)
Percentage of patients allocated to GP care/specialist care who need the various types of specialist care
145 314 1297 2743 946 824
40
Cost per persona (AUD)
Note: CMHC = Community Mental Health Centre, GP = General Practitioner a Costs in Australian dollars: GP visit = $46.70; psychologist/CMHC visit = $46.70; psychiatrist visit = $114.50; SSRI for 12 months = $445.00; acute hospital bed day = $376.00; prevention course contribution = $40.00; self-help book = $3.00. b For the treatment-resistant category, those in the self-help/GP group also require specialist care.
Adolescents High risk Adults Mild Moderate Severe Severe comorbid Treatment resistantb Total
Severity Category
N to be treated
Percent of patients who remit or need self-help/ GP care or GP care/specialist care Spontaneous Prevention remission Self-help/GP care GP care/specialist care (%) (%) (%) (%)
Table 2. Optimal care for depression for 1 year: percentage of patients allocated to each severity/care category and cost per case.
Table 3. Comparative efficiency of current and optimal care for depression in Australia: current care is in relation to the 32% of cases who had been in contact with efficacious care in the past year, and optimal care is a hypothetical treatment strategy for the 55% of cases who had been in contact with services in the past year Current care DALYs averted and efficiency DALYs averted from reduced disability N (%) who received efficacious carea Disability weight gainb DALYs averted Efficiency Total cost of treatment (AUD million) $ per DALY averted
Optimal care
Excluding placebo effect
Including placebo effect
Excluding placebo effect
Including placebo effect
205 288 (32%) 0.094 19 297
205 288 (32%) 0.186 38 594
357 903 (55%) 0.080 28 632
357 903 (55%) 0.160 57 264
720 37 312
720 18 656
295 10 301
295 5150
a
Efficacious care was defined as more than one contact from a health professional and receiving medication or cognitive behaviour therapy. Averted disability was estimated from effect size change from meta-analyses for efficacious interventions, converted to a disability weight change based on an observed association between symptom and functioning improvement and preference weight change (see ‘Method’). b
average of 12 GP consultations, and estimated that 50% will be on maintenance SSRIs and that 5% will need an average of 8 days respite care in hospital. Averted disability for this hypothetical, optimal care strategy was calculated by applying the disability weight changes as described above to the proportions in each severity category who received medication, psychological therapy or self-help (the manual provided by a general practitioner). This resulted in a weighted disability weight change of 0.080 for optimal care of depression when stratified by severity and with a disease management approach. This is less than the 0.094 disability weight change for current care because no improvement (only maintenance) is credited to the 20% who are treatment resistant. However under optimal care this weight change of 0.080 is applied to more people. There were 357 903 people receiving treatment under the optimal care strategy, and this therefore resulted in 28 632 DALYs averted (57 264 including the placebo effect).
Efficiency: Cost-effectiveness of Current and Optimal Treatment (i) Current care. The cost-effectiveness of current services can be estimated by comparing the number of people treated and burden averted to the total health expenditure on depression. From the National Survey we have previously noted that the treated prevalence of core depression in Australia was 357 903 adults. The average cost per treated case was therefore $720 million divided by 357 903 or $2012 per case, a third of the costs, according to the Burden of Disease report,7 being attributed to inpatient treatment. We earlier estimated that 19 297 DALYs were averted with specific treatment. This equates to a cost effectiveness figure of $37 312 per DALY averted and $18 656 per DALY averted if the placebo effect is added. These calculations are presented in Table 3. 182 Copyright 2000 John Wiley & Sons, Ltd.
(ii) Optimal care. The efficiency of optimal care for depression was examined both in terms of the calculated costs per case, and the cost-efficacy in DALYs averted (refer to Table 3). The total cost for prevention, cure and care of optimal treatment was $295 million, less than half the present budget allocated to the task. The average cost was $824 per treated case, presuming that all doctors carried out the planned treatment and all patients complied with the treatment. Part of the saving is because only 20% of the budget is expended on inpatient care and this represents only one-third of what is spent currently. However, the number of ambulatory consultations with a health professional increased from the average of 3.6 per treated case in the survey to 10 per treated case in this modelling. With a total cost of direct treatment at just under $295 million and 28 632 DALYS averted, this represents $10 301 per DALY averted, half this if the effects of placebo are added. The efficiency of current specific treatments for depression previously calculated was $37 312 per DALY averted. This is substantially more than the $10 301 per DALY for optimal care, which even in practice, should be no more than double this. The value for current specific treatment is nearly four times higher than optimal care, attributed in part to the inordinate current use of inpatient facilities for depression, especially in private hospitals and in the non-psychiatric beds of general hospitals.
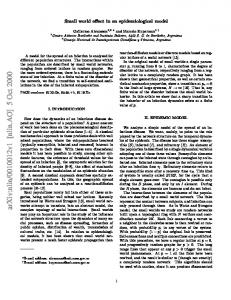
Potential of Current Knowledge for Reducing Burden due to Depression We can now make some statements about the present and potential performance of the health sector in relation to the treatment of depression. Figure 2 presents the relative shares of the burden that can and cannot be averted with existing tools. The area in each box is the product of effective coverage in the population and the combined efficacy of existing technologies for treating depression. Effective G. ANDREWS ET AL. J. Mental Health Policy Econ. 3, 175–186 (2000)
Combined efficacy of intervention mix 100%
(c) Unavertable with existing interventions (33%)
67% Additional avertable including placebo effect (31%)
36% (a) Averted with current mix of interventions and coverage (13%) 0%
(b) Additional avertable with improved efficiency (23%)
32% Effective coverage in population
100%
Figure 2. Relative shares of the burden of depression that can and cannot be averted with existing tools, adapted from the WHO five-step model for analysing the burden of a health problem to identify research needs (refer p. 7 of reference 18). Percentages represent the proportion of total burden (area represented by the whole box) that is (a) currently being averted by existing services, (b) additional burden that could be averted with improved efficiency and (c) burden that is not able to be averted with existing interventions. Additional burden averted when the placebo effect is included is shown separately. An additional possibility for the mix of interventions within the WHO model, avertable with existing but non-cost-effective interventions, is not applicable to depression
coverage for the current mix of services was defined from the proportion of cases currently receiving efficacious treatment (32%). Potential effective coverage was estimated at 100%, as with improved efficiency Australia could afford to treat all people with depression. Based on the above calculations, the current mix of specific treatments averts 13% of the total burden of depression in Australia. At present coverage, 20% of the burden could be averted with optimal care. If we pro rata this to 100% coverage, we find that the maximum possible burden averted through the perfectly efficient application of existing knowledge is 36%. This leaves 64% of the burden of depression that is not avertable with current specific treatments, although this halves once the placebo effect is added. This points to a substantial need for research into both the primary prevention of depression, and into discovering newer and more powerful intervention strategies.
Discussion Using the WHO five-step method18 we are investigating why the burden of each major mental disorder persists. When there are efficacious treatments we plan to enquire what is the power of the most cost-effective programme of treatment. We used the DALY as it is both a measure of USING EPIDEMIOLOGICAL DATA TO MODEL EFFICIENCY Copyright 2000 John Wiley & Sons, Ltd.
burden and a measure of outcome for economic analysis, with cost effectiveness analysis the most suitable project evaluation technique for this type of non-monetary outcome measure.37 In this paper we report a method to calculate the burden currently averted from cross sectional survey data and to calculate the burden likely to be averted from a new treatment programme, with the method relying on a reduction in disability weight. Taking depression as an exemplar we show that some 13% of the burden of depression is currently being averted by specific treatment at a cost of some $37 000 per DALY gained. If a stepped care model that incorporates prevention, self-care, primary care and specialist care is implemented, the present budget would allow effective coverage to increase to 100%, the burden averted by specific treatment to increase to 36% and the efficiency to increase to $10 000 per DALY gained. The burden averted if the placebo response is added to the equation is correspondingly greater. However complete coverage is unlikely and therefore the savings from efficient treatment could be spent elsewhere in the health system.
Threats to Validity These calculations are to demonstrate a method. The results depend on the accuracy of the cost figures supplied by the Australian Institute of Health and Welfare7 and on 183 J. Mental Health Policy Econ. 3, 175–186 (2000)
the treated prevalence data obtained from the National Survey of Mental Health and Well-Being.6 Both are best estimates. While the results themselves are interesting, the assumptions implicit in the calculations, and the sensitivity of our conclusions to alternative estimates or methods of calculation, need to be examined. The sensitivity of the DALY as an outcome measure for low-mortality disorders has received little investigation,22 and may have contributed to our low estimates of burden averted. More broadly, concern has been expressed at the sensitivity of summary measures such as QALYs (and thereby DALYs) to the gains observed in mental health trials.38 – 41 The present calculations did not include averted mortality or prevalence. As with other studies the present calculations of burden from depression did not directly include suicide,1,7 although an increased all-cause risk of excess mortality15 was modelled. If some of the suicide deaths in Australia were attributed to depression as the primary cause of death, the total burden would increase, thereby reducing the proportion of burden averted. This is because there is a paucity of evidence that treatment reduces suicide in people with depression.42 Averted prevalence was not modelled as changes in casesness are generally not measured in psychiatry, those for depression represent arbitrary cut-offs of what constitutes a ‘cure’, and do not include the gains made by people who improve but do not remit. DALYs averted were thus modelled from changes in disability severity, using trial outcomes expressed in effect sizes which includes the gains made by all in treatment. For current care, these gains were applied to the people who reported they had received medication or cognitive behaviour therapy. This self-reported service use could potentially have been underestimated; however, there is evidence that survey respondents are more likely to overestimate rather than underestimate their service use.43 We have erred on the side of conservatism in that we have added no averted burden due to primary prevention of depression in adolescents (via the prevention of anxiety), firstly because that work is in its infancy and secondly because the benefits accrue some time in the future. However it is of interest to note that if this averted prevalence could have been included an additional 3916 DALYs, or 3% of the burden of depression, would be averted. This is based on evidence that 65% of those at risk would develop a depressive episode.44 The validity of our method to translate RCT data into changes in preferences remains to be investigated. Our estimated benefit over placebo for the disability weight was 0.094 for current care (applied to the small number of people who received efficacious care) and 0.080 for optimal care (applied to all cases currently in treatment but including no benefit for the 20% of treatment resistant depression). One medication trial in depression included preference assessment alongside symptom assessment.45 In this study an effect size improvement in symptoms was paralleled by a 0.04 shift in preference score, half the value used in the present study. While this is only one study, 184 Copyright 2000 John Wiley & Sons, Ltd.
our apparently conservative effect size approach may actually have been generous in estimating outcome. We are currently exploring another method of examining this relationship. There are an adequate number of treatment trials across medicine (but not in psychiatry) that have used both symptom/disability measures and preference techniques concurrently. A quantitative review of this literature is currently in progress, and our preliminary results indicate that, on average, a one standard deviation improvement in health status (generic and/or disease-specific measures) is associated with a 0.206 shift in absolute value on the 0–1 preference scale (elicited by one or more of visual analogue scale, time trade-off or standard gamble). The studies reviewed include a diverse array of disorders, such as arthritis, HIV, prostate cancer, fibromyalgia and kidney transplant. This size of shift is comparable to that observed in our prospective study for the five mental disorders described earlier, where the overall shift for all mental disorders was 0.173, and that for depression 0.152 per one standard deviation effect size change. Assumptions have also been made in our top-down approach to costing current care, and our bottom-up approach to costing optimal care. The $720 million cost of current care was based on taking estimated health sector expenditure on affective disorders,7 and apportioning a share to depression. Should a higher cost have been apportioned to the treatment of the 10% of people with dysthymia or mania? If we double that cost, then the cost effectiveness of current treatment drops to $33 166 per DALY ($16 583 including placebo), which is not substantially different to the original estimate of $37 000 per DALY. Apart from direct care resources (hospital, medical, pharmaceutical and outpatient) the $720 million for direct care cost also includes expenditure on nursing homes, nongovernmental residential facilities, research and administration. If we remove this component the cost drops to $545 million, or $28 243 per DALY averted ($14 121 including placebo), and again this is still substantially more than the cost for optimal care. Furthermore, we also made a bottom-up estimate of current care costs by costing the reported total service use of people with depression from the National Survey (inpatient, mental health teams, general practitioners, pharmaceuticals and other health professionals). This gave a figure of $425 million, or $22 024 per DALY ($11 012 with placebo). Even with our most conservative figure for current care (from bottom-up costing), optimal care still dominates, as it is both less expensive and more effective. Why does the specific component of ideal treatment at complete coverage only avert 36% of the burden of depression? In part this could be an artifact of the method of calculation; we argued this is not so as the method of using effect size superiority over the placebo group does not credit medical care with the placebo effect, which, in depression, is considerable. When this is added the burden averted doubles. Even so, perhaps we do lack strong specific treatments for depression. Certainly the long-term follow-up of the US Depression Study Group14 is equally G. ANDREWS ET AL. J. Mental Health Policy Econ. 3, 175–186 (2000)
pessimistic, for in that study specialist care made small inroads on the wellbeing of the cohort in the longer term. One of our aims of the present study was to trial a method for defining a realistic goal for the health system in reducing the burden of depression. We would conclude that a realistic goal with current technologies perfectly applied will be less than the 67% burden averted (when including placebo), but greater than the 36% burden averted (without placebo).
Implications This paper began as an exploration of the feasibility of using epidemiological data to estimate the burden of disease currently averted. The ability to calculate change in disability weight from effect size allowed us to extend this method to calculate the burden likely to be averted if optimal care was instituted. That optimal care results in a better outcome is to be expected. It is so cost-effective that with the money saved it would be possible to afford prevention for all at risk and effective coverage for all prevalent cases of depression, and this is valuable information. On the basis of the present cost-efficacy calculations for optimal care, and shadow price estimates at which developed countries cease to be able to afford treatments,46 optimal treatment for depression should be afforded even if the cost-effectiveness is double the hypothesized cost efficacy figure. The implication is that we need to reorganize the delivery of services for depression. Strategies are required to both educate and encourage clinicians in using evidencebased technologies, but also to educate patients to recognize their depression and seek appropriate help. The information that is of concern is that even if all were treated as best we presently know how, and every doctor optimized the placebo response and every patient complied diligently, a third of the burden would remain. In a well run health system in the real world one might only be able to avert half the burden of depression. We simply need more and better ways to prevent and treat depression. In the light of the WHO Ad Hoc Committee model,18 this is a matter that calls for serious investment in research.
References 1. Murray CJL, Lopez AD (eds). The Global Burden of Disease: a Comprehensive Assessment of Mortality and Disability from Diseases, Injuries and Risk Factors in 1990 and Projected to 2020 . Harvard University Press: Cambridge, MA, 1996. 2. Murray CJL, Lopez AD. Evidence-based health policy: lessons from the Global Burden of Disease Study. Science 1996; 274: 740–743. 3. Murray CJL, Lopez AD. Global mortality, disability and the contribution of risk factors: Global Burden of Disease study. Lancet 1997; 349: 1436–1442. 4. World Health Organization. The ICD-10 classification of mental and behavioural disorders: diagnostic criteria for research. World Health Organization: Geneva, 1993. 5. Nathan PE, Gorman J (eds). A guide to treatments that work . Oxford University Press: New York, 1998. 6. Andrews G, Henderson S, Hall W. Prevalence, comorbidity, disability and service utilisation. Overview of Australian National Mental Health Survey. Br J Psychiatry 2001; 178: 145–153. USING EPIDEMIOLOGICAL DATA TO MODEL EFFICIENCY Copyright 2000 John Wiley & Sons, Ltd.
7. Mathers C, Vos T, Stevenson C. The burden of disease and injury in Australia. Australian Institute of Health and Welfare: Canberra, 1999. 8. Andrews G, Sanderson K, Slade T, Issakidis C. Why does the burden of disease persist? Relating the burden of anxiety and depression to effectiveness of treatment. Bull World Health Org 2000; 78: 446–454. 9. Wilhelm K, Lin E. Unmet need in depression: varying perspectives on need. In Unmet need in psychiatry, Andrews G, Henderson S (eds). Cambridge University Press: Cambridge, 2000; 233–244. 10. Andrews G. The placebo response in depression: bane of research, boon to therapy. Br J Psychiatry 2001; 178: 192–194. 11. Kendler KS, Walters EE, Kessler RC. The prediction of length of major depressive episodes: results from an epidemiological sample of female twins. Psychol Med 1997; 27: 107–117. 12. McLeod JD, Kessler RC, Landis KR. Recovery from major depressive episodes in a community sample of married men and women. J Abnorm Psychol 1992; 101: 277–286. 13. Lee AS, Murray RM. The long term outcome of Maudsley depressives. Br J Psychiatry 1988; 153: 741–751. 14. Judd LL, Akiskal HS, Maser JD, Zeller PJ, Endicott J, Coryell W et al. A prospective 12 year study of subsyndromal and syndromal depressive symptoms in unipolar major depressive disorders. Arch Gen Psychiatry 1998; 55: 694–700. 15. Harris EC, Barraclough B. Excess mortality of mental disorder. Br J Psychiatry 1998; 173: 11–53. 16. Andrews G. Should depression be managed as a chronic disease? BMJ 2001; 322: 419–421. 17. Murray CJL, Kreuser J, Whang W. Cost-effectiveness analysis and policy choices: investing in health systems. In Global comparative assessments in the health sector: disease burden, expenditures and intervention packages, Murray CJL, Lopez AD (eds). World Health Organization: Geneva, 1994; 181–192. 18. Ad Hoc Committee on Health Research Relating to Future Intervention Options. Investing in health research and development. World Health Organization: Geneva, 1996. 19. National Health Committee (NZ). Guidelines for the treatment and management of depression by primary healthcare professionals. National Health Committee: Wellington, 1996. 20. Dadds MR, Spence SH, Holland DE, Barrett PM, Laurens KR. Prevention and early intervention for anxiety disorders: a controlled trial. J Consult Clin Psychol 1997; 65: 627–635. 21. Stouthard MEA, Essink-Bot M-L, Bonsel GJ, Barendregt JJ, Kramer PGN, van de Water HPA et al. Disability weights for diseases in the Netherlands. Erasmus University, Department of Public Health: Rotterdam, 1997. 22. Hollinghurst S, Bevan G, Bowie C. Estimating the ‘avoidable’ burden of disease by disability adjusted life years (DALYs). Health Care Man Sci 2000; 3: 9–21. 23. Cowley P, Wyatt RJ. Schizophrenia and manic–depressive illness. In Disease control priorities in developing countries, Jamison DT, Mosley WH, Measham AR, Bobadilla JL (eds). Oxford University Press: New York, 1993; 661–670. 24. Kirsh I, Sapirstein G. Listening to Prozac but hearing placebo: a meta-analysis of antidepressant medication. Prevention and Treatment 1998, URL:http://www.journals.apa.org/prevention [20 July 2000]. 25. The Quality Assurance Project. A treatment outline for depressive disorders. Aust N Z J Psychiatry 1983; 17: 129–148. 26. Jaffe R, Sokolov S, Streiner D. Antidepressant treatment of depression: a meta-analysis. Can J Psychiatry 1996; 41: 613–616. 27. Gloaguen V, Cottraux J, Cucherat M, Blackburn I. A meta-analysis of the effects of cognitive therapy in depressed patients. J Affect Disord 1998; 49: 59–72. 28. Gould RA, Clum GA. A meta-analysis of self-help treatment approaches. Clin Psychol Rev 1993; 13: 169–186. 29. Kessler RC, McGonagle KA, Zhao S, Nelson CB, Huges M, Eshleman S et al. Lifetime and 12-month prevalence of DSM-III-R psychiatric disorders in the United States: results from the National Comorbidity Survey. Arch Gen Psychiatry 51: 8–19. 30. Commonwealth Department of Health and Aged Care (Australia). Medicare Benefits Schedule. 1 November 1999 including 1 February 2000 and 1 May 2000 supplements. Commonwealth Department of Health and Aged Care: Canberra, 2000. URL:http://www. health.gov.au/pubs/mbs/mbs6/default.htm [20 July 2000]. 31. Commonwealth Department of Health and Aged Care (Australia). Schedule of pharmaceutical benefits for approved pharmacists and medical practitioners. Effective from 1 May 2000. Commonwealth
185 J. Mental Health Policy Econ. 3, 175–186 (2000)
32. 33. 34. 35. 36. 37. 38. 39.
Department of Health and Aged Care: Canberra, 2000. URL:http:// www.health.gov.au/pbs [20 July 2000]. Mental Health Branch, Commonwealth Department of Health and Aged Care. National mental health report. Australian Government Publishing Service: Canberra, 1997. Sturm R, Wells KB. How can care for depression become more costeffective? JAMA 1995; 273: 51–58. Kiloh LG, Andrews G, Neilson MD. The long-term outcome of depression. Br J Psychiatry 1988; 153: 752–757. Brodaty H, Andrews G. Brief psychotherapy in family practice: a controlled prospective intervention trial. Br J Psychiatry 1983; 143: 11–19. Calman KC. The ethics of allocation of scarce health care resources: a view from the centre. J Med Ethics 1994; 20: 71–74. Remer DS, Nieto AP. A compendium and comparison of 25 project evaluation techniques. Part II: ratio, payback and accounting methods. Int J Production Econ 1995; 42: 101–129. Hargreaves WA, Shumway M, Hu T-W, Cuffel B. Cost–outcome methods for mental health. Academic: San Diego, 1998. Kamlet MS, Kleinman L. Assessing the cost-utility of psychotherapy. In Cost-effectiveness of psychotherapy, Miller NE, Magruder KM (eds). Oxford University Press: New York, 1999; 99–108.
186 Copyright 2000 John Wiley & Sons, Ltd.
40. Wilkinson G, Williams B, Krekorian H, McLees S, Falloon I. QALYs in mental health: a case study. Psychol Med 1992; 22: 725–731. 41. Chisholm D, Healey A, Knapp M. QALYs and mental health care. Soc Psychiatry Psychiatr Epidemiol 1997; 32: 68–75. 42. Khan A, Warner HA, Brown WA. Symptom reduction and suicide risk in patients treated with placebo in antidepressant clinical trials. Arch Gen Psychiatry 2000; 57: 311–317. 43. Reijneveld SA. The cross-cultural validity of self-reported use of health care. A comparison of survey and registration data. J Clin Epidemiol 2000; 53: 267–272. 44. Orvaschel H, Lewinsohn PM, Seeley JR. Continuity of psychopathology in a community sample of adolescents. J Am Acad Child Adolesc Psychiatry 1995; 34: 1525–1535. 45. Lonnqvist J, Sintonen H, Syv¨alahti E, Appelberg B, Koskinen T, Mannikko T et al. Antidepressant efficacy and quality of life in depression: a double-blind study with moclobemide and fluoxetine. Acta Psychiatr Scand 1994; 89: 363–369. 46. Laupacis A, Feeny D, Detsky AS, Tugwell PX. How attractive does a new technology have to be to warrant adoption and utilization? Tentative guidelines for using clinical and economic evaluations. CMJA 1993; 148: 913–917.
G. ANDREWS ET AL. J. Mental Health Policy Econ. 3, 175–186 (2000)