digital ECG machines into a tablet, notebook or smart phone and then analyze it .... train on 9 folds and test on the remaining fold. The results .... 13.3. PSO-ACO. 0. 53.8. 60. 24. 55.6. 0. 26.7. 33.3. 42. 54. 0. 93.3. XCS. 23.1. 61.5. 8. 72. 66.7.
Using Evolutionary Algorithms for ECG Arrhythmia Detection and Classification Komal Waseem, Awais Javed, Rashad Ramzan and Muddassar Farooq Next Generation Intelligent Networks Research Center (nexGIN RC) National University of Computer & Emerging Sciences (FAST-NUCES) A.K. Brohi Road, H-11/4, Islamabad, Pakistan {i070179, i070307, rashad.ramzan, muddassar.farooq}@nu.edu.pk
Abstract—The electrocardiogram (ECG) is the most clinically accepted diagnostic tool used by physicians for interpreting the functional activity of the heart. The existing ECG machines require an expert-in-the-loop for identifying abnormalities in cardiac activity – commonly referred to as Arrhythmia – of a patient. The accuracy of diagnosis is directly dependent on the skill set of the physician; as a result, in rural and remote places, where no ECG specialist wants to relocate, the patients are unable to get any help in case of life threatening arrhythmias. In this paper, we investigate the suitability of evolutionary algorithms to discriminate a normal ECG from an abnormal one with minimum user intervention. Consequently, the human dependent errors are minimized. The intelligent framework is efficient and can be used for realtime ECG analysis to complement the diagnostic efficiency and accuracy of ECG specialists. Moreover, the system could also be used to raise early alarms for patients where no ECG specialist is available. In this paper, we aim at autonomously detecting six types of Arrhythmia: (1) Tachycardia, (2) Bradycardia, (3) Right Bundle Branch Block, (4) Left Bundle Branch Block, (5) Old Inferior Myocardial Infarction, and (6) Old Anterior Myocardial Infarction. We evaluate the accuracy of our system by selecting the best back end classifier from a set of 8 evolutionary classifiers. The results of our experiments show that our system is able to achieve more than 98% accuracy in detecting most types of Arrhythmia. Index Terms—arrhythmia; electrocardiogram; genetic; evolutionary.
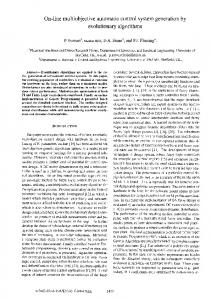
I. I NTRODUCTION The electrocardiogram, ECG or EKG, directly measures micro voltages in the heart muscle (myocardium) over a specific period of time. Figure 1 illustrates a typical ECG waveform [1]. It consists of three main segments: P-wave, QRS complex and T wave. The corresponding intervals and amplitudes have also been marked in the picture. A careful observation of the ECG waveform – focusing on identifying deviations in the expected times, shapes and voltages of the impulses in the cycles – provides a physician valuable diagnostic information. ECG is the most commonly used method for identifying abnormal heart activity (Arrhythmia). It is a well known problem that life threatening scenarios do emerge due to misdiagnosis on the basis of ECG. Moreover, in remote and rural areas of developing countries, ECG experts are not available and general physicians are not adequately trained to diagnose Arrhythmias on the basis of ECG. In secondary care hospitals, due to an immense load of patients, a physician spends significantly small time per patient; as a
Fig. 1.
A Typical ECG waveform [1]
result, proper diagnosis is difficult. Therefore, in this paper, we propose a Bio-inspired ECG analysis tool that has the capability to autonomously extract features from an ECG waveform and then apply evolutionary learning classifiers to detect most prevalent Arrhythmia types. The proposed solution can be used by taking input from digital ECG machines into a tablet, notebook or smart phone and then analyze it – using Bio-inspired classifiers – to detect Arrhythmia. (In new machines, the solution could be implemented with no additional hardware cost.) In this case, an alarm could be sent to emergency services by providing the location of the patient. Similarly, patients living in remote areas of developing countries could visit a basic health unit – equipped with ECG – and their ECG is analyzed by our system and then the suggested diagnosis can be sent to a tertiary care hospital for an expert opinion using e-health and telemedicine technology. As a consequence, a significant amount of patients’ load is reduced on tertiary care hospitals leading to better quality of health care. Last but not least, the tool has the ability to do ECG analysis in realtime. The important feature of the system is that it is able to work with unbalanced datasets, in which most patients are normal, without showing any learning bias towards the majority class problem. The other important requirement is that Arrhythmia patients must not be misclassified as normal (False negative) because this misdiagnosis could become fatal. The results of our experiments show that the system achieves more than 98%
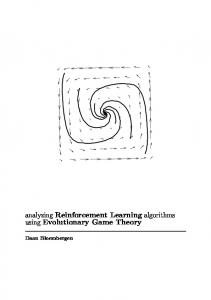
Fig. 2.
ECG Analysis Framework
accuracy in detecting well known Arrhythmia types. A. Related Work To the best of our knowledge, little research exists that investigates the feasibility of using Evolutionary classifiers for Arrhythmia detection. However, known methods for Arrhythmia detection mostly focus on differentiating between different Arrhythmia types. In [2], for instance, Support Vector Machine (SVM) has been used for primary classification but the features’ set is evolved through a genetic search. Similarly, the authors of [3] and [4] have done some work on Arrhythmia classification. In comparison, we propose a two level hierarchical classifier (for imbalanced ECG datasets) that removes bias in learning: (1) In Phase 1, we only discriminate between normal and abnormal ECG, and (2) in Phase 2, we detect six prevalent Arrhythmia types. During the second stage, dataset is squeezed to contain only ECG of Arrhythmia patients. This two step strategy has significantly improved the detection rate of our system compared with existing solutions. The rest of the paper is organized as follows. In Section II, we describe the architecture of our hierarchical classification system. In Section III, we discuss the results of our experiments by analyzing the performance metrics of proposed system with existing solutions. Finally, we conclude the paper with an outlook to our future work. II. S YSTEM A RCHITECTURE Figure 2 provides an overview of our ECG analysis framework. We have developed our framework in two phases. In order to test the validity of our approach, a real world dataset is important. For this purpose, we use a well known publicly available ECG dataset obtained from UCI repository [5]. The next important step is to do preprocessing of data, which is necessary for extracting knowledge from raw ECG data. In this step, it is important to visualize data and remove redundant features from dataset. Finally, we train a number of evolutionary learning classifiers to build normal and Arrhythmia models. As a consequence, we select the most suitable classifier that meets our requirements. In the classification module, we use a novel two phase hierarchical classification strategy: (1) In Phase 1, we select
a classifier that discriminates between normal and abnormal patients (we create a combined dataset of abnormal patients of all types of Arrhythmia), and (2) In Phase 2, we train the classifiers to build models of six types of Arrhythmia and then detect them on testing instances. The primary motivation is to identify rule based classifiers so that the cardiac physicians can be consulted on the diagnostic rules. After providing a brief overview of our system, we now discuss in detail the features extraction and preprocessing module.
Fig. 3.
Class Instances
A. Data Preprocessing The 12-Lead ECG is clinically accepted diagnostic tool used by cardiac physicians for ECG analysis. The ECG electrodes convert heart signals into an electrical signal ranging from 1 mV to 5 mV. In order to evaluate the efficacy of our Intelligent Arrhythmia detection tool, we use UCI Arrhythmia Dataset [5]. It consists of 16 classes, 279 attributes and 452 instances. We have eliminated the instances for Ventricular Premature Contraction, Supraventricular Premature Contraction, Left Ventricular Hypertrophy, Atrial Fibrillation. In Figure 3, we have summarized the Arrhythmia types that our tool is able to detect. 1) Feature Extraction & Visualization: As expected, Evolutionary classifiers take significantly large amount of time if we try to train them using entire features’ set consisting of 279 features. As a result, realtime ECG analysis is not possible. Therefore, CFSubsetEvaluation technique is used with Best First Search method, available in WEKA [6] software, to reduce the features’ set to a maximum of 31 features for Phase 1.
(a) Lead V1 - QRSA
(b) Lead V6 - R Wave Amplitude Fig. 4.
Features’ Distribution Plot
Moreover, a large feature set also confuses the learning of classifiers due to overlapping boundaries. In order to get a better insight into the overlapping features, we have visualized their distribution plots. For brevity, see Figures 4(a) and 4(b) that show distribution of the area of QRS complex of V1 (QRSA) and R Amplitude of V6 respectively. One can see that it is not easy to discriminate between Old Anterior Myocardial Infarction and RBBB Arrhythmia types because abovementioned two techniques for them belong to an overlapping region. In this way, we have removed the overlapping features that are likely to confuse classifiers. III. E XPERIMENTS AND R ESULTS A. Performance Metrics We have used KEEL [7] software – it provides realization of a number of Evolutionary learning classifiers – to select our hierarchical Arrhythmia classifier. We empirically identify the best configuration of each classifier that provides best accuracy. The ten-fold cross validation scheme has been used for testing in which we partition the dataset into 10 folds; train on 9 folds and test on the remaining fold. The results are based on three performance metrics: (1) detection rate, (2) false negative rate, and (3) computational time. We define detection rate as: DR =
TP (T P + F N )
(1)
In medicine, a false negative rate is significantly more critical compared with the case in which a normal patient is diagnosed as Arrhythmic (False Positive). It is defined as: FNR =
FN (F N + T P )
(2)
For the sake of comprehensiveness, the terms TNR and FAR1 are defined though they are less relevant in medicine. In Phase 1, we deal with a two class problem – normal and Arrhythmia (of all types) – and hence the terms used in Equation 1 and Equation 2 are defined as follows: 1 F AR
=
FP , (F P +T N )
and T N R =
TN (T N +F P )
True Positive (TP) is the number of Arrhythmia instances correctly classified as Arrhythmia instances. False Negative (FN) is the number of Arrhythmia instances that are incorrectly classified as normal. False Positive (FP) is the number of normal instances that are incorrectly classified as an Arrhythmia instance. True Negative (TN) is the number of normal instances that are correctly classified as normal. In Phase 2, we are dealing with a six class Arrhythmia problem that is sub-divided into 3 groups of two classes each; therefore, the above-mentioned terms are now redefined with respect to each type of Arrythmia. For example, if a Tachycardia instance is classified as any another type of Arrhythmia, it will contribute towards FP. Similarly, if any another type of Arrhythmia is classified as a Tachycardia instance, it would contribute towards FN. Similarly, we redefine the terms TP, TN, DR and FAR for Phase 2. Remember, the effectiveness of our classification solution depends on not only achieving a high detection rate but also on minimizing false negative rate (FNR). If the solution were to be used in real world, it is equally important that an Arrhythmia case is not classified as normal. A high false negative rate can severely compromise the diagnostic ability of a solution. Similarly, a low false alarm rate is preferred but a false alarm could be easily ruled out after a review by a cardiac physician. Last but not least, the system should give a decision in acceptable time and we define the decision time as the time taken during testing of instances. B. Results As mentioned before, our system works in two phases and hence we separately report the results for both phases. 1) Phase 1: In Table I, the results for Phase 1 are tabulated. One can see that the Pittsburgh style algorithm – GAssist-ADI – has provided the best detection rate. Moreover, it produces rules from the feature-set that are comprehensible and the rules can be easily implemented through if-else constructs. The high detection rate is due to its fitness function that evolves optimum rules using Minimum Description Length Principle. PSO-LDA achieves the second best detection rate with a significantly better true negative rate. This is significantly higher
compared with PSO-ACO and AntMiner that aim to determine a set of rules that predict the value of an attribute for a class. PSO-LDA on the other hand utilizes genetic PSO technique for feature selection and then performs classification based on the linear discriminant analysis. To conclude, PSO-LDA is not a rule based classifier and hence has little diagnostic value. Another interesting pattern is observed for GFS-AdaBoost. It provides 99.2% detection rate while true negative rate is just 2.4%; as a result, it has failed to learn “normal” ECG. Moreover, it is also not a rule based classifier. Due to these reasons, GAssist-ADI is the chosen classifier for Phase 1. TABLE I T EST R ESULTS FOR P HASE 1
Classifier GAssist-ADI PSO-LDA GFS-AdaBoost GANN SLAVE XCS UCS PSO-ACO AntMiner
DR 82.7 80.3 99.2 66.1 65.9 59.8 56.7 55.9 51.2
Test Results in % FNR FAR TNR 17.3 8.6 91.4 19.7 1.2 98.8 0.8 97.6 2.4 33.9 15.9 84.1 34.1 6.1 93.9 40.2 9.4 90.6 43.3 6.9 93.1 44.1 6.9 93.1 48.8 9 91
2) Phase 2: In this phase, the normal instances – classified in Phase 1 – are removed from the dataset; as a result, the learning bias due to the majority class is removed. The remaining instances of six Arrhythmia types are divided into 3 subgroups consisting of two Arrhythmia types each. The subgroups are: (a) Tachycardia and Bradycardia, (b) Left Bundle Branch Block and Old Inferior Myocardial Infarction, (c) Right Bundle Branch Block and Old Anterior Myocardial Infarction. In Phase 2, the diagnosis proceeds in three sub phases. In Phase 2(a), a patient is diagnosed for Tachycardia and Bradycardia. If these are ruled out, Left Bundle Branch Block or Old Inferior Myocardial Infarction are diagnosed in Phase 2(b). Finally, in Phase 2(c), Right Bundle Branch Block or Old Anterior Myocardial Infarction are diagnosed. Using this hierarchical strategy, the overlapping features that confuse the classifiers are removed. The results are tabulated in Table II. We see that GAssist-ADI achieves 100% accuracy for five Arrhythmia types. It has evolved individuals that represent the rule-set [8] using genetic operators like selection, crossover, mutation and replacement. It only misclassifies RBBB instances by 2%. By dividing our framework in two phases, we have effectively reduced the feature space and overlap between instances; as a result, accurate rules are created. In comparison, PSO-ACO has inferior detection rate especially for LBBB and Tachycardia. But PSO-LDA, achieves 100% detection rate for all Arrhythmia types. On the other hand, XCS has given 100% detection rate for four Arrhythmia types. It misclassifies Old Anterior MI by 6.7% and Bradycardia by 4%. The condition/action classifiers evolved in this case
TABLE V S AMPLES RULES G ENERATED B Y GASSIST-ADI If ((’Q-T interval’ >420.12) or (’V5 R wave width’ >51.5) or (’Heart Rate’


![[PDF] Strategies for ECG Arrhythmia Diagnosis - Google Sites](https://m.moam.info/img/260x300/pdf-strategies-for-ecg-arrhythmia-diagnosis-google_64781032097c474d228cbc6b.jpg)