Using extended phylogenetc profiles and support vector machines for protein family classification Kishore Narra and Li Liao* Department of Computer & Information Sciences University of Delaware, Newark, DE 19716, USA
Abstract We proposed a new approach to compare profiles when the correlations among attributes can be represented as a tree. To account for these correlations, the profile is extended with new bits corresponding to the internal nodes of the tree, which encode the correlations. An ad hoc scoring scheme is adopted for measuring the similarity among these extended profiles, and the scores thus obtained are then provided to a classifier -- a support vector machine using a polynomial kernel function -- for classification. The effectiveness of the proposed scoring scheme is assessed by the classifier’s improved accuracy. As an application the method is used to classify proteins into their functional families based on the phylogenetic profiles It is shown that the performance is much improved than using simple hamming distances and is also better than using a Bayesian based tree kernel.
1. Introduction Predicting protein functions remains a central task in computational biology. A vast number of computational tools [1,2,16] rely on sequence similarity to infer protein homology, which in turn leads to functional prediction: two homologous proteins evolved from a common ancestral protein are more likely to play the same functional role. Proteins that are remotely homologous to one another and therefore share less (below 30%) similarity pose as a major challenge to many functional prediction methods, which solely rely on sequence information for making prediction. To detect remote protein homologues, various techniques have been developed, for example, iterative search with refined
profiles [1], sophisticated probabilistic models, powerful statistical learning [10], and some hybrid approaches [7], to name a few. Some recent developments have attempted to utilize non-sequential information, either alone or in combination with sequence information, for protein functional prediction. For example, structural information was incorporated in profile hidden Markov models [5]. Some methods in comparative genomics went beyond homology for identifying proteins that are related to one another by participating in a common structural complex or metabolic pathways, or they are related because they fuse into a single gene in some genomes [3]. An important work on this line is the use of phylogenetic profiles for assigning gene functions based on evolutionary and/or co-evolutionary patterns across species [11, 12, 15]. The phylogenetic profile of a protein is represented as a vector, where each component corresponds to a specific genome and takes a value of either one or zero: with one (zero) indicating the presence (absence) of a significant homology of that protein in the corresponding genome. Similar hierarchical profiles have also been constructed from whole genome metabolic pathways, and utilized for comparing genomes based on their physiological characteristics and for clustering pathways [8, 18]. While the simplistic approach by just counting the number of matches and mismatches between two profiles, more often in binary format, already turned out to be revealing, such approach apparently misses the information that are embedded in the profile, namely the hierarchical structure, and because of the correlations implied by the hierarchical structure not all matches (mismatches) are equal in telling how two genes are related. In [8], a methodology was suggested for incorporating the hierarchical structure in comparing profiles. A Bayesian based approach was developed
recently in [17] to utilize the phylogenetic tree for constructing kernel function of support vector machines that are used for predicting functions of proteins based on their phylogenetic profiles. In this paper, we proposed a novel approach to extracting information embedded in hierarchical, specifically phylogenetic, profiles, and demonstrated that the extracted information, in concatenation with the original profiles, enabled more efficient learning for support vector machines, leading to a significant improvement for functional predictions of genes than just by using the plain phylogenetic profiles. The method also compares favorably to the Bayesian based tree kernel method in [17].
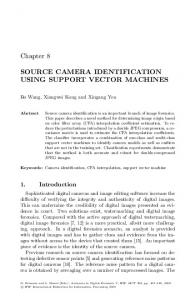
2. Methods 2.1. Tree encoded profiles The phylogenetic profile of a protein is represented as a vector, where each component corresponds to a specified genome and takes a value of either one or zero: with one (zero) indicating the presence (absence) of a significant homology of that protein in the corresponding genome. The similarity of these profiles can be used to detect protein homology; since proteins that tend to evolve in a coordinated way and thus have similar phylogenetic profiles. In this study, a group of 24 complete genomes is used to construct phylogenetic profiles for all proteins in Yeast [13]. The Hamming distance between a pair of phylogenetic profiles is perhaps the most straightforward way to measure the similarity. Yet, when correlation exists among the components in a vector, the Hamming distance becomes inadequate. For example, shown in Figure1 are a phylogenetic tree of five species and three derived profiles x = (0, 1, 1, 1, 1), y = (1, 1, 1, 1, 1), z = (1, 1, 1, 1, 0). The Hamming distance d(x, y) = -1+1+1+1+1 = 3, where the minus one is contributed from the mismatch between x and y at the first position. Similarly, the Hamming distance d(y, z) = 1+1+1+1-1 = 3. However, by biological intuition, one would suspect that y and z should be farther apart since they mismatch at the fifth position, which corresponds to an attribute directly descendent from the root and should be weighted more.
T
X = Y = Z =
0 1 1
1 1 1
1 1 1
1 1 1
1 1 0
Figure 1. A phylogenetic tree of five species and three phylogenetic profiles derived from this tree. In this work, we propose a novel method to compare hierarchical profiles, which addresses both knowledge representation and efficient learning. To capture the information encoded in the hierarchical structure (a phylogenetic tree in this case) of a profile, a two-step procedure is adopted: 1) a score is assigned at each internal tree node; 2) the score labeled tree is then flatten into an extended vector. For an internal tree node in a phylogenetic tree, as it is interpreted as ancestor of the nodes underneath it, one way to assign a score for it is to take the average of the scores from its children nodes. This scoring scheme works top-down recursively until the leaves are reached: the score at a leaf is just the value of the corresponding component in the hierarchical profile. The same scoring scheme was first suggested in [8] to compare two phylogenetic trees by the thus obtained scores at the root of each tree. Unlike [8], where only the score at the root node was used, naturally suffering from certain information loss, here we instead retain the scores at all internal nodes: mapping them into a vector via a post-order tree traversal and concatenating this vector with the original profile vector to form an extended vector, which we call tree-encoded profile. For example, there is a two-component vector , where a and b correspond to two genomes and have a parent node c. Our two-step procedure will first assign a score (a+b)/2 for node c., and then generate as extended vector as . The newly added component will help enhance the similarity among the two-component vectors where (a+b)/2 is equal. For example, , and are extended and become , and
respectively. Note that the values for the expanded components are real number in the range [0, 1].
[17], and is used to obtain tree-encoded profiles, which are 38 bit vectors, with the last 14 bits corresponding to the internal nodes.
2.2. Kernel function With the tree-encoded profiles as input, a support vector machine using a polynomial kernel is utilized to learn and test protein classification. The polynomial kernel is defined as
C. elegans A. pernix P. horikoshii P. abyssi A. fulgidus
K(a, b) = [1+ s D(a, b)]d
M. jannaschii M. thermoautotrophicu
where s and d are two parameters adjustable in the software package SVM Light used in this work [7]. Unlike ordinary polynomial kernels, D(a, b) is not the dot product of vectors a and b, but rather, a generalized Hamming distance for real value vectors:
E. coli H. influenzae H. pylori J99 H. pylori 26695 R. prowazekii M. genitalium M. pneumoniae B. subtilis M. tuberculosis B. burgdorferi T. pallidum C. pneumoniae C. trachomatis A. aeolicus T. maritime D. radiodurans Synechocystis
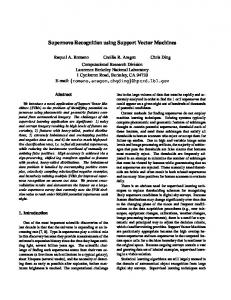
D(a, b) = Σi=1 to n (S(|ai-bi|) where the ad hoc function S has value 7 for a match , 5 for a mismatch by a difference less then 0.1, 3 for a mismatch by a difference less than 0.3, and 1 for a mismatch by a difference less than 0.5. To test our method, we compared it with two variations: 1) instead of encoding the tree, we simply extend the original profile by adding randomly assigned values, in the range of [0,1] into each extended bit; 2) with tree encoded profiles, but skip our ad hoc function S in the polynomial kernel. We also compared our method with a linear kernel and a tree kernel reported in [17]. 2.3. Data The data set used in this work is the same data set as in [14, 17]. Genes with accurate functional classifications were selected from the budding yeast Saccharomyces cerevisiae genome. To ensure adequate training and testing examples, only the functional classes that contain at least 10 genes were extracted from the several hundred classes in the Munich Information Center for Protein Sequences Comprehensive Yeast Genome Databases [13]. The resulting dataset contains 2465 genes in 133 classes. The binary profiles of these genes were built by BLAST search against each of the 24 genomes. Each bit in the profile for a gene was set to 0 or 1 if the E-value of the BLAST search for the gene against the corresponding organism was larger or smaller than 1 respectively. The phylogenetic tree of these 24 genomes is the same as in
Figure 2. The 24 genomes and a phylogenetic tree of these genomes. A 3-fold cross validation was adopted for the experiments. For each functional class, two third of its members are randomly selected as positive training examples, and the rest one third as positive testing examples. Genes not belonging in that class were randomly split into two thirds as negative training and one third as negative testing examples.
3. Results The results of the experiments are summarized in Figures 3 and 4. The function prediction for each
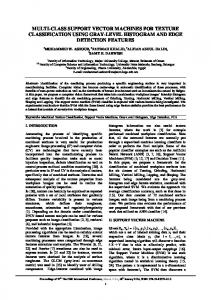
Figure 3. Histograms of ROC50 scores for various methods on 133 functional classes. TEAHP kernel refers to the method presented in this paper, and Linear kernel and Tree kernel refer to two methods reported in [17].
Figure 4. Histograms of ROC50 scores, where “rand14_teahp” refers to extending the phylogenetic profiles by 14 random bits. class is measured by its receiver operating characteristic (ROC) score. ROC score is the normalized area under a curve that plots the true positives as a function of false positives for varying classification thresholds [4]. ROC50 scores are ROC scores that are calculated by integrating the area up to the first 50 false positives. A curve in Figures 3 and 4 is a histogram of ROC50 scores averaged over 50 random runs for a function prediction method: it
shows the number of classes (Y-axis) that the specified method performs better than a given ROC50 score (Xaxis). Therefore, a higher curve indicates more accurate prediction performance. By this standard, our method using the tree-encoded profile and generalized polynomial kernel has the best performance among the various methods tested here. In particular, it is worth noting that our method outperformed the tree kernel method reported
in [17], not only with a slightly better prediction accuracy, but also significantly faster. The better performance of our method is believed to derive mainly from our better way of capturing and representing the correlations existed among bits of the original profile. To validate this, we had just randomly extended the original profile by 14 bits, and then trained on the same dataset using the generalized polynomial kernel SVM. The results were reported in Figure 4 and it is easy to notice that the histogram curve of ROC scores is much worse than our method’s.
4. Discussion A novel approach was proposed in this work for extracting information that is embedded in hierarchical, specifically phylogenetic, profiles. It was demonstrated that the extracted information, in concatenation with the original profiles, enabled more efficient learning for support vector machines, leading to a significant improvement for functional predictions of genes than just by using the plain phylogenetic profiles. Our method also performed slightly better than a tree kernel method that involved more sophisticated Bayesian analysis and probabilistic assumptions, which are ad hoc and sometimes causing some type of data unusable. For example, while it is intuitive to assign prior probabilities for ones and zeros in a binary profile when they are interpreted respectively as presence and absence of some events, it would be very difficult to do so for real value profiles, e.g., profiles that contain e-values directly from BLAST search. Our method, without resorting to assigning prior probabilities, can be readily applied to real value profiles. It is worth noting that although our method has an ad hoc Hamming distance incorporated in the polynomial kernel, this ad hoc function does not preclude us from using real value profiles, and only affect the performance of our method in the experiments slightly. Our method can be further refined by introducing weights in calculating the average score for an internal tree node. The weights can take into account the frequency of matches and mismatches occurring in different tree branches. Details will be addressed in future work elsewhere.
References [1] S. Altschul, W. Gish, W. Miller, E. Myers, and D. Lipman, “Basic local alignment search tool”, Journal of Molecular Biology, vol. 215, pp. 403-410, 1990.
[2] S. Altschul, T. Madden, A. Schaffer, J. Zhang, Z. Zhang, W. Miller, and D. Lipman, “Gapped blast and psi-blast: A new generation of protein database search programs”, Nucleic Acids Research vol. 25, pp. 3389-3420, 1997. [3] A.J. Enright, I. IIiopoulos, N.C. Kyrpides, and C.A. Ouzounis, “Protein interaction maps for complete genome based on gene fusion events”, Nature, vol. 403, pp. 86-90, 1999. [4] M. Gribskov, and N. Robinson, “Use of receiver operating characteristic analysis to evaluate sequence matching”, Computers and Chemistry, vol. 10, pp. 25-33, 1996. [5] S. Griffiths-Jones, and A. Bateman, “The use of structure information to increase alignment accuracy does not aid homologue detection with profile HMMs”, Bioinformatics, vol. 18, pp. 1243-1249, 2002. [6] T. Jaakola, M. Diekhans, and D. Haussler, “Using the Fisher kernel method to detect remote protein homologies”, Proceedings of the Seventh International Conference on Intelligent Systems for Molecular Biology. 1999, pp. 95-114. [7] T. Joachims, “Making large-scale svm learning practical”, Advances in kernel Methods – Support Vector Learning, Scholkopf, B., Burges, C., and Smola A. (eds), MIT Press, 1999. pp. 169-184. [8] L. Liao, S. Kim, and J.F. Tomb, “Genome Comparisons Based on Profiles of Metabolic Pathways”, The Proceedings of The Sixth International Conference on Knowledge-Based Intelligent Information & Engineering Systems (KES2002), , September 2002, Crema, Italy, pp. 469-476. [9] L. Liao, and W.S. Noble, “Combining pairwise sequence similarity and support vector machines for remote protein homology detection”, The Proceedings of The Sixth International Conference on Research in Computational Molecular Biology (RECOMB 2002), April 2002, pp225-232. [10] L. Liao, and W.S. Noble, “Combining pairwise sequence similarity and support vector machines for detecting remote protein evolutionary and structural relationships”, The Journal of Computational Biology, , vol. 10, pp. 857- 868, 2003. [11] D. A. Liberles, A. Thoren, G. vonHeijne, and A. Elofsson, “The use of phylogenetic profiles for gene predictions”, Current Genomics, vol. 3, pp. 131-137, 2002 [12] Marcotte, E.M., Pellegrini, M., Thompson, M.J., Yeates, T.O. and Eisenberg, D. “A combined algorithm for genomewide prediction of protein function”, Nature, vol. 402, pp. 83-86, 1999.
[13] H.W. Mewes, D. Frishman, U. Güldener, G. Mannhaupt, K. Mayer, M. Mokrejs, B. Morgenstern, M. Münsterkoetter, S. Rudd, and B. Weil, “MIPS: a database for genomes and protein sequences”, Nucleic Acids Research, vol. 30, pp. 31-34, 2002. [14] P. Pavlidis, J. Weston, J. Cai, and W.N. Grundy, “ Gene functional classification from heterogeneous data”, Proceedings of the Fifth International Conference on Computational Biology. pp. 249-255. [15] M. Pellegrini, E.M. Marcotte, M.J. Thompson, D. Eisenberg, and T.O. Yeates, “Assigning protein functions by comparative genome analysis: Protein phylogenetic profiles”, Proc. Natl. Acad. Sci. USA, vol. 96, pp. 4285-4288, 1999.
*
To whom the correspondence shall be addressed. E-mail:
[email protected].
[16] T.F. Smith, and W.S. Waterman, “Identification of common molecular subsequences”, Journal of Molecular Biology, vol. 147, pp. 195-197, 1981. [17] J.P. Vert, “A tree kernel to analyze phylogenetic profiles”, Bioinformatics, vol. 18 pp. S276-S284, 2002. [18] S. Zhang, L. Liao, J.F Tomb, and J.T.L. Wang, “Clustering and classifying enzymes in metabolic pathways: some preliminary results”, ACM SIGKDD Workshop on Data Mining in Bioinformatics (BioKDD2002), 2002, pp19-24.