108
IEEE GEOSCIENCE AND REMOTE SENSING LETTERS, VOL. 2, NO. 2, APRIL 2005
Using FCMC, FVS, and PCA Techniques for Feature Extraction of Multispectral Images Zhan-Li Sun, De-Shuang Huang, Senior Member, IEEE, Yiu-Ming Cheung, Member, IEEE, Jiming Liu, Senior Member, IEEE, and Guang-Bin Huang, Senior Member, IEEE
Abstract—In this letter, a new nonlinear approach based on a combination of the fuzzy -means clustering (FCMC), feature vector selection and principal component analysis (PCA) is proposed to extract features of multispectral images when a very large number of samples need to be processed. The main contribution of this letter is to provide a preprocessing method for classifying these images with higher accuracy compared to the single PCA and kernel PCA. Finally, some experimental results demonstrate that our proposed approach is effective and efficient in analyzing multispectral images. Index Terms—Feature extraction, feature vector selection (FVS), fuzzy -means clustering (FCMC), multispectral image, principal component analysis (PCA).
I. INTRODUCTION
T
HERE usually exist three data representation methods such as image space, spectral space, and feature space for multispectral data. Among them, the feature space method is a powerful tool for representing a set of data [1], [2]. In general, in an original feature space, each feature vector is formed by collecting the corresponding pixel value from the same position of each band image. Classification is often considered a very important task for multispectral images analysis. Under the same conditions, the criterion of selecting a good and efficient feature extraction method is generally able to guarantee that the classification accuracy can be improved greatly. For instance, in [3], the principal component analysis (PCA) method was used to extract linear principal components (PCs) for multispectral images. As a result, the classification accuracy based on the PC images can be improved significantly compared to the one directly based on the original multispectral data. In recent years, support vector machines (SVMs) have been proven to be another very efficient method in many applications of nonlinear classification and function estimation. Recently, the works on SVMs have also been stimulating the research on kernel-based learning methods, i.e., generalizing those existing Manuscript received July 8, 2004; revised December 22, 2004. This work was supported by the National Science Foundation of China under Grants 60472111 and 60405002. Z.-L. Sun is with the Intelligent Computing Laboratory, Hefei Institute of Intelligent Machines, Chinese Academy of Sciences, Anhui 230031, China, and is also with the Department of Automatization, University of Science and Technology of China, Anhui 230026, China (e-mail:
[email protected]). D.-S. Huang is with the Hefei Institute of Intelligent Machines, Chinese Academy of Sciences, Anhui 230031, China (e-mail:
[email protected]). Y.-M. Cheung and J. Liu are with the Department of Computer Science, Hong Kong Baptist University, Hong Kong. G.-B. Huang is with the School of Electrical and Electronic Engineering, Nanyang Technological University, Singapore. Digital Object Identifier 10.1109/LGRS.2005.844169
linear techniques such as the PCA, Fisher linear discriminant (FLD) [4], [5], etc., to nonlinear versions by applying the kernel trick. Moreover, one important result in this research is the extension of the PCA to a kernel PCA (KPCA) [6]–[10], which has been shown to be an efficient approach for extracting the new features by using a kernel trick to project data into a higher dimensional (even infinite dimensional) feature space. Since the new feature space is nonlinearly related to the input space, here the new features extracted are called as the features in the nonlinear space. In the previous research work done by Schölkopf et al. [6], [7], the KPCA was applied to extract the features in the nonlinear space for recognition of handwritten digits that were chosen from the U.S. Postal Service (USPS) database of handwritten digits collected from mail envelopes in Buffalo, NY; then, a linear SVM was used to classify the features extracted in the nonlinear space. The experimental results demonstrated that nonlinear principal components afford better correct recognition rates than the linear principal components. Therefore, in order to get the better classification results, we are also keen to adopt the feature extraction method similar to the KPCA to preprocess multispectral images. However, the KPCA and those nonlinear algorithms inspired by SVMs need to use matrices with as large as the size of all the training samples, even at the initial phase, and this will lead to complex and memory-consuming solutions. Specifically, under a given condition, it is infeasible for the single KPCA [7] and its improved algorithms [11] to directly process all observations of multispectral images due to the limitation of computer memory size when a very large number of observations are included in these images (in fact, this point can be verified by running the MATLAB codes provided by the corresponding authors in [7] and [11] on a personal computer). On the other hand, however, for multispectral images, only selecting a small number of samples randomly from all observations as input samples of the KPCA will not yield good results either. In this letter, a new approach based on a combination of the fuzzy -means clustering (FCMC), feature vector selection (FVS) [12], and PCA is proposed to extract the features for multispectral images. FVS can be used to select feature vectors (FVs) and further generate a new feature space formed by projecting the data onto the subspace spanned by the selected FVs. Consequently, in this new feature space, the PCA can be carried out directly to extract the features with these projected data, and the kernel function is no longer required, so that compared to the KPCA, the computational process of the proposed method is significantly accelerated during the initial stage (refer to [12]
1545-598X/$20.00 © 2005 IEEE
SUN et al.: USING FCMC, FVS, AND PCA TECHNIQUES FOR FEATURE EXTRACTION
for details). In addition, the clustering analysis can usually help provide some input samples for the FVS that can better represent the clusters so that computing and storing big matrix can be avoided during the initial phase. Since most of the pixels included in multispectral images are usually formed by the mixed signals of different targets on the ground, and since the discriminative boundaries for different targets are fuzzy, compared to those hard clustering methods the FCMC method is more suitable for these kind of practical applications. So, in this letter, the FCMC method is used before FVS and PCA. The experimental results showed that our proposed method is superior to KPCA. Furthermore, the major advantage of our method is that it can be used to extract the features in the nonlinear space even if a large number of observations are considered. Moreover, it should be noted that the main idea for our proposed method could also be used to extend those existing linear algorithms to nonlinear versions and attain better performance. For instance, for the Fisher linear discriminate (FLD) method, we can obtain its nonlinear version with better performance by combining the FCMC and the FVS with the FLD. The remainder of this letter is organized as follows. Our proposed method for extracting the features of multispectral images based on a combination of FCMC, FVS, and PCA is introduced in Section II. Experimental results and discussions are presented in Section III. Finally, Section IV concludes this letter with some conclusive remarks. II. MAIN RESULTS A. Background The problem background is first briefed in this subsection. in the original Assume that an observation data matrix multispectral images , sample space is obtained from , where each column of , , is usually referred to as an observation. The objective for extracting the features of multispectral images is how to transform the original sample space into a new feature space (also referred to as nonlinear space) and then extract the features in this nonlinear space for classification. B. Fuzzy
109
w.r.f. and Therefore, we can calculate the gradients of , respectively, from (1) and (2), and let these gradients be and can equal to zero; then, the exact expressions of be obtained as follows: (3)
(4) In practical implementation, the solutions of and can be achieved through an iterative method. Note that the number of clusters is determined in advance according to the a priori knowledge about multispectral data. In this letter, the FCMC is used twice, which can be respectively introduced as follows: 1) Selecting the input samples for the FVS using the FCMC: The criterion for the FCMC to select the input samples for the FVS is that generally for each cluster the input samples with higher fitness values are selected. Assume that the number of the total selected input samples is , and the percentage of the sample number for the th cluster ; then, the over the total observation sample number is number of the input samples chosen from the th cluster . is defined as 2) Clustering the PC images by the FCMC to evaluate the performance of the features extracted in the nonlinear space: In this case, the clustering objective function value is often selected as a criterion to evaluate the performance of the features extracted in the nonlinear space. C. Searching for Feature Vectors for Multispectral Images Using the FVS Technique Assume that a set of samples are chosen by the method described in the above subsection. Considering a mapping function transforming the observations of into a Hilbert feature space ; then, in this space, the dot product of and can be defined as
-Means Clustering for Multispectral Images
The FCMC technique for multispectral images analysis can be the fitness function of be described as follows. Let the the th observation to the th cluster, and center of every cluster, where is the number of clusters chosen that beforehand. Further, let denote the exponent of can be used to control clustering results. Thus, the clustering objective function for the FCMC can be defined as follows: (1)
(5) where and are the sample vectors, and is a kernel function. Generally, a radial basis function can be used as kernel function, where denotes the shape parameter. Assume that there is a set of observations within , where , the goal for the FVS, is to find the set that maximize the global fitness
Furthermore, the FCMC can be performed by minimizing under the constraint
(6)
(2)
where the local fitness transposition operator,
, ,
,
denotes ,
110
IEEE GEOSCIENCE AND REMOTE SENSING LETTERS, VOL. 2, NO. 2, APRIL 2005
, , . In addition, the set is chosen by a sequential forward approach , we look for the sample that (i.e., at the first iteration gives the maximum global fitness ), and at the same time, the one having the lowest local fitness is selected as the new feature vector. Then, we again compute the global fitness and local fitness and select next feature vector from the remaining samples in . As a result, there are totally feature vectors selected from in order. In general, once is found, then the sample vectors form a set of bases in feature space , which constitutes a subspace . Further, a new feature space is attained through projecting all samples in onto this subspace
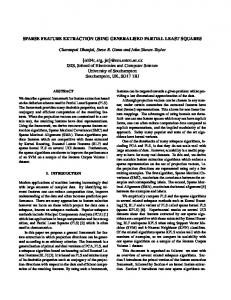
Fig. 1.
Six original multispectral images.
Fig. 2.
PC images extracted by the single PCA.
(7) where is an observation in , is the corresponding observation in the new feature space , and is a transposition operator. Then, the PCA can be directly performed in the new feature space. Since the PCA is a well-known method, it is unnecessary for us to give more details for this technique. For real multispectral images, since we do not have much a priori knowledge about the data, in order to adjust the parameters when conducting the above steps or comparing it with the PCA, here the FCMC based on an unsupervised clustering analysis is carried out again after the PCA. According to the above analyses, the steps of extracting the features in the nonlinear space for multispectral images by our method can be summarized as follows. Step 1) Given the number of clustering centers and the parameter , select input samples after clustering. Step 2) Given the number of feature vectors and initiated global fitness , choose the radial basis function as kernel function; then, search for the FVs by the FVS. Furthermore, project original data onto the subspace . Step 3) Perform the PCA in the new feature space. Step 4) Evaluate the PC images by the objective values of the FCMC. As done in this letter, the parameters , , and can be chosen by adjusting continually for several times. III. EXPERIMENTAL RESULTS AND DISCUSSIONS In this section, we shall present the experimental results of our proposed method on six-band Landsat images over the Tel-Aviv city area provided by George Washington University, as depicted in Fig. 1. From Fig. 1, it can be seen that there are mainly four typical areas, i.e., sea, city, forest, and desert areas. Note that each image contains 192 192 pixels. Thus, the size of observation data matrix obtained from these images is 6 192 192, i.e., , . All simulations were conducted in MATLAB environment running on an ordinary personal computer with single 1.7-GHZ CPU and 256-MB memory. In order to easily compare our proposed method with later experimental results, we adopt the single PCA to analyze the
TABLE I OBJECTIVE FUNCTION VALUES BASED ON THE CLUSTERING ANALYSIS FOR THE PC IMAGES OBTAINED AFTER THE SINGLE PCA
multispectral images. Thus, six extracted principal component images are obtained and shown in Fig. 2. The objective function values based on the clustering analysis for the PC images obtained after the single PCA are given in Table I, where is the number of the first PC images used for the objective function value. clustering, and In addition, here we also use the KPCA [6], [7] to extract the features in the nonlinear space. In experiments, the training samples are selected discontinuously from all observations in , i.e., the samples are to be selected by every a fixed number of observations, the performance of which is proved to be better than that obtained when all the samples are chosen continuously. Here, the numbers of the training samples, denoted by , are chosen to be 10, 20, 50, 100, and 150, respectively. Moreover, a radial basis function is selected as the kernel function, and the corresponding shape parameter is chosen by repeating the experiments for five times so that the best result can be obtained. (Note that the best experimental result can be reached .) when The experimental results obtained by our proposed method are given as follows. For the FCMC method, assume that the number of clusters is determined to be 4 in advance according to the a priori knowledge. In experiments, the numbers of the training samples, denoted by , are assumed to be 10, 20, 50,
SUN et al.: USING FCMC, FVS, AND PCA TECHNIQUES FOR FEATURE EXTRACTION
111
TABLE II PARAMETERS CHOSEN FOR OUR PROPOSED METHOD
Fig. 4.
CPU time consumed by the KPCA and our method.
Fig. 3. Objective function values of the FCMC based on the PC images obtained after the KPCA and our method, where rk and rp denote the numbers of training samples selected for the KPCA and our method, respectively.
100, and 150, respectively. After adjusted several times, the final parameters chosen are given in Table II. Since determines the maximum number of PC images that can be extracted finally, in order to compare it with the results obtained by the single PCA, should be chosen greater than six. At the same time, it was found in our experiments that it may be unnecessary to have many PC images for multispectral images classification. So we selected the parameter as 9. As a result, the objective function values of the FCMC for the PC images respectively obtained by the KPCA and our method are given in Fig. 3. In this figure, the vertical coordinate denotes the objective function values and the horizontal coordinate the number of first PC images used for clustering analysis. It should be pointed out that the experiments were repeated five times for the case of different sample numbers in order to eliminate the effects brought by randomly initialized clustering centers for the FCMC; then, the final objective function values of clustering is the average value. In addition, for the same sample number, it was found that the variation of the objective function values between any two results is less than 0.001 for the KPCA or our method. Therefore, the randomly initialized clustering centers for the FCMC cause little effects to the objective function value when the number of clusters is determined in advance according to the a priori knowledge. So, the objective function value obtained by the FCMC based on the PC images is a good criterion to evaluate the features extracted in the nonlinear space. As observed from Table I and Fig. 3, the classification accuracy for the PC images obtained by the KPCA is better than that obtained by the single PCA. Moreover, it can also be seen that the results obtained by our method are the best among all three methods. In addition, seen from Fig. 3, the classification performance of our proposed method is more stable than that of the
Fig. 5. Six PC images obtained by our method, where the number of the training samples is 150.
KPCA when the number of samples is changed. The CPU times consumed by the KPCA and by our method, respectively, are shown in Fig. 4. From Fig. 4, it can be found that both methods requires very short training time when the number of the training samples is less than 50. However, when the number of the training samples is more than 50, unlike our proposed method the CPU time consumed for the KPCA increases dramatically. So, it can be inferred that our proposed approach is a time-saving method. Seen from Fig. 3, the result is best when the number of the training samples is chosen as 150. Correspondingly, the six PC images obtained are depicted in Fig. 5. IV. CONCLUSION In this letter, we proposed a nonlinear approach based on a combination of three key methods (i.e., the fuzzy -means clustering, feature vector selection, and principal component analysis) to extract the features in the nonlinear space for classifying multispectral images. Also, a good strategy was given for selecting the input samples for the FVS so that the samples chosen can better represent the cluster that they belong to. The experimental results demonstrated that our proposed method could not only improve the classification accuracy greatly but also significantly reduce the computational time compared to the single
112
IEEE GEOSCIENCE AND REMOTE SENSING LETTERS, VOL. 2, NO. 2, APRIL 2005
KPCA when a large number of samples are considered. It is worth further investigating how to segment those spectral images processed as well as how to classify the targets contained within the images by means of known spectral signatures in our future research. ACKNOWLEDGMENT The authors gratefully acknowledge many thanks to G. Baudat and F. Anouar for providing the FVS program codes. Furthermore, the authors express most sincere thanks to the Editor-in-Chief and anonymous reviewers who have given us many helpful comments. Finally, thanks to B.Y. Sun for valuable discussions and suggestions. REFERENCES [1] D. Landgrebe. (1997) On information extraction principles for hyperspectral data. [Online]. Available: http://dynamo.ecn.purdue.edu/~landgreb/whitepaper.pdf. , (1998) Multispectral data analysis: A signal theory perspective. [2] [Online]. Available: http://dynamo.ecn.purdue.edu/~biehl/MultiSpec/Signal_Theory.pdf.
[3] S. Chitroub, A. Houacine, and B. Sansal, “Principal component analysis of multispectral images using neural network,” in Proc. 1st ACS/IEEE Inte. Conf. Computer Systems and Applications, 2001, pp. 89–95. [4] D. S. Huang, Systematic Theory of Neural Networks for Pattern Recognition. Beijing: Publishing House of Electronic Industry of China, 1996. , Intelligent Signal Processing Technique for High Resolution [5] Radars. Beijing: Publishing House of Machine Industry of China, 2001. [6] B. Schölkopf, A. Smola, and K.-R. Müller, “Nonlinear component analysis as a kernel eigenvalue,” Neural Comput., vol. 10, no. 5, pp. 1299–1319, 1998. , “Kernel principal component analysis,” in Advances in Kernel [7] Methods-Support Vector Learning. Cambridge, MA: MIT Press, 1999, pp. 327–352. [8] B. Schölkopf, S. Mika, C. J. C. Burges, P. Knirsch, K.-R. Müller, and A. J. Smola, “Input space vs. feature space in kernel-based methods,” IEEE Trans. Neural Netw., vol. 10, no. 5, pp. 1000–1017, Sep. 1999. [9] K.-R. Müller, S. Mika, G. Rätsch, K. Tsuda, and B. Schölkopf, “An introduction to kernel-based learning algorithms,” IEEE Trans. Neural Netw., vol. 12, no. 2, pp. 181–201, Mar. 2001. [10] L. J. Cao, K. S. Chua, W. K. Chong, H. P. Lee, and Q. M. Gu, “A comparison of PCA, KPCA and ICA for dimensionality reduction in support vector machine,” Neurocomputing, no. 55, pp. 321–336, 2003. [11] K. I. Kim, M. O. Franz, and B. Schölkopf. (2004) Iterative kernel principal component analysis for image modeling. Max Planck Inst. Biol. Kybernetik, Tübingen, Germany. [Online]. Available: http://www.kyb.mpg.de/publications/pdfs/pdf2453.pdf. [12] G. Baudat and F. Anouar, “Feature vector selection and projection using kernels,” Neurocomputing, no. 5, pp. 20–38, 2003.