Using FlowLab, An Educational Computational Fluid Dynamics Tool, To Perform A Comparative Study Of Turbulence Models A. Parihar and A. Kulkarni 1, F. Stern and T. Xing 2, S. Moeykens 3 1
Fluent India Pvt. Ltd. Pune, India
2
University of Iowa, Mechanical Engineering Department Iowa City, Iowa, USA 3
Fluent Inc. Lebanon, New Hampshire, USA Email:
[email protected]
ABSTRACT Flow over an Ahmed body is a key benchmark case for validating the complex turbulent flow field around vehicles. In spite of the simple geometry, the flow field around an Ahmed body retains critical features of real, external vehicular flow. The present study is an attempt to implement such a real life example into the course curriculum for undergraduate engineers. FlowLab, which is a Computational Fluid Dynamics (CFD) tool developed by Fluent Inc. for use in engineering education, allows students to conduct interactive application studies. This paper presents a synopsis of FlowLab, a description of one FlowLab exercise, and an overview of the educational experience gained by students through using FlowLab, which is understood through student surveys and examinations. FlowLab-based CFD exercises were implemented into 57:020 Mechanics of Fluids and Transport Processes and 58:160 Intermediate Mechanics of Fluids courses at the University of Iowa in the fall of 2004, although this report focuses only on experiences with the Ahmed body exercise, which was used only in the intermediate-level fluids class, 58:160. This exercise was developed under National Science Foundation funding by the authors of this paper. The focus of this study does not include validating the various turbulence models used for the Ahmed body simulation, because a two-dimensional simplification was applied. With the two-dimensional simplification, students may setup, run, and postprocess this model in a 50 minute class period using a single-CPU PC, as required for the 58:160 class at
the University of Iowa. It is educational for students to understand the implication of a two-dimensional approximation for essentially a three-dimensional flow field, along with the consequent variation in both qualitative and quantitative results. Additionally, through this exercise, students may realize that the choice of the respective turbulence model will affect simulation prediction.
1
INTRODUCTION
Study of the flow over car geometries can be performed by experiments in wind tunnels, as well as by numerical simulation. Ahmed [1] studied the wake structure and drag of the Ahmed body. Visualization techniques were employed to examine the structure of the wake and time-averaged velocity measurements were made on the centerline plane and at transverse planes in the wake. Ahmed showed that almost 85% of body drag is pressure drag and most of this drag is generated at the rear end. Lienhart et al. [2] conducted the experiments for two rear slant angles (25º and 35º). The various parameters such as velocities and turbulent kinetic energy were measured at different streamwise locations. Lienhart found that the critical angle (of rear slant edge) is 30º, above which there is sudden drop in the drag coefficient as the flow fully separates over the rear slant. During the recent past, significant progress in the field of computational fluid dynamics (CFD) has also been made, and CFD is gradually becoming established as an efficient tool in vehicle design. It is recognized that complex flow fields are not easily
represented in terms of a closed solution. CFD technology allows for the visualization of complex flow phenomena in a virtual environment that can significantly enhance the learning experience. It has the potential to explore cause-effect relationships through open-ended analyses, and extends analyses beyond what is possible using traditional experimentation, because the end user can easily visualize complex flow phenomena using color contour plots and velocity vector plots. Additional features available to compute many derived parameters along with user-friendly graphical operations allow highlighting the region of interest for detailed analyses. Under sponsorship from National Science Foundation (NSF) Project 0126589, Collaborative Research: Integration of Simulation Technology into Undergraduate Engineering Courses and Laboratories, in the fall of 2004, FlowLab-based CFD exercises were implemented into 58:160 [3], an Intermediate Mechanics of Fluids course at the University of Iowa. This report focuses only on experiences with the Ahmed body exercise, which was used in the intermediate-level fluids course. The present study attempts to introduce complex flows to undergraduate and first year graduate level curriculum.
1.1
FlowLab
FlowLab is a virtual laboratory that facilitates the running of predefined fluid mechanics problems
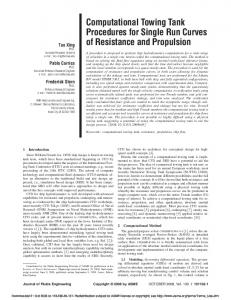
under a single interface. FlowLab is not a generalized CFD package. This software directs the learning of fluid mechanics through an interface which is structured to control the process in which a problem is set up, converged, and post-processed. FlowLab has been integrated into the pre- and post-processor GAMBIT, and relies upon the general solver FLUENT for numerical solution. Geometric dimensions, material properties of the fluid, and boundary conditions can be varied by the user. Relevant reports, X-Y plots, contour plots, and velocity vectors can be displayed after the solution is converged. FlowLab uses a PDF reader for viewing documentation and a plot utility for generating X-Y plots. The primary advantage of using FlowLab in the classroom is that it is interactive. For each CFD exercise, students run the CFD solution from start to finish - generate the geometry, choose parameters and/or physical models, generate the grid, carry out the iterations, and post-process. While this approach is more challenging than simply post-processing previously run CFD solutions, FlowLab allows for CFD exercises to be set up such that the steps are easy to follow. There are not pages of instructions or directions to read. Each problem contains one or more variables that the student adjusts with each run. In this sense, the CFD exercise becomes analogous to a physical experiment - students collect data after each run, plot and identify trends in the data, and learn something about both CFD and fluid mechanics
Figure 1. FlowLab Interface
in the process. The user-friendly interface of FlowLab is shown in Figure 1. With focus on the features of FlowLab, this report presents a comparative study of turbulence models for flow over a two-dimensional Ahmed body.
2
GOVERNING EQUATIONS
The Reynolds Averaged Navier-Stokes (RANS) equations solved by FlowLab are presented in Equations 1 and 2. The RANS approach of permitting a solution for the mean flow variables greatly reduces the computational effort. If the mean flow is steady, the governing equations will not contain time derivatives and a steady-state solution can be obtained economically.
ui 0 t xi
……(1)
ui ui u j p A B t x j xi
……(2)
u u j 2 ij u l i 3 xl x j xi A x j
B
u 'iu ' j x j
A computational advantage is available even in transient situations, since the time step will be determined by the global unsteadiness in the mean flow rather than by turbulent fluctuations. The Reynolds-averaged approach to turbulence modeling requires that the Reynolds stresses in Equation 2 are appropriately modeled. A common method employs the Boussinesq hypothesis [4] to relate the Reynolds stresses to the mean velocity gradients:
u u j u 'i u ' j t i x j xi where,
C
u 2 k t i ij 3 xi
C
2.1
……(3)
The Standard k- ε Model
The simplest “complete models’’ of turbulence are two-equation models in which the solution of two separate transport equations allows the turbulent velocity and length scales to be independently determined. The standard k-ε model in FLUENT falls within this class of turbulence models and has become the workhorse of practical engineering flow calculations since the time it was proposed by Launder and Spalding [5]. Robustness, economy, and reasonable accuracy for a wide range of turbulent flows explain its popularity in industrial flow and heat transfer simulations. It is a semi-empirical model, and the derivation of the model equations relies on phenomenological considerations and empiricism.
2.2
where,
and
This approach is generally adopted for all practical engineering calculations, and is used with turbulence models such as k-ε and its variants, k-and its variants, and the RSM.
The Standard k-Model
The standard k-model in FLUENT is based on the Wilcox k-model [6], which incorporates modifications for low Reynolds number effects, compressibility, and shear flow spreading. The Wilcox model predicts free shear flow spreading rates that are in close agreement with measurements for far wakes, mixing layers, and plane, round, and radial jets, and is thus applicable to wall-bounded flows and free shear flows. A variation of the standard k-model, known as the Shear Stress Transport (SST) k-model, is also available. The SST model behaves like k- in the near wall region and like k-ε in the free stream of the flow domain, providing a favorable blend.
2.3
The Reynolds Stress Model (RSM)
The Reynolds stress model (RSM) is a more elaborate RANS based turbulence model than either the k- or k- models. Abandoning the isotropic eddy-viscosity hypothesis, the RSM closes the Reynolds-averaged Navier-Stokes equations by solving transport equations for the Reynolds stresses together with an equation for the dissipation rate. This means that five additional transport equations are required in two-dimensional flows, and seven additional transport equations must be solved in three dimensions. Since the RSM accounts for the effects of streamline curvature, swirl, rotation, and rapid changes in strain
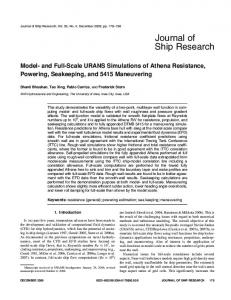
Figure 2. Schematic of Flow Domain rate in a more rigorous manner than any other model, it has greater potential to provide accurate predictions for complex flows. The modeling of the pressurestrain and dissipation-rate terms is particularly challenging, and sometimes considered to be responsible for compromising the accuracy of RSM predictions.
2.4
The v2 -f Model
The v2-f model [7] is similar to the standard k-ε model, but incorporates near–wall turbulence anisotropy and non-local pressure-strain effects. The v2-f model is a general low Reynolds number turbulence model that is valid even in close proximity to the wall, and therefore does not need to make use of wall functions. The model is capable of simulating flow fields dominated by separation. The distinguishing feature of the v2-f model is it’s use of the velocity scale, energy, k.
3
v2
, instead of turbulent kinetic
MODELING APPROACH
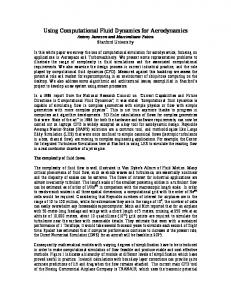
The schematic of the computational domain is shown in Figure 2. The parameters like L, h and GL are fixed, and upstream length (UL), downstream length (DL), domain height (DH) and slant angle ( ) can be varied through the FlowLab Geometry panel as shown in Figure 3.
Figure 3. Geometry Panel After geometry creation, the material properties, boundary conditions, and the turbulence model are set through the Physics panel, shown in Figure 4. A uniform velocity and turbulence intensity can be specified at the inlet. A pressure outlet condition has been imposed at the outlet. The Reynolds number Re U 0 h based on Ahmed body height is displayed. Before starting the convergence process, the flow field can be initialized using an Initial Condition option in the Physics panel. A good initialization always leads to faster convergence. The domain can be meshed with triangular and quadrilat-
Figure 4. Physics Panel eral type elements. FlowLab provides coarse, medium, and fine mesh options suitable for use with the standard wall function. FlowLab allows solver parameters to be set through the Solve panel, shown in Figure 5. Number of time steps, time step size, iterations per time step, and auto-save frequency for storing the results can be specified. Different numerical schemes and single or double precision options are also available to be specified. In the present study, The Ahmed body with a slant angle of 25º is used. The size of the domain is 8.0 m long and 3.05 m high. The bottom surface of the Ahmed body is located 0.05 m above the ground. The incoming flow, located one meter upstream from the nose of body, is 40 m/s, with a 2.93% turbulence intensity and a viscosity ratio of 10. Air flow is assumed to be incompressible and Reynolds number, based on body height, is 7.68E+5. A multi-block structured mesh with 81,009 cells, created using the fine mesh option, was used for the present computation. The grid is shown in Figure 6.
Figure 5. Solve Panel Where the standard wall function was applied, first cell height constraints have been imposed in order to maintain y+ values in the range of 50 to 200, as recommended per the wall function guidelines. It has been found that grid quality and suitable time step are crucial for results accuracy. Transport equations for momentum and turbulence parameters were solved with second order accuracy using a double precision solver. Unsteady formulation was used with a time step of 0.0001 seconds to capture the shedding phenomenon. The drag and lift coefficients were monitored, and twenty shedding cycles were considered for the time averaging of the flow field.
Figure 6. Computational Mesh
4
RESULTS AND DISCUSSION
Figure 7. Contours of Turbulent Viscosity Ratio (k-model) The power of a CFD tool allows a student to vary geometry, boundary conditions, and physical models, and then view resulting complex flow phenomena. Time dependent features, such as vortex shedding behind the Ahmed body, may be captured. Figure 7 presents contours of turbulent viscosity ratio in the wake region for the k- model. Static pressure contours, for the RSM, are shown in Figure 8. In the lower half of the nose region, a sudden deceleration of the flow takes place resulting in increased static pressure. As the flow passes over the top of the nose, it accelerates rapidly creating a pressure suction zone. The flow velocity then gradually decreases along the top of the body, yielding a corresponding gradual increase in the static pressure profile.
Figure 10. Contours of Stream Function (k- model)
Figure 11. Contours of Stream Function (RSM) Although not shown, the v2-f model was also able to capture flow separation along the slant edge.
Figure 8. Contours of Pressure (RSM) Figures 9-11 show contours of stream function in the wake region of the Ahmed body with different turbulence models at the same time instance. It can be clearly seen that the k-ε model was not able to predict the separation along the slant edge, and the vortices are not as strong as those produced using RSM or k- models.
Figure 9. Contours of Stream Function (k-ε model)
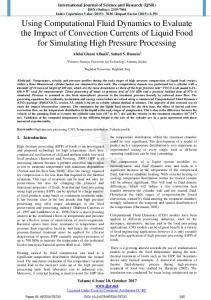
The focus of this study does not include validating the various turbulence models used for the Ahmed body simulation, because a two-dimensional simplification was applied. With the two-dimensional simplification, students may setup, run, and postprocess this model in a 50 minute class period using a single-CPU PC, as required for the 58:160 class at the University of Iowa. It is educational for students to understand the implication of a two-dimensional approximation for essentially a three-dimensional flow field, along with the consequent variation in both qualitative and quantitative results. Additionally, through this exercise, students may realize that the choice of the respective turbulence model will affect simulation prediction. Figure 12 presents a comparison of non-dimensional time-averaged velocity profiles (U* =Ux/120 + x/h, Y*= y/h) for the k-, k-, and Reynolds Stress models with experimental data [8] in the separation zone. The first two curves from the left present results along the slant edge of the Ahmed body, and the rest are in the wake region. It can be observed
5
CLASSROOM APPLICATION
In the fall of 2004, the Ahmed body exercise was used at the University of Iowa in a three-semester hour, intermediate-level fluid dynamics course, which is open to senior undergraduate and first-year graduate level Mechanical, Civil & Environmental, and Biomedical Engineering students [11]. This course was recently restructured to incorporate CFD content, including lectures such as “Introduction to CFD” “Numerical Methods for CFD,” “Turbulence Modeling for CFD” and “Grid Generation and PostProcessing for CFD,” along with a series of four CFD labs which exposed students to developing flow in a pipe, external flow over an airfoil, flow through a diffuser, and the Ahmed body exercise.
Figure 12. Time-Averaged Velocity Profiles that numerical results over predict the acceleration of flow on the slant edge, which is likely due to the twodimensional simplification. In two-dimensional formulation, flow does not separate from the sides, hence acceleration over the body is bound to be over predicted. This exaggerated acceleration results in large velocity values and a negative drag coefficient at the upper nose region, which is not a physical phenomenon. If the CFD runs were conducted using a threedimensional model, numerical results would be more meaningful, but this would also require a convergence time greater than the 50 minutes requested by the University of Iowa for a single CPU PC. Meaningful CFD validation, including drag coefficient validation, for the three-dimensional Ahmed body is reported by Makowski and Kim [9], whose work was performed using FLUENT. Another relevant CFD validation for the three-dimensional Ahmed body is reported by S. Kapadia et al. [10].
4.1
Study With Different Slant Angles
An important input parameter which affects flow field behavior for this two-dimensional Ahmed body exercise is the slant angle. Analysis was performed to consider different slant angles in the range of 5° to 30° using the RSM. It was determined that a reasonable match with experimental data for total drag coefficient exists for slant angles in the range of 25º to 30º. From this observation, it is recommended that a fully three-dimensional model be considered if the focus is on evaluating slant angles of less than 25°.
As part of the CFD labs, students received detailed exercise notes [12], which provided step-by-step guidance on how to use the software interface to achieve the specific objectives of each lab. The Ahmed body exercise was introduced last in the series of CFD labs, because of the relative complexity and time dependent nature of the flow field. CFD concepts covered in the Ahmed body lab were mesh and iterative convergence, effect of slant angle, unsteady boundary layer separation, vortex shedding frequency and Strouhal number analysis, flow animations, and experimental validation. The National Science Foundation curriculum development grant under which the CFD exercises were developed also sponsored evaluation and assessment of classroom experiences. Assessment techniques used included pre- and post-tests, evaluating CFD laboratory reports, student surveys administered by the College of Engineering, and faculty observation. Pre- and post-tests were administered in accordance with procedures specified by the University of Iowa’s Center for Evaluation and Assessment (CEA). For the most part, classroom performance was very good, with students showing cooperation and an eagerness to learn. The laboratory reports indicated students learned purposes, simulation designs, CFD processes and data analyses, and developed a deeper knowledge of fundamental concepts. The pre- and post-tests showed a 144% increase in the average grade for students. Student comments from the survey indicated that they liked participating in a hands-on, step-by-step method, flow visualization, features of the interface allowing for comparisons with analytical theory and experiments, and the opportunity to learn CFD skills which they may use in a future career.
6
CONCLUSIONS
FlowLab exercises provide a reasonable framework to expose non-expert students to CFD in lecture based or laboratory courses, requiring only a small investment of time for learning the software interface. For the two-dimensional, 25° Ahmed body exercise, k-, Reynolds Stress, and v2-f turbulence models were able to capture early separation along the slant edge, while the kε model did not. Discrepancies versus experimental results can be expected due to neglecting the threedimensional nature of the flow. The two-dimensional simplification allows for students to receive a meaningful educational experience, while requiring only a small fraction of the convergence time needed to perform a three-dimensional simulation. For slant angles less than 25°, a threedimensional CFD model is recommended for evaluating Ahmed body flow characteristics. The impact of the two-dimensional, simplified representation of a threedimensional geometry is a learning objective satisfied by this exercise. It is useful for engineering students to be exposed to the effects of turbulence model selection through the Ahmed body exercise, because it is common for the turbulence model to affect prediction when applying commercial CFD software to real world problems in industry.
REFERENCES [1].
[2].
[3].
[4].
S. R. Ahmed and G. Ramm, “Some Salient Features of the Time-Averaged Ground Vehicle Wake”, SAE Technical Paper, 840300, 1984. H. Lienhart, C. Stoots, and S. Becker, “Flow and Turbulence Structure on the Wake of a Simplified Car Model (Ahmed Model)”, DGLR Fach. Symp. der AGATAB, Stuttgart University, 2000. F. Stern, T. Xing, D. Yarbrough, etc., “Development of Hands-On CFD Educational Interface for Undergraduate Engineering Courses and Laboratories”, Proceedings of the 2004 ASEE Annual Conference and Exposition, 1526, 2004. J.O. Hinze, Turbulence, McGraw-Hill Publishing Co., New York, 1975.
[5].
B.E. Launder and D.B. Spalding, “The Numerical Computations of Turbulent Flows”, Computer Methods in Applied Mechanics and Engineering, 3:269-289, 1974. [6]. D.C. Wilcox, “Turbulence Modeling for CFD”, DCW Industries, Inc., La Canada, California, 1998. [7]. CASCADE Technologies Inc, http://www.fluent.com/about/partners/softserv e/cascade.htm. [8]. 10th joint ERCOFTAC (SIG-15) -IAHRQNET/CFD Workshop on Refined Turbulence Modeling, http://cfd.me.umist.ac.uk/. [9]. F. Makowski and S. Kim, “Advances in External-Aero Simulation of Ground Vehicles Using the Steady RANS Equations”, SAE World Congress, 2000-01-0484, March 2000. [10]. S. Kapadia, S. Roy, M. Vallero, K. Wurtzler, and J. Forsythe, “Detached-Eddy Simulation over a Reference Ahmed Car Model”, AIAA2003-0857. [11]. 58:160 Intermediate Mechanics of Fluids, http://css.engineering.uiowa.edu/~me_160. [12]. CFD Lab4 (Ahmed Car), Technical Note, http://css.engineering.uiowa.edu/~me_160/doc uments/CFD_lab4.pdf.