Using fuzzy control to maximize profits in service level management by Y. Diao J. L. Hellerstein S. Parekh
The growth of e-commerce is creating demand for services with financial incentives for service providers. Such services are specified by service level agreements (SLAs) in which revenue accrues with the number of completed transactions, and costs are incurred if response times go above a specified threshold. In this paper we propose a profit-oriented feedback control system that automates the admission control decisions in a way that balances the loss of revenue due to rejected work against the penalties incurred if admitted work has excessive response times. One approach to making these trade-offs is to employ classical control theory (e.g., proportional integral controllers); however, doing so requires a labor-intensive design process that tailors the controller to a specific workload and profit model. Instead, we develop a fuzzy control algorithm that implements hill climbing logic to maximize profits and handle the stochastics that make profits quite “bumpy.” Our studies of a Lotus Notes® e-mail server reveal that the fuzzy controller requires little human intervention and is robust to changes in workloads and values of SLA parameters. Further, we prove that our design of the fuzzy controller leads to a value of the admission control parameter that maximizes steady state profits.
The advent of e-commerce has created a business need for high-quality information technology (IT) services. For example, a “buy” transaction that takes more than a few seconds may cause the customer to IBM SYSTEMS JOURNAL, VOL 41, NO 3, 2002
abandon the purchase. As a result, businesses are seeking quality-of-service (QoS) guarantees from their service providers (SPs). These guarantees are expressed as part of service level agreements (SLAs), often with financial incentives. For example, provider revenues may be determined by the number of completed transactions, and providers may incur financial penalties for SLA violations (e.g., exceeding response time guarantees). Since demand for services is often unpredictable, providers must sometimes make trade-offs between losing revenue (e.g., as a result of admission control that denies access to some customers) and incurring penalties (e.g., because admitted work cannot be completed within the SLA-dictated response time). Making such choices is skill-intensive and time-consuming, and the decisions must be made in real time. In this paper we focus on QoS at the application layer, as opposed to the network-level QoS considered in the work on DIFFSERV and RSVP. 1 A variety of SLAs have been published. Reference 2 describes a template for frame relay SLAs. Reference 3 provides guidelines for the state of Texas, including considerations for response time, availability, and downtime. Reference 4 does the same for the University of Michigan IT. We generalize these examples and consider a simple profit model in which: (A) the service provider receives revenues for each completed interaction (hereafter, transaction) 娀Copyright 2002 by International Business Machines Corporation. Copying in printed form for private use is permitted without payment of royalty provided that (1) each reproduction is done without alteration and (2) the Journal reference and IBM copyright notice are included on the first page. The title and abstract, but no other portions, of this paper may be copied or distributed royalty free without further permission by computer-based and other information-service systems. Permission to republish any other portion of this paper must be obtained from the Editor.
0018-8670/02/$5.00 © 2002 IBM
DIAO, HELLERSTEIN, AND PAREKH
403
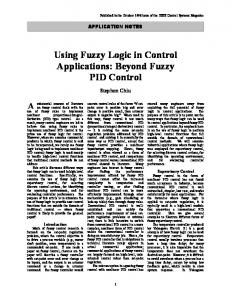
Figure 1
Profit-based feedback in a hand-crafted PI controller for a Lotus Notes e-mail server
DESIGN PHASE CONTROLLER DESIGN AND REFERENCE VALUE SELECTION
PROFIT MODEL
SYSTEM IDENTIFICATION USERS
REFERENCE VALUE
PI CONTROLLER
COMPLETED TRANSACTIONS
MAXUSERS
RESPONSE TIME
ADMINISTRATOR ON-LINE FLOW DESIGN FLOW
SERVER
SERVER LOG
Reprinted with permission from Y. Diao, J. L. Hellerstein, and S. Parekh, “A Business-Oriented Approach to the Design of Feedback Loops for Performance Management,” Figure 1, Proceedings of the 12th International Workshop on Distributed Systems: Operations and Management (DSOM’01), Nancy, France, October 2001, IEEE, New York (© 2001 IEEE).
and (B) a cost is incurred if response times are excessive. The profit model is described by three parameters: (1) r, the revenue received for each completed transaction; (2) W, the response time constraint; and (3) c, the cost incurred if a transaction’s response time exceeds W (offending transactions). Thus, profit is determined by the number of completed transactions and the number of offending transactions as follows: Revenue ⫽ r ⴱ (number of completed transactions) Cost ⫽ c ⴱ (number of responses that take longer than W) Profit ⫽ Revenue ⫺ cost Diao et al. 5 describe this and other profit models in more detail, including generalizations to multiple 404
DIAO, HELLERSTEIN, AND PAREKH
classes by subscripting r, W, and c to make them perclass variables. As the first step toward building an intelligent controller for service management, the profit model presented above is deliberately simple. By no means does this profit model capture all dimensions of QoS. In particular, we ignore any explicit terms related to rejected requests. The rejection scheme is implicitly considered in the above profit model as a combination of lost revenue (the transaction request is not admitted) and cost of penalty (cost of offending transactions). enforcement requires a control infrastructure, much of which consists of feedback loops. For example, the lower portion of Figure 1 displays a feedback loop for controlling response times in a Lotus Notes* e-mail server (the upper portion describes
SLA
IBM SYSTEMS JOURNAL, VOL 41, NO 3, 2002
how to manually design the controller and is discussed in the section on profit-based proportional integral [PI] controller design). Mail users interact with the server to retrieve, browse, catalog, and send their mail. Administrators specify policies in the form of desired response times. The difference between the reference value and measured response times is the control error. This is used by the controller to compute the setting of MaxUsers, which is the limit on the number of users allowed to connect to a Notes application. Note that some desired feedback elements (such as end-user response time) are user-oriented metrics, which may be difficult for the SP to obtain. However, they can be estimated from some server-side measurements or by using client-side probing stations. Feedback loops have been widely studied; typically, they are analyzed in terms of stability, steady state error, and transient response 6 (usually characterized by rise time, overshoot, and settling time). Our interest is in a business-oriented analysis, in particular how to design controllers that maximize SLA profits. More specifically related to our work, Reference 7 describes an implementation that manages Web server resources based on maximizing revenue (e.g., responding within 8 seconds so that users are not discouraged). However, they do not study the characteristics of control actions that are preferred, nor is the choice of profit model considered. Reference 8 describes a system that performs on-line optimization of a Web server by using hill climbing techniques. However, the approach taken requires a detailed knowledge of the system being optimized in order to construct the queueing models. Reference 9 considers the optimization problem of maximizing the SLA profits based on queueing-theoretic formulas, but the proposed scheme does not incorporate feedback, which makes it less adaptable in the presence of time-varying workloads (quite common in e-commerce systems). Others (e.g., References 10 –12) have studied the performance characteristics of feedback controllers used for resource management, and much work has been done on pricing models for information systems, such as pricing bandwidth and transactions (e.g., References 13, 14). In those studies, however, the connection to profitability through SLAs is missing and so the derivation of the controller characteristics that maximize profits is not addressed. Fuzzy control has been an active area of research as well. 15 Reference 16 uses fuzzy methods to solve the job scheduling problems. Reference 17 applies fuzzy IBM SYSTEMS JOURNAL, VOL 41, NO 3, 2002
logic to some multimedia applications where the information, be it sound, image, or text, is not precisely specified. Others have applied fuzzy techniques to profit maximization: Reference 18 addresses bank credit granting, while Reference 19 addresses profit maximization for decision support. (But neither addresses profit optimization in the context of feedback control.) Most closely related to our study is Reference 20, which derives fuzzy control laws to maximize the profit of a simple queueing system. Although this is a step toward profit-maximizing feedback control of computing systems, the results are specific to GI/M/1 tandem queues and require prior knowledge of arrival rates. We are interested in a general way of constructing profit-maximizing feedback loops that do not rely heavily on prior knowledge about the target system. One approach is to use classical control theory to design feedback loops that maximize profits. We describe below experiments in which a fast proportional integral (PI) controller (one with short settling times) generates increased profits. Unfortunately, considerable skill is required to design good PI controllers, and this runs counter to the trend toward autonomic computing in which computing systems are self-optimizing. 21 Herein, we propose a feedback control system that directly optimizes profits and is robust to changes in workloads, the target system (the system in which it is used), and the underlying service level agreement (although the last does need to be reflected in the feedback loop). A fuzzy controller is employed to construct a profit-maximizing feedback loop, which avoids skill-intensive alternatives such as building a specific queueing model or handcrafting a PI controller. Our approach is based on the nature of cost and revenue curves. In particular, we show that under some reasonable assumptions for a Lotus Notes e-mail server, profits are concave downward in the control parameter (MaxUsers). We construct a fuzzy controller that employs hill climbing to maximize steady-state profits. This approach provides a convenient way to separate the logic of hill climbing (as expressed in fuzzy rules) from the calculation of new values of MaxUsers (as represented by the membership functions). Such a separation is desirable in order to deal with resident stochastic processes and the resulting increase in the variability of the on-line profit measurement. We use a Lyapunov analysis to prove that the proposed fuzzy controller leads to the maximum profit at steady state. DIAO, HELLERSTEIN, AND PAREKH
405
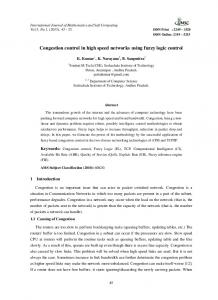
Figure 2
High-level description of Lotus Notes e-mail server with admission control
POTENTIAL USERS AT LARGE
USER ARRIVES MAXUSERS
ADMISSION CONTROL
USER DEPARTS
USER ADMITTED
SERVED USER SESSIONS SESSION 1 SESSION 2
RPC
RPC QUEUE
NOTES SERVER (SERVICE TIMES)
SESSION N (THINK TIMES) SERVED RPC
Reprinted with permission from Y. Diao, J. L. Hellerstein, and S. Parekh, “A Business-Oriented Approach to the Design of Feedback Loops for Performance Management,” Figure 2, Proceedings of the 12th International Workshop on Distributed Systems: Operations and Management (DSOM’01), Nancy, France, October 2001, IEEE, New York (© 2001 IEEE).
The handcrafted PI controller requires human involvement to select control gains and reference values for specific profit models (values of W, r, and c) and workloads. In contrast, the profit-based fuzzy control does not require human intervention when the profit model or workload changes. Although mechanisms must be in place to communicate changes in the profit model to the controller, changing the profit model does not require a controller redesign to get good performance. Thus, using fuzzy control may be more economical to employ in practice. The remainder of the paper is organized as follows. The next section describes how a PI controller can be handcrafted for a specific workload and profit model. The following section details the architecture and fuzzy rules used in the feedback loop that we propose and provides comparisons with the handcrafted approach. The section after that proves that our fuzzy rules cause the controller to converge toward an operating point with maximum profit in steady state. Our conclusions are contained in the final section. 406
DIAO, HELLERSTEIN, AND PAREKH
Handcrafted PI control In this section we describe a manual approach to constructing controllers that aim to maximize profits. We begin by describing the Lotus Notes system and its behavior for a static value of MaxUsers, a situation referred to as open-loop control. For additional details see Reference 5. Open-loop control. We begin with a high-level description of the Lotus Notes e-mail system. The structure of this system is displayed in Figure 2. Potential users must pass through admission control, which is gated by the MaxUsers parameter. Once admitted, users cycle through two states: (1) thinking and (2) waiting for a response to an RPC (remote procedure call) submitted to the Notes server. Admission control rejects users if the number of users already present in the system is greater than or equal to MaxUsers. The details here are a bit more involved since admission control is exercised only for OpenDB RPCs, and subsequent RPCs from the same user will bypass the admission control scheme and enter the RPC queue directly. 10 Once admitted to the Notes sysIBM SYSTEMS JOURNAL, VOL 41, NO 3, 2002
tem, users remain for the duration of their session, and the admission controller does not force admitted users to log off, nor does it know if a user logs off by itself. This certainly affects the effectiveness of the admission control scheme (e.g., there may exist a delay between the decrease of the tuning parameter MaxUsers and the decrease of the number of actual served sessions). We have implemented a simulator to model the above Notes mechanism, which produces accurate values of response times and transaction completions, typically within 1 percent of the real system, 22 at least for standard benchmarks. Now consider the profits of a Lotus Notes system in which MaxUsers is static. We use a time-varying workload that mixes low and high workloads (the workload is defined as the reciprocal of the average user think times) as follows: Period 1 (low workload) covers interval 1–2 hours and has think time 10 seconds; Period 2 (high workload) covers interval 2– 4 hours and has think time 3 seconds; Period 3 (low workload) covers interval 4 – 6 hours and has think time 10 seconds. We also define three profit models P(1), P(2), and P(3) with different values for parameters r and c. P(1): r ⫽ c, that is, assigns equal weights to completed and offending transactions; P(2): r ⫽ 5c, assigns more weight to completed transactions; P(3): r ⫽ c/5, assigns more weight to offending transactions. Generally, our studies show that we may not select a static value of MaxUsers that is suitable for the whole mixed low-high workload, as this static value will be a compromise between the low workload and the high workload. In particular, during light loads, response times may rarely exceed W. Although this reduces costs, it also means that we might be able to increase profits by having a larger MaxUsers during light loads, since doing so would increase completions (and hence revenue) faster than it would increase response time violations (and hence costs). Conversely, during the heavy load, response times are mostly violated, and so having a smaller value of MaxUsers can increase profits. This example suggests that profits could be increased by dynamically adjusting MaxUsers in response to changes in workload. Profit-based PI controller design. When designing
feedback controllers we try to ensure stability and to provide desirable characteristics. Here, we focus on a simple but widely used class of controllers, with PI control and good performance specifications (i.e., quick convergence, zero steady-state error). PI controllers compute the value of the tuning control as IBM SYSTEMS JOURNAL, VOL 41, NO 3, 2002
冉
1 u共k兲 ⫽ KP e共k兲 ⫹ TI
冘 e共 j兲
k⫺1
j⫽1
冊
(1)
where u(k) is the output of the controller (the tuning control) and e(k) is the control error (difference between the reference value and the measured value of the controlled metric) for the k th time interval. Intuitively, the adjustment of the tuning control depends on the current value of e(k) and the sum of past e(k) values. Their effects on the tuning control are weighed by the proportional control gain K P for the response to system disturbances (e.g., workload variations) and the integral control time constant T I for eliminating the steady-state error. Designing a PI controller means properly specifying K P and T I so as to eliminate the steady-state error with certain convergence speed. 23 One way to design a profit-based PI controller is to explore the space of controller parameters using models and then evaluate the most promising controllers on the target system (Lotus Notes, in our case). As illustrated in the upper portion of Figure 1, we first use system identification techniques to construct system models which are in the form of first order difference equations y共k ⫹ 1兲 ⫽ ay共k兲 ⫹ bu共k兲
(2)
where u(k) is the offset value of MaxUsers and y(k) is the offset value of response time (the offset is the difference between the measured value and the operating point, obtained by averaging the collected data). The model parameters a and b are estimated using the least squares method. 10 Although quite simple, it turns out that this model can account for 88 percent of the variability in response times in our detailed simulation of Lotus Notes. Similarly, we have also built a first order model from MaxUsers to completed transaction. A good fit is obtained for completions as well. The next step is to design the controller by properly selecting the control gains. This is done by employing the models just described. Using Equation 2, we study nine controllers defined by K P 僆 {0.2, 2, 20} in combination with T I 僆 {2, 10, 200}. Figure 3 displays the modeled response times of these controls when they are perturbed by both an increase and a decrease in MaxUsers at 200 and 300 minutes, respectively. (We use this perturbation to simulate workload variation.) The x-axis is time, and the yDIAO, HELLERSTEIN, AND PAREKH
407
Figure 3
Comparison of transient response using first-order models with reference value 1
RESPONSE TIME
(1) Kp=0.2 Ti=2
(2) Kp=2 Ti=2 5
2
0
0
0
−5
−2
300
400
−10 200
(4) Kp=0.2 Ti=10
300
400
x 10212
−4 200 x 1011
(5) Kp=2 Ti=10
5 RESPONSE TIME
2
4
−2 200
4
5
2
0
0
−5
300
400
(6) Kp=20 Ti=10
0
−5 200
300
400
−2 200
(7) Kp=0.2 Ti=200
300
400
−10 200
(8) Kp=2 Ti=200
6 RESPONSE TIME
(3) Kp=20 Ti=2
x 1031
300
400
(9) Kp=20 Ti=200
4
4
2
2
0
0
4 2 0 −2 200
300 TIME (MINUTES)
400
−2 200
300 TIME (MINUTES)
400
−2 200
300
400
TIME (MINUTES)
Reprinted with permission from Y. Diao, J. L. Hellerstein, and S. Parekh, “A Business-Oriented Approach to the Design of Feedback Loops for Performance Management,” Figure 6, Proceedings of the 12th International Workshop on Distributed Systems: Operations and Management (DSOM’01), Nancy, France, October 2001, IEEE, New York (© 2001 IEEE).
axis is response time. The dotted line is the reference value of response time. The nine combinations of K P , T I are arranged in a matrix of plots with rows having the same T I and columns having the same K P . We see that the controllers can be separated into three groups. Controllers 2, 3, and 6 are unstable, as can be seen by the large scale of the y-axis. Controllers 4, 7, and 8 have fairly long settling times (especially controller 7) compared with controllers 1, 5, and 9. We refer to the former as slow controllers and the latter as fast controllers. Generally, we pre408
DIAO, HELLERSTEIN, AND PAREKH
fer fast controllers because they are able to quickly compensate for the disturbance so as to maintain proper response time regardless of workload variation. The final step is to evaluate the designed controller and to specify the reference values. Generally, faster controllers (i.e., 1, 5, 9) consistently have the largest profits. Profits for controllers 2, 3, and 6 are the lowest because they are unstable. Also, the slow controllers 4, 7, and 8 do not generate high profits since IBM SYSTEMS JOURNAL, VOL 41, NO 3, 2002
their long settling times either indicates losing revenue (if they fail to respond to lower workloads by rapidly increasing MaxUsers) or incurring extra costs (if they fail to decrease MaxUsers fast enough for higher workloads). Also note that the choice of the reference value has large impact on the profit, and it is affected by the profit model parameters. Generally, this is a trial and error process following the rule of thumb that a larger reference value is desired for the profit model more favorable to the revenues, but a smaller reference value is needed if the cost of violating SLAs is dominant (additional details can be found in Reference 5). We draw two insights from the foregoing. First, fast controllers with short settling times (e.g., controller 5) consistently result in higher profits. Second, manual construction of a profit-based PI controller is time-consuming and skill-intensive. Specifically, the manual approach requires steps for: (1) model building, (2) model-based parameter exploration, and (3) detailed studies of selected controllers with different reference value settings. In the next section, we show how much of this manual burden is alleviated by using a fuzzy control approach.
Fuzzy controller Fuzzy control provides a means for expressing control laws as high-level rules. Using fuzzy rules for profit maximization can both simplify the controller design (no need for building the model and specifying the reference value) and make it more robust to the variations in workloads and profit models. In this section we describe and evaluate a fuzzy controller we developed for the Lotus Notes simulator described in the previous section. Profit model structure. In the next section we de-
scribe the design of the fuzzy controller. That design is based on certain properties of the profit model structure that will be the focus of this section. Specifically, we show that profit is a concave downward function of MaxUsers, if offered load is sufficiently heavy (so that MaxUsers always has an effect). Since we are concerned with steady state, we assume that MaxUsers remains constant for a sufficiently long time so that transient effects are minimal. We begin with the number of transactions that violate the response time constraint. Let f(u) be the number of violating transactions when MaxUsers ⫽ u. Further, let f⬘(u) be the derivative of f with respect to u, and f ⬙(u) be the second derivative. We IBM SYSTEMS JOURNAL, VOL 41, NO 3, 2002
Figure 4
A
Illustrating the properties of the profit model
COST (v)
MAXUSERS (u)
C
B
PROFIT (h)
u0
REVENUE (w)
MAXUSERS (u)
uw MAXUSERS (u)
intuitively infer the properties of f, f⬘, f ⬙ by examining common queueing curves. In particular, we assume the following: (A) f(0) ⫽ 0 (i.e., if we do not admit any transactions, we cannot have violations of response time constraints) (B) f⬘(u) ⱖ 0 (i.e., we get more violations as MaxUsers increases), with f⬘(0) ⫽ 0 (C) f ⬙(u) ⱖ 0 in that the rate at which violations increase grows as MaxUsers increases. The rate of increase is small for low values of MaxUsers since resource contention is low and the probability of a violation is small. However, the probability of a violation grows rapidly as MaxUsers increases. Let v(u) be the cost incurred by operating the server at MaxUsers ⫽ u. This is v(u) ⫽ cf(u), where c ⬎ 0. Since f has the above properties, so does v. This is depicted in Figure 4A. We can do a similar analysis for completions and revenue. Let g(u) be the number of completions if MaxUsers ⫽ u. Clearly, (D) g(0) ⫽ 0 (i.e., no admissions means no completions) DIAO, HELLERSTEIN, AND PAREKH
409
(E) g⬘(u) ⱖ 0 (i.e., more admissions lead to more completions), and g⬘(0) ⬎ 0 (going from no admissions to a positive number, the number of completions can only go up). The latter does assume that there is no thrashing, such as occurs in resource constrained virtual memory systems. Things are a bit different for g⬙(u). As MaxUsers grows large, resource bottlenecks occur that place an upper limit on throughput. When u is small, g⬘(u) increases rapidly since all offered load becomes carried load. However, for larger u, there are periods in which resources are saturated and so additional offered load does not translate into more carried load. Thus, the rate at which g⬘(u) increases begins to slow. Put differently, (F) g⬙(u) ⱕ 0 Let w(u) be the revenue incurred when MaxUsers ⫽ u. Then, w(u) ⫽ rg(u), where r ⬎ 0. Thus, the properties (D), (E), and (F) also apply to w(u). This is depicted in Figure 4B. Now consider profit. Define h(u) to be the profit at u. Then, h(u) ⫽ w(u) ⫺ v(u). We consider a situation in which for large u, v⬘(u) ⬎ w⬘(u), 24 which is consistent with Figure 4. With this and if costs abide by (A), (B), and (C) above and revenues abide by (D), (E), and (F) above, then profits are concave downward. To prove this claim, note that h⬘(u) ⫽ w⬘(u) ⫺ v⬘(u). Since w⬘(0) ⬎ 0 and v⬘(0) ⫽ 0, we have h⬘(0) ⬎ 0. Also, since v⬘(⬁) ⬎ w⬘(⬁), we have h⬘(⬁) ⬍ 0. Thus, if h⬘(u) is continuous, there exists u 0 such that h⬘(u 0 ) ⫽ 0. Moreover, note that h⬙(u) ⫽ w⬙(u) ⫺ v⬙(u) ⬍ 0 (since w⬙(u) ⱕ 0 and v⬙(u) ⬎ 0). Hence, u 0 is a unique maximum point. Note that at very large values of u, f⬘(u) ⫽ 0 since resource bottlenecks limit the number of transactions and hence the number of offending transactions. Therefore, the above analysis is only valid locally and h⬘(⬁) ⬍ 0 only stands for large enough u; profit is locally concave downward. How do the foregoing relate to data we obtain from the Notes simulations? Figure 5 shows the cumulative profit for the profit models P(1)–P(3) as before in combination with light and heavy workloads. All the profit curves are concave downward, except under a high workload. Here, MaxUsers is large and 410
DIAO, HELLERSTEIN, AND PAREKH
so profits are flat due to the saturation of the server and the limited number of arriving users. Note that the profit shown is accumulated over an interval of 5 hours for Figure 5 to clearly view the trend of profits. Also note that the optimal MaxUsers values for the maximum profit are quite different for different workloads. This motivates dynamic profit optimization since a fixed MaxUsers selected off line may not be proper when the workload is changing (similarly for the change of profit models). Controller design. In this section, we describe the
high-level architecture of our fuzzy control system and how it differs from the PI controller introduced before. Next, we discuss how the controller is designed to exploit the profit model structure derived above, and how it is able to handle stochastics in the feedback. Finally, we evaluate our controller for efficiency and robustness, using a well-tuned PI controller as a baseline. Controller architecture. The architecture of our pro-
posed fuzzy control system is shown in Figure 6. Just like the PI controller, we define a sampling interval that dictates how often actions are taken. The feedback loop includes a profit model component (upper right) that computes the profit for each interval. Note that the inputs for computing the profit are the throughput (completed transactions) and response time. To get the actual values may be difficult. However, they can be estimated from the server-side measurements or client-side probing stations. Also note that we compute and maximize the profit based on intervals. By having a long enough interval we ensure that the measured interval profit is representative. Also, this interval is not too long, so that the controller can adapt quickly to changes in the operating environment. The next component on the feedback path is a differentiator, which outputs the change in profit value (d y) between the current interval and the last. The other element of the feedback is the change in MaxUsers value (du). As we show below, it is more convenient for the controller to work with du and d y rather than the original values. The output of the controller is m, an adjustment to MaxUsers for the next time interval. An integrator element converts this delta into an actual MaxUsers value for the Notes server. The internals of the controller are described in the next section. This profit-based fuzzy controller in Figure 6 differs in substantial ways from the PI controller depicted in Figure 1. Specifically, the PI controller regulates to a desired response time by having an expert careIBM SYSTEMS JOURNAL, VOL 41, NO 3, 2002
Figure 5
Profit shapes for the Notes server
P(1)
LOW WL
HIGH WL
4000
4000
3000
3000
2000
2000
1000
1000
0
0 0
50
100
150
200 6000
4000
4000
2000
2000
50
100
150
200
0
50
100
150
200
0
50
100
150
200
P(2)
6000
0
0
0
P(3)
0
50
100
150
200
1000
1000
0
0
−1000
−1000
−2000
−2000
−3000
−3000 0
50
100
150
200
MAXUSERS
fully choose the controller parameters through extensive off-line analysis of the target system (the Notes server) and the profit model. This work may have to be redone if there are changes in the workload, the target system (e.g., a software upgrade), or the profit model. Indeed, we expect that profit models will change frequently due to negotiations of SLA agreements that change the revenues (r) to service providers, the costs of service level violations (c), and the negotiated response time constraints (W). In contrast, the fuzzy controller incorporates the profit model as an element of the feedback loop. Such a design allows the controller to adjust automatically to changes in the workload, the target system, and even the profit model. IBM SYSTEMS JOURNAL, VOL 41, NO 3, 2002
MAXUSERS
Controller components. As mentioned earlier, the
fuzzy controller’s actions are guided by a set of fuzzy rules. The rules are stored in a rule database (or rule base), which is part of the controller. These rules are generally IF-THEN rules defined in terms of linguistic variables, which are different from the numerical input-or-output variables of the controller. As we discuss below, these linguistic variables are a natural way to handle uncertainties created by the stochastics present in most computer systems. Linguistic variables exist in one-to-one correspondence with some numeric variable of the system. For example, change-in-MaxUsers is a linguistic variable corresponding to the numeric variable for the actual DIAO, HELLERSTEIN, AND PAREKH
411
Figure 6
Architecture of the profit-based fuzzy controller
dy
PROFIT
d/dt
PROFIT MODEL
USERS
FUZZY CONTROLLER
m
COMPLETED TRANSACTIONS
MAXUSERS
RESPONSE TIME SERVER
SERVER LOG
INFERENCE MECHANISM
RULE BASE
DEFUZZIFICATION
FUZZIFICATION
du
change in the MaxUsers value. (Similarly for changein-profit and next-change-in-MaxUsers.) A linguistic variable takes on linguistic values, such as poslarge and neglarge. (Note that neglarge is generally used in fuzzy control literature as an abbreviation for “negative large in size” and so on for others such as poslarge or possmall.) Linguistic variables actually take on a “degree of truth” for each possible linguistic value. This is represented as a continuous value between 0 to 1 where 0 is false, 1 is true, and 0.5 indicates we are halfway certain. The mapping from a numeric value to a degree of truth for a linguistic value is done by the membership function . We use triangular membership functions, 25 as shown in Figure 7, to map from the numeric variables (the 412
DIAO, HELLERSTEIN, AND PAREKH
change of MaxUsers value (du), the change of the profit (d y), and the expected change of the MaxUsers as the next step (m)), to the linguistic variables (change-in-MaxUsers, change-in-profit, and next-change-in-MaxUsers, respectively). The y-axis indicates the degree of truth for each of the linguistic values neglarge and poslarge. For example, du ⫽ 0.5 maps to 0.75 for poslarge and 0.25 for neglarge. Note that the measured variables are normalized before applying the mapping function, which is why the x-axis shows ⫺1 and 1 for all the membership functions. This is done by multiplying the measured numeric quantities by factors known as the normalizing gains, and denoted g du and g d y . For example, in the membership function shown in Figure 7, we IBM SYSTEMS JOURNAL, VOL 41, NO 3, 2002
Figure 7
Membership functions and fuzzy inference
neglarge
µ 1
poslarge
neglarge
µ 1
poslarge
neglarge
µ 1
poslarge
AND
du −1
1
CHANGE IN MAXUSERS
dy −1
Due to the stochastic nature of computing systems, the on-line internalized profit feedback will contain significant variability, particularly when the sample intervals are short. Hence, there is some uncertainty as to how much of the change in profit from one interval to the next is caused by the setting of MaxUsers and how much is due to stochastics. Fuzzy set theory provides a natural way to handle such stochastic data, by using the normalizing gains and membership functions to characterize these uncertainties (as shown in Figure 7 between ⫺1 and 1). In the example above, the mapping of du ⫽ 0.5 indicates that we are more certain (0.75) that the “actual” value of du is positive large than negative large (0.25). The fuzzification component of the controller (bottom of Figure 6) implements the membership functions discussed above and converts the input numerical variables to their linguistic equivalents. Fuzzy inference involves the evaluation of the fuzzy rules in the rule set and combining the actions of rules (the THEN parts) to yield an output in terms of a linguistic variable. For details of fuzzy inference, please refer to a standard text on fuzzy control (e.g., Reference 15). The defuzzification component is complementary to fuzzification and converts the output linguistic variable to a numerical value. Since the concave-downward shape of the profit model implies that there is an optimal value of MaxUsers, which we denote by u 0 , that maximizes profits, we next describe a fuzzy rule set that implements a hill-climbing procedure to find this optimal value.
1
NEXT CHANGE IN MAXUSERS
CHANGE IN PROFIT
would like that change-in-MaxUsers map to poslarge if it is larger than 1. For example, if g du ⫽ 1/10, change-in-MaxUsers is poslarge if 10 more users are allowed to enter.
IBM SYSTEMS JOURNAL, VOL 41, NO 3, 2002
m −1
1
The fuzzy rules are easy to design based on our intuitive understanding of hill climbing. Thus, if the current MaxUsers is to the left of the optimal value, we would want to increase MaxUsers in order to increase profits. However, since the optimal value is not known, the fuzzy rules must first determine whether we are to the left or to the right of the MaxUsers that maximizes profits. Moreover, we must adjust MaxUsers in appropriate increments since too small a change will cause slow convergence, whereas too large a step may cause oscillation. The following four rules are given to address these issues. change-in-MaxUsers is neglarge change-in-profit is neglarge THEN change-in-MaxUsers is poslarge. Rule 2: IF change-in-MaxUsers is neglarge change-in-profit is poslarge THEN change-in-MaxUsers is neglarge. Rule 3: IF change-in-MaxUsers is poslarge change-in-profit is neglarge THEN change-in-MaxUsers is neglarge. Rule 4: IF change-in-MaxUsers is poslarge change-in-profit is poslarge THEN change-in-MaxUsers is poslarge.
Rule 1:
IF
AND
nextAND
nextAND
nextAND
next-
The IF part determines the position on the profit curve, as well as the distance from the optimal point. For example, in Rule 4, if we increase MaxUsers and the profit increases, then we are to the left of the maximum. The THEN part indicates the suggested action. Again in Rule 4, we should continue to increase MaxUsers. Rule 2 and Rule 4 indicate the “correct” situations in that the profit is increasing. Conversely, Rule 1 and Rule 3 handle the “incorrect actions,” where the previous action caused the profit to decrease. Since we do not know the actual MaxUsers value that maximizes the profit, these rules are easier to describe in terms of changes to the MaxDIAO, HELLERSTEIN, AND PAREKH
413
Users and profit values. This is why our controller architecture (Figure 6) uses du and d y. Afterwards, the consequents from all activated rules (with nonzero ) are weighted (e.g., using the “center of gravity” method) to compute the appropriate adjustment to MaxUsers. Note that the above four rules are only given to illustrate the tuning concepts, whereas more complicated rule sets can be defined to have a finer definition of the linguistic values (e.g., neglarge, negmed, negsmall, zero, possmall, posmed, poslarge) to increase the design flexibility, and to incorporate more knowledge such as how to get out of the flat saturation regions. Also worthy of mention is that for a typical tracking or regulation problem where the objective is to have zero control error, the inputs of the controller usually include both error and change-in-error (similar to a PI controller, but note that the fuzzy controller output should be a “change,” which makes the fuzzy controller operate like a PI controller but with nonlinear operating functions). For the problem studied in this paper, the control objective is to achieve maximum profit. Since this maximum value is unknown in advance, the error (the difference between the current profit and the maximum profit) is also unknown and cannot be used as an input. Instead, we use change-in-MaxUsers and change-in-profit as control inputs, since they are both measurable. Our later stability analysis shows that the system can indeed be stabilized and the maximum profit can be reached under this setting and with certain constraints. The use of fuzzy inference allows us to separate the logic of hill climbing from the calculation of values of MaxUsers. The rules encode the logic, and the membership function controls how profit and MaxUsers are weighted and adjusted during fuzzy inference. Evaluation. Under the fuzzy control architecture and
fuzzy rule base introduced in the previous sections, the design includes selecting the control interval and choosing the scaling factors (normalizing gains) g du , g d y , and g m . We select a control interval of 10 minutes because the profit data are not measured very frequently (e.g., by using the probing station). A large control interval also reduces the variability in the profit data and gives a more accurate measure. Next, the normalizing gains are tuned by trial and error in order to achieve good control performance. The tuning process can be guided by some heuristic 414
DIAO, HELLERSTEIN, AND PAREKH
knowledge of the target system and its dynamics. Generally, the larger the value of g du , the faster the control action, that is, the controller responds more quickly. However, too quick a control response may cause system oscillation as the controller overreacts to small variations in measurements. We choose g du ⫽ g m ⫽ 1/ 20 and g d y ⫽ 1/ 2 based on the system dynamics, considering that a change of 20 in MaxUsers or of 2 in profit are reasonably large. We compare the fuzzy controller with PI controller 5 (Figure 3) that is tuned for a specific profit model (the response time constraint is 3 seconds) and a specific workload (the mixed light and heavy workload as defined earlier). As Figures 8 and 9 show, the PI controller can generate good profits, whereas the fuzzy controller adjusts MaxUsers less rapidly, which results in lower profits. This is because the test scenario is exactly the same as that for which the PI controller is tuned. We would like to highlight that although the fuzzy controller is optimal in steady state, the current workload has several transients that the fuzzy controller (due to its slower reaction) does not handle as well as the PI does. Also note that the PI controller operates with a significantly smaller sampling interval (5 seconds) than the fuzzy controller (10 minutes). This is because the profit data have much more variability than the response time. In order to have a relatively smooth and accurate measure of the profit, a larger sampling interval is necessary. This is also why the MaxUsers plot in Figure 8 appears “smoother.” What happens if the profit model and/or workload changes? Figure 10 addresses this question by comparing profits of PI 5 with those of the fuzzy controller. Three workloads are considered (as indicated at the top of each column). The profit model is also varied in that the rows represent different values of r, c, and the horizontal axis specifies W. For PI controller 5 we use K P ⫽ 2 and T I ⫽ 10 for all cases. The reference value depends on the profit model, and we use 1.5 for the profit model P(1), 2 for P(2), and 1 for P(3) (obtained according to trial and error for the case where W ⫽ 3). We do not redesign the fuzzy controller, which means we use the same normalizing gains g du ⫽ 20, g d y ⫽ 2, and g m ⫽ 20 and the same membership functions as indicated in Figure 7 for all the simulation runs shown in Figure 10. The PI controller does well in the range of workload and W values for which it is trained. Otherwise, the fuzzy controller generally produces higher profits. Unlike selecting the reference value for the PI conIBM SYSTEMS JOURNAL, VOL 41, NO 3, 2002
Figure 8
Behavior of P1 controller 5 for profit model P(1) and W=3
MAXUSERS
PROFIT (1): 3518.6
MEASURED RT QUEUELENGTH
PROFIT (3): 551.72
200 100 0
COMPTRANS
PROFIT (2): 3670.6
1
1.5
2
2.5
3
3.5
4
4.5
5
5.5
6
1
1.5
2
2.5
3
3.5
4
4.5
5
5.5
6
01
1.5
2
2.5
3
3.5
4
4.5
5
5.5
6
1
1.5
2
2.5
3
3.5
4
4.5
5
5.5
6
1
1.5
2
2.5
3
3.5
4
4.5
5
5.5
6
1
1.5
2
2.5
3
3.5
4
4.5
5
5.5
6
1
1.5
2
2.5
3
3.5
4
4.5
5
5.5
6
100 50 0 20 10
200 100 0
P(1)
5 0 −5 P(2)
5 0 −5 P(3)
1 0 −1
TIME (HOUR)
Reprinted with permission from Y. Diao, J. L. Hellerstein, and S. Parekh, “A Business-Oriented Approach to the Design of Feedback Loops for Performance Management,” Figure 8, Proceedings of the 12th International Workshop on Distributed Systems: Operations and Management (DSOM’01), Nancy, France, October 2001, IEEE, New York (© 2001 IEEE).
troller, the design process of the profit-based fuzzy controller is not affected by the selection of the profit model. Hence, it is more adaptable to various profit models (as illustrated in Figure 10 for different response time constraints).
Stability and convergence analysis In this section, we show that the fuzzy controller is stable (i.e., all internal variables of the controller and the Notes server will not go to infinity) and converges IBM SYSTEMS JOURNAL, VOL 41, NO 3, 2002
to the maximum profit at steady state. Due to space limitation we provide only an outline of the proof. We begin by summarizing the dynamics of the system. Let u(k) denote the offset value of MaxUsers in the k th interval (the meaning of “offset” will be explained later), and m(k) denote the expected change of MaxUsers as a result of the output of the fuzzy controller. Then, from the previous section, we know that u共k ⫹ 1兲 ⫽ u共k兲 ⫹ m共k兲
(3) DIAO, HELLERSTEIN, AND PAREKH
415
Figure 9
Behavior of a fuzzy controller for profit model P(1) and W=3
MAXUSERS
PROFIT (1): 3068.28
MEASURED RT QUEUELENGTH
PROFIT (3): − 21.54
200 100 0
COMPTRANS
PROFIT (2): 3703.48
1
1.5
2
2.5
3
3.5
4
4.5
5
5.5
6
1
1.5
2
2.5
3
3.5
4
4.5
5
5.5
6
01
1.5
2
2.5
3
3.5
4
4.5
5
5.5
6
1
1.5
2
2.5
3
3.5
4
4.5
5
5.5
6
1
1.5
2
2.5
3
3.5
4
4.5
5
5.5
6
1
1.5
2
2.5
3
3.5
4
4.5
5
5.5
6
1
1.5
2
2.5
3
3.5
4
4.5
5
5.5
6
200 100 0 20 10
200 100 0
P(1)
5 0 −5 P(2)
5 0 −5 P(3)
1 0 −1
TIME (HOUR)
y共k兲 ⫽ h共u共k兲兲
(4)
Equation 3 defines the relationship between MaxUsers and the change in MaxUsers. Equation 4 defines the profit model. For convenience of derivation, we assume that u(k) is the offset value of MaxUsers, that is, the difference between the measured MaxUsers and the equilibrium point (so that when u ⫽ 0, y ⫽ h(0) is the maximum profit). (Note that we use a similar offset concept as that in the section “Profit-based PI controller design,” but it is relative to the equilibrium point for maximum profit rather than the operating point for linearization. Also note that this equilibrium is only used for the pur416
DIAO, HELLERSTEIN, AND PAREKH
pose of analysis and its value is not unknown to the fuzzy controller.) There is no loss of generality in doing so because any nonzero equilibrium point can be transformed to the origin via a change of variables. With this assumption, we can determine the stability of the solution of the original system by studying the stability of the origin as an equilibrium point in the transformed system. In order to show the system convergence to the equilibrium point, we use the Lyapunov direct method. 26 Consider the following Lyapunov function candidate V共u共k兲兲 ⫽ u 2共k兲 IBM SYSTEMS JOURNAL, VOL 41, NO 3, 2002
Figure 10
Comparative behavior of the fuzzy controller and PI controller 5
P(1)
LOW+HIGH WL 5000
5000
4000
4000
4000
3000
3000
3000
2000
2000
2000
1000
1000 0
P(2)
HIGH WL
LOW WL
5000
10
1000 0
20
10
20
4600
4600
4600
4400
4400
4400
4200
4200
4200
4000
4000
4000
3800
3800
3800
3600
0
10
20
3600
0
10
20
3600
1000
1000
500
500
500
0
0
0
10
20
0
10
20
0
10
20
P(3)
1000
0
−500
0
10
20
−500
0
RT CONSTRAINT PI CONTROLLER 5
10 RT CONSTRAINT
RT CONSTRAINT
FUZZY CONTROLLER
which characterizes the distance of the MaxUsers from its optimal value (noting that we use a change of variables to move the optimal value for u 0 to 0). If we can show that its difference V共u共k ⫹ 1兲兲 ⫺ V共u共k兲兲 ⫽ u 2共k ⫹ 1兲 ⫺ u 2共k兲 ⫽ 关u共k兲 ⫹ m共k兲兴 2 ⫺ u 2共k兲 ⫽ m共k兲关2u共k兲 ⫹ m共k兲兴 is always negative, then MaxUsers will converge to the value that maximizes profit. IBM SYSTEMS JOURNAL, VOL 41, NO 3, 2002
−500
20
For convenience in notation, we define the previous adjustment of MaxUsers as du(k) ⫽ u(k) ⫺ u(k ⫺ 1). (Note that du(k) ⫽ m(k ⫺ 1).) Also, define the corresponding change of profit values as d y(k) ⫽ y(k) ⫺ y(k ⫺ 1). Thus, our fuzzy rules imply that 1. 2. 3. 4.
IF IF IF IF
du(k) du(k) du(k) du(k)
⬍ ⬍ ⬎ ⬎
0 0 0 0
AND AND AND AND
d y(k) d y(k) d y(k) d y(k)
⬍ ⬎ ⬍ ⬎
0 0 0 0
THEN THEN THEN THEN
m(k) m(k) m(k) m(k)
⬎ ⬍ ⬍ ⬎
0 0 0 0
Note that the above four relationships are represented by the numeric variables, which are different DIAO, HELLERSTEIN, AND PAREKH
417
from those four fuzzy rules characterized by linguistic variables. For example, for a specific numeric input pair du ⫽ 0.3 and d y ⫽ 0.4, all four rules will be activated but with different certainties (computed from the membership functions). They will give different weights to the consequents of each rule. Then, following center of gravity defuzzification, a crisp value can be obtained, which satisfies one of the above relationships (e.g., IF du ⫽ 0.3 ⬎ 0 and d y ⫽ 0.4 ⬎ 0 THEN m ⫽ 0.2731 ⬎ 0). These four relationships characterize certain properties of the nonlinear mapping that the fuzzy rules must observe in order to have a stable behavior. Besides this, the proper choice of membership functions and fuzzy rule set can improve the control performance, speed of convergence, and so on. Furthermore, the concave downward behavior of the profit model can be described as follows: IF IF IF IF
u共k兲 ⬍ 0 u共k兲 ⬍ 0 u共k兲 ⬎ 0 u共k兲 ⬎ 0
AND AND AND AND
du共k兲 ⬍ 0 du共k兲 ⬎ 0 du共k兲 ⬍ 0 du共k兲 ⬎ 0
THEN THEN THEN THEN
d y共k兲 ⬍ 0 d y共k兲 ⬎ 0 d y共k兲 ⬎ 0 d y共k兲 ⬍ 0
The above relationships can be consolidated into IF IF
u共k兲 ⬎ 0 u共k兲 ⬍ 0
THEN THEN
m共k兲 ⬍ 0 m共k兲 ⬎ 0
Furthermore, we introduce a constraint 兩m(k)兩 ⬍ 2兩u(k)兩 to restrict the nonlinear surface of the fuzzy controller. Thus, if u(k) ⬎ 0 we have m(k) ⬍ 0 and 2u(k) ⬎ ⫺m(k), so that V(u(k ⫹ 1)) ⫺ V(u(k)) ⬍ 0. Also, if u(k) ⬍ 0 we have m(k) ⬎ 0 and 2u(k) ⬍ ⫺m(k), so that V(u(k ⫹ 1)) ⫺ V(u(k)) ⬍ 0 as well. Therefore, u converges to its optimal value. Moreover, since 0 ⬍ a ⬍ 1, the system zero dynamics x(k ⫹ 1) ⫽ ax(k) are exponentially attractive as u ⫽ 0. Hence, x is also converging to its equilibrium point. Note that in the fuzzy controller we have introduced a constraint 兩m(k)兩 ⬍ 2兩u(k)兩. Since u(k) is obtained through a change of variable and u 0 is usually not known in advance, the value of u(k) may not be available. Instead, we use a fixed constraint 兩m(k)兩 ⬍ 2 ⑀ where ⑀ is a small positive constant. Thus, for 兩u(k)兩 ⬎ ⑀ , 兩m(k)兩 ⬍ 2 ⑀ leads to 兩m(k)兩 ⬍ 2兩u(k)兩. This implies that u(k) will converge asymptotically to an ⑀ neighborhood of the equilibrium point. Note that we do not claim to have an optimal trajectory as in 418
DIAO, HELLERSTEIN, AND PAREKH
optimal control, neither do we require any assumptions on the arrival and service distributions.
Conclusions The growing use of e-commerce is creating demand for SLAs with financial incentives in which service provider revenues are determined by the number of completed transactions and there are penalties for SLA violations (e.g., exceeding response time guarantees). Thus, situations are arising in which providers must make trade-offs between losing revenue (e.g., as a result of admission control that denies access to some customers) and incurring penalties (e.g., because admitted work cannot be completed within the SLA-dictated response time). Making such choices is skill-intensive and time-consuming, and the decisions must be made in real time. This motivates the use of profit-oriented feedback control. Unfortunately, the use of classical approaches, such as PI controllers, requires handcrafted construction for a specific workload and profit model. This is problematic since workloads change frequently in e-commerce environments, and profit models must often be adjusted as a result of SLA negotiations (which may be done automatically in Web service environments). Herein, we propose using fuzzy control to maximize profits and study this approach using detailed simulations of a Lotus Notes e-mail server in which the MaxUsers parameter is dynamically adjusted for admission control. We propose a feedback control system that directly optimizes profits and is robust to changes in workloads, the target system, and the underlying service level agreement (although the latter does need to be reflected in the feedback loop). A fuzzy controller is employed because of its simplicity and intuitiveness. In particular for Lotus Notes, we argue that profits are concave downward in MaxUsers. This is a consequence of: (1) how MaxUsers affects response times and throughputs and (2) how these metrics affect profits. Hence, for a given workload and profit model, there is a unique value of MaxUsers that maximizes profits. The foregoing suggests that hill climbing can be used to maximize profits at steady state. We construct a fuzzy controller to perform the hill climbing calculations, and our design separates the logic of hill climbing (as expressed in fuzzy rules) from the calculation of new values of MaxUsers (as represented by the membership functions). Such a separation is desirable in order to deal with stochastics that make IBM SYSTEMS JOURNAL, VOL 41, NO 3, 2002
profits quite “bumpy.” We prove that these rules converge to the maximum profit at steady state. Further, the fuzzy controller is unaffected by changes in workload and profit model. Our detailed studies reveal that the fuzzy controller has lower profits than a PI controller that is handcrafted for the specific workload and profit model. However, the fuzzy controller does at least as well as (and often much better than) the PI controller if we stray from the environment for which the PI controller is designed. This robustness, in combination with minimizing human intervention, may make the fuzzy controller economical to employ in practice. Two areas of future work are of particular interest. First, although we study Lotus Notes in this paper, the results obtained are almost certainly not specific to Notes. A seemingly easy generalization is to consider other systems with similar mechanisms for admission control, such as the MaxClients parameter in the Apache Web server. Further generalizations may be possible as well, for example, to aid SLA negotiation based on the availability of system service ability and user parameters. A second area of future work is the speed of convergence of the fuzzy controller. Our studies suggest that reducing convergence time of the fuzzy controller may improve its profits under dynamic workloads. The internal system measurements and their available historical data may be used to build the knowledge base and facilitate on-line learning and optimization. *Trademark or registered trademark of International Business Machines Corporation.
Cited references and notes 1. See, for example, http://www.ietf.org/rfc/rfc2474.txt and http://www.ietf.org/rfc/rfc2208.txt. 2. “What is a service level agreement (SLA),” Paradyne Corporation, available at http://www.paradyne.com/framesaverminisite/why-frame-relay.html. 3. Service Level Agreement, Telecommunications Infrastructure Fund Board, State of Texas, http://www.tifb.state.tx.us/ Handbooks/Service_Level_Agreement.html. 4. Local Area Network Infrastructure Maintenance, Service Level Agreement, University of Michigan Information Technology, http://www.itcom.itd.umich.edu/mainten/lan_ standard_sla.html. 5. Y. Diao, J. L. Hellerstein, and S. Parekh, “A Business-Oriented Approach to the Design of Feedback Loops for Performance Management,” Proceedings of the 12th International Workshop on Distributed Systems: Operations and Management, Nancy, France, October 2001, IEEE, New York (2001), pp. 11–22. 6. K. Ogata, Modern Control Engineering, 3rd Edition, Prentice Hall, Englewood Cliffs, NJ (1997).
IBM SYSTEMS JOURNAL, VOL 41, NO 3, 2002
7. D. Menasce, V. Almeida, R. Fonsece, and M. Mendes, “Business Oriented Resource Management Policies for E-commerce Servers,” Performance Evaluation 42, 223–239 (2000). 8. D. Menasce, D. Barbara, and R. Dodge, “Preserving QoS of E-commerce Sites Through Self-Tuning: A Performance Model Approach,” Proceedings of 2001 ACM Conference on E-commerce, Tampa, FL, October 2001, ACM, New York (2001), pp. 224 –234. 9. Z. Liu, M. S. Squillante, and J. L. Wolf, “On Maximizing Service-Level-Agreement Profits,” Proceedings of the ACM Conference on Electronic Commerce (EC’01), ACM, New York (2001), pp. 213–223. 10. S. Parekh, N. Gandhi, J. L. Hellerstein, D. M. Tilbury, and J. P. Bigus, “Using Control Theory to Achieve Service Level Objectives in Performance Management,” Proceedings of IEEE/IFIP Symposium on Integrated Network Management, IEEE, New York (2001), pp. 841– 854. 11. V. Misra, B. G. Wei, and D. Towsley, “Fluid Based Analysis of a Network of AQM Routers Supporting TCP Flows with an Application to RED,” Proceedings of the ACM SIGCOMM, ACM, New York (2000), pp. 151–160. 12. C. Lu, J. A. Stankovic, T. F. Abdelzaher, G. Tao, S. Son, and M. Marley, “Performance Specifications and Metrics for Adaptive Real Time Systems,” Proceedings of the 21st IEEE Real Time Systems Symposium, IEEE, New York (2000), pp. 13–24. 13. P. Fishburn and A. Odlyzko, “Dynamic Behavior of Differential Pricing and Quality of Service Options for the Internet,” Proceedings of the ACM First International Conference on Information and Computation Economics, ACM, New York (1998), pp. 128 –139. 14. B. Huberman and R. Lukose, “A Methodology for Managing Electronic Transactions over the Internet,” Proceedings of the Third International Conference on Computing in Economics and Finance, Stanford, CA, June 1997, Society for Computational Economics (1997), pp. 1–14. 15. K. M. Passino and S. Yurkovich, Fuzzy Control, Addison-Wesley Longman, Menlo Park, CA (1998). 16. K.-T. Sun, “Two-Dimensional Fuzzy Ranking Approach to Job Scheduling Problems,” Proceedings of IEEE International Conference on Fuzzy Systems, Piscataway, NJ, 1998, IEEE, New York (1998), pp. 873– 878. 17. M. Razaz, J. King, A. Rogers, and A. Duke, “Applications of Fuzzy Logic to Multimedia Technology,” Proceedings of the Second International ICSC Symposium on Fuzzy Logic and Applications (ISFL’97), ICSC Academic Press, Canada (1997), pp. 333–338. 18. Y. C. Chen, “Dealing with Fuzziness in Bank Credit Granting Analysis,” Proceedings of the 8th International Fuzzy Systems Association World Congress, Taipei, Taiwan, August 1999, International Fuzzy Systems Association (1999), pp. 1092– 1095. 19. K. Weber and Z. Sun, “Fuzzy Stochastic Dynamic Programming for Marketing Decision Support,” International Journal of Intelligent Systems 15, No. 8, 763–783 (2000). 20. R. Zhang and Y. A. Phillis, “Fuzzy Control of Arrivals to Tandem Queue with Two Stations,” IEEE Transactions on Fuzzy Systems 7, No. 3, 361–367 (1999). 21. Autonomic Computing: IBM’s Perspective on the State of Information Technology, IBM Research Division, http:// www.research.ibm.com/autonomic/manifesto/autonomic_ computing.pdf. 22. Y. Diao, J. L. Hellerstein, and S. Parekh, “Stochastic Modeling of Lotus Notes with a Queueing Model,” Proceedings
DIAO, HELLERSTEIN, AND PAREKH
419
23. 24.
25. 26.
of the CMG 2001 International Conference, Anaheim, CA, December 2001, Computer Measurement Group (2001). G. F. Franklin, J. D. Powell, and A. Emani-Naeini, Feedback Control of Dynamic Systems, Third Edition, Addison-Wesley Publishing Co., Reading, MA (1994). There are alternative ways to justify this assertion. One example is to employ the notion of “holding per customer per time unit in system” as in Reference 20, which means that costs increase as response times rise even if throughput is unchanged. For simplicity; other functions such as trapezoid or Gaussian may also be used. H. K. Khalil, Nonlinear Systems, MacMillan, New York (1996).
Accepted for publication April 18, 2002. Yixin Diao IBM Research Division, Thomas J. Watson Research Center, P.O. Box 704, Yorktown Heights, New York 10598 (electronic mail:
[email protected]). Dr. Diao is a postdoctoral Fellow at the Thomas J. Watson Research Center. He received his Ph.D. degree in electrical engineering from Ohio State University in 2000. He has conducted research on fault tolerant control system design using an adaptive fuzzy/neural approach, intelligent reasoning for robust fault diagnosis, and nonlinear dynamic system modeling with hierarchical learning structure and multivariate statistical methods. He joined IBM Research in 2001. His work involves increasing the adaptive and learning abilities of computing systems to unknown and time-varying environments by exploiting techniques from control theory, machine learning, and distributed agents. In particular, he is working with ABLE to develop generic adaptive agents for automated server tuning. Dr. Diao has authored around 20 technical papers, and his research interests include computer performance management, intelligent systems and control, adaptive systems, and stability analysis. Joseph L. Hellerstein IBM Research Division, Thomas J. Watson Research Center, P.O. Box 704, Yorktown Heights, New York 10598 (electronic mail:
[email protected]). Dr. Hellerstein manages the Systems Management Research Department with projects such as event mining, event prediction, intelligent probing, automated diagnosis, and generic adaptive control. He received his Ph.D. degree in computer science from the University of California at Los Angeles in 1984. He has taught at Columbia University and has published approximately 70 papers. Sujay Parekh IBM Research Division, Thomas J. Watson Research Center, P.O. Box 704, Yorktown Heights, New York 10598 (electronic mail:
[email protected]). Mr. Parekh is a research associate at the Thomas J. Watson Research Center. He received his B.S. degree in computer science and B.A. in mathematics at Cornell University in 1993, and his M.S. degree in computer science at the University of Washington in 1996. His research interests revolve around automating computing systems, both simple and complex, and his previous work has included projects in AI planning, machine learning, computer architecture, scheduling algorithms, and feedback-driven control.
420
DIAO, HELLERSTEIN, AND PAREKH
IBM SYSTEMS JOURNAL, VOL 41, NO 3, 2002