Hindawi Publishing Corporation e Scientific World Journal Volume 2014, Article ID 239793, 14 pages http://dx.doi.org/10.1155/2014/239793
Research Article Using Fuzzy Multiple Criteria Decision-Making Approach for Assessing the Risk of Railway Reconstruction Project in Taiwan Shih-Tong Lu,1,2 Shih-Heng Yu,2 and Dong-Shang Chang2 1 2
Graduate Institute of Project Management, Kainan University, No. 1 Kainan Road, Luchu, Taoyuan 33857, Taiwan Department of Business Administration, National Central University, No. 300 Jhongda Road, Jhongli, Taoyuan 32001, Taiwan
Correspondence should be addressed to Shih-Tong Lu;
[email protected] Received 25 November 2013; Accepted 20 January 2014; Published 18 March 2014 Academic Editors: A. K. Gupta and B. Kumar Copyright © 2014 Shih-Tong Lu et al. This is an open access article distributed under the Creative Commons Attribution License, which permits unrestricted use, distribution, and reproduction in any medium, provided the original work is properly cited. This study investigates the risk factors in railway reconstruction project through complete literature reviews on construction project risks and scrutinizing experiences and challenges of railway reconstructions in Taiwan. Based on the identified risk factors, an assessing framework based on the fuzzy multicriteria decision-making (fuzzy MCDM) approach to help construction agencies build awareness of the critical risk factors on the execution of railway reconstruction project, measure the impact and occurrence likelihood for these risk factors. Subjectivity, uncertainty and vagueness within the assessment process are dealt with using linguistic variables parameterized by trapezoid fuzzy numbers. By multiplying the degree of impact and the occurrence likelihood of risk factors, estimated severity values of each identified risk factor are determined. Based on the assessment results, the construction agencies were informed of what risks should be noticed and what they should do to avoid the risks. That is, it enables construction agencies of railway reconstruction to plan the appropriate risk responses/strategies to increase the opportunity of project success and effectiveness.
1. Introduction In the past few decades population densities rapidly increased, and the quality of living much improved in urban area because of blooming economy, which results in great demand on public transportation infrastructure services in urban and metropolitan areas. The developments of public transportation infrastructures in urban and metropolitan areas tended to be undergrounded or elevated because of the limit of land use. The underground and elevated transportation system could benefit from reducing traffic effects during construction period and significantly improve the traffic after completion. Moreover, the environmental pollutions are reduced, the city appearances and the quality of living are improved, and the land utilization and the level of economic activities were also enhanced. Therefore, Taiwan’s government plans to reconstruct the railway systems in underground or elevated structure for several urban areas in Taiwan in recent years, and the expected total budget amount of these developments reaches about NT$140 billion [1]. Currently, the railway reconstruction projects of Taiwan have been kickoff in several highly populated urban areas
and encountered tons of expected and unexpected challenges, because railway reconstruction projects are performed under a series of communication, coordination, and cooperation to integrate many works and arrange complicated interfaces in a limited working area. Therefore, carelessness during construction works or inadequate plan could lead to occurrences of accidents and cause great damage of lives, assets, environment, and the society [2]. Railway reconstruction work usually has the following challenges: (1) the limitations of available working areas, especially to the management of machineries, materials, personnel, and dynamic access; (2) remaining the normal operations of original railway system and maintaining safety at work areas; (3) managing fluent traffic flow nearby construction sites; (4) remaining the functions of the pipelines in or nearby construction sites through the temporary works of hoist, reroute, or transfer; (5) protecting nearby residential buildings and facilitating as well as managing safety of residents and pedestrians nearby job sites; (6) using customized equipment to perform works on the job areas with restricted spaces such as height limitations under existed bridges; (7) corresponding to current regulations of environment protection, noise, vibration, and air and
2 water pollutions [1]. These challenges represent a variety of risk factors in the railway reconstruction projects. In addition Datta and Mukherjee [3] mentioned that an underground railway project is highly complex and has many potential risks. Those potential risks frequently lead to great losses to the clients (i.e., the railway reconstruction agencies) and the general contractors. Therefore, the adoption of risk management strategy should be indispensable for the clients and general contractors. In other words, the risk associated with the railway reconstruction project can be reduced or even eliminated by the systematic process involving risk identification, risk assessment, analysis, and selection of appropriate risk management solutions. When risks and risk factors were identified, they can be effectively managed by reducing their occurrence probability or decreasing the associated effects of risk events. Risk assessment plays a core role to link identified risk factors and associated risk responses and is a very complicated and difficult work in the risk management process. Therefore, to improve the project success for railway reconstruction projects a scientific, easy operated risk assessment model should be developed to serve a basis to assist decision-making for clients and general contractors. Bellman and Zadeh [4] developed a novel method to improve decision-making in a fuzzy environment which provides a guideline to apply the fuzzy set theory [5] to investigating uncertain problems. Many past researches have implemented this approach to their multiple criteria studies, such as Kangari and Riggs [6], Paek et al. [7], Tah and Carr [8], Lu and Tzeng [9], Rebiasz [10], and Sadiq et al. [11]. However, risk assessment of a railway reconstruction project should consider several potential aspects, for example, economy trends driving the fluctuations of material and labor prices, finance problem influencing the project schedule and cost, operation gaps with project plan leading to project chaos and political interrupts leading to scope change, and so forth. Therefore, risk assessment for a railway reconstruction project is a multiple criteria problem. This study adopts Fuzzy MCDM which combines multiple criteria decision-making (MCDM) techniques and fuzzy set theory to help decision makers to assess the occurrence likelihood of risk factors and their impacts on project success for railway reconstruction projects. First, the study identified the potential risk factors in railway reconstruction project through literature reviews and further classified the identified factors. Secondly, a questionnaire with 7 scales of linguistic variables was developed to evaluate the degrees of impact and occurrence likelihood of identified risk factors by investigating experts on railway reconstruction field. Finally, the risk assessment model was suggested.
2. Risk Assessment Model Tah and Carr [12] describe the process of risk management including risk identification, risk assessment, risk control and monitoring, and feedback. The purpose of this study focuses on establishment of risk assessment model. In advance of model assessment, a hierarchical structure of risk factors should be investigated.
The Scientific World Journal 2.1. Constructing Hierarchical Structure of Risk Factors. Many literatures and technical reports associated with the identification and management of risks in construction projects were reviewed in this study. Chapman [13] defined the sources of risk which comprise environment, industry, clients, and project and identified 58 related risk factors. Tah and Carr [14] constructed a hierarchical structure of construction risk factors, classified into two categories: external risk and internal risk. Shen et al. [15] divided construction risk into 6 dimensions: financial, legal, management, market, policy, and political and technical. Faber and Stewart [16] pointed out the reasons of accidents in construction project including unsafely man-induced factors, unsafely physical factors, and unpredicted or force majeure. Baloi and Price [17] explored the influential factors of project cost performance as the risk factors of project, including estimator related, design related, level of competition related, fraudulent practices related, construction related, economic related, and political related. Ghosh and Jintanapakanont [18] classified the risk factors into 9 major types, including financial and economic risks, contractual and legal risks, subcontractors-related risks, operational risks, safety and social risks, design risks, force majeure ¨ ¸ and Okmen ¨ risks, physical risks, and delay risks. Oztas [19] identified 14 risk factors, which contained risks associated with changes in quality and scope of work, design changes, delays in design, third party delays and defaults, bureaucratic problems, exceptionally inclement weathers, owner delays, difficulties/delays in the availability of materials, equipment and labor, poor work quality and the needs for correction, unforeseen ground conditions, inflation, exchange rate fluctuations, accidents, and inadequate specifications. Bing et al. [20] explored 13 factors for construction project risk, including political and government policy, macroeconomic, legal, social, natural, project selection, project finance, residual risk, design, construction, operation, relationship, and the third ¨ ¸ and Okmen ¨ party levels. Oztas [21] classified construction project risks into risks associated with defective designs, design changes, subcontractors’ defaults, fluctuations in labor productivity, delays in resolving disputes, promoter delays, difficulties/delays in the availability of materials, equipment and labor, poor work quality and the needs for correction, changes in quantity, and the scope of work. Zou et al. [22] classified risks into cost-related risks, time-related risks, quality-related risks, environment-related risks, and safetyrelated risks. Lam et al. [23] suggested 5 risk dimensions for a project, that is, capability, contractual and legal, economic, physical and political, and societal. The risks associated with the capability dimension include designs by contractors, errors of subcontractors, operational quality, site safety, and approvals from authorities. The contractual and legal dimension includes conflicting documentation and third party delays. The economic risk dimension includes inflation and availability of labor and equipment. The physical dimension includes ground situations, access to sites, variations in number, and variations in weathers. The political and societal risk dimension includes alterations of regulations, disruption of public order, industrial disputes, and strikes. Zou et al. [24] classified construction project risk factors into clients-, designers-, contractors-, subcontractors/suppliers-,
The Scientific World Journal
3 Table 1: Related literatures for risk factors in construction project.
Chapman (2001) [13] Tah and Carr (2001) [14] Shen et al., (2001) [15] Faber and Stewart (2003) [16] Baloi and Price (2003) [17] Ghosh and Jintanapakanont (2004) [18] ¨ ¸ and Okmen ¨ Oztas (2004) [19] Bing et al., (2005) [20] ¨ ¸ and Okmen ¨ Oztas (2005) [21] Zou et al., (2006) [22] Lam et al., (2007) [23] Zou et al., (2007) [24] Dikmen et al., (2007) [25] Zayed et al., (2008) [26] Luu et al., (2009) [27] Mojtahedi et al., (2010) [28] Zavadskas et al., (2010) [29] Nieto-Morote and Ruz-Vila (2011) [30]
𝐹1 ✓ ✓ ✓
𝐹2 ✓ ✓ ✓
✓ ✓ ✓ ✓
✓ ✓ ✓ ✓ ✓
✓ ✓ ✓ ✓ ✓ ✓ ✓
✓ ✓ ✓ ✓
and government agencies-related risks and risks associated with external issues. Dikmen et al. [25] graphed project risks including construction risks, design risks, payment risks, client risks, subcontractor risks, and risks associated with contract clauses, wherein the construction risks include technical risks, managerial risks, resource risks, and productivity risks. Zayed et al. [26] identified four macrolevel risk areas: finance, political, culture, and market and seven microlevel risk areas: technology, contract and legal issues, resources, design, quality, construction, and others (weather, physical damage). Luu et al. [27] identified 16 factors through a questionnaire survey of 166 professionals to quantify the probability of construction project delays in a developing country. The sixteen factors were grouped into five categories that are materials, consultants, contractors, owners, and construction environment. Mojtahedi et al. [28] extend the concept of safety to risk identification and construct potential risk in gas refinery plant construction case study, including international relations, inflation, subcontractor interferences, and changes in rates of exchange. 30 risk factors. Zavadskas et al. [29] divided project risk into three groups: external risk, project risk, and internal risk. External risk includes political risk, economic risk, social risk, and weather risk. Project risk includes time risk, cost risk, work quality, construction risk, and technological risk. Internal risk includes resource risk, project member risk, construction site risk, documents and information risk, stakeholders’ risks, designers risk, contractor risk, subcontractor risk, and team risk. Nieto-Morote and Ruz-Vila [30] constructed a hierarchical structure of risks for rehabilitation project of a building including project management risks: lack of adequate process, lack of resources, inexperienced team members, and lack of motivation attitudes, engineering risks: design errors and design changes, execution risks: mistakes of construction, low productivity, lack of previous experiences, and accidents, and supplier risks: technical problems, delays in supply, and lack of quality.
𝐹3 ✓ ✓
✓ ✓ ✓ ✓ ✓ ✓ ✓ ✓ ✓ ✓ ✓ ✓
𝐹4 ✓ ✓ ✓ ✓ ✓ ✓ ✓ ✓ ✓ ✓ ✓ ✓ ✓ ✓ ✓ ✓ ✓ ✓
𝐹5 ✓ ✓ ✓ ✓ ✓ ✓ ✓
✓ ✓ ✓ ✓ ✓
𝐹6 ✓ ✓
𝐹7 ✓ ✓
✓ ✓ ✓ ✓ ✓ ✓ ✓ ✓ ✓ ✓ ✓ ✓ ✓ ✓ ✓
✓ ✓ ✓ ✓ ✓ ✓ ✓
✓ ✓ ✓ ✓
According to these literature reviews, this study summarizes sources of risk in construction project as 7 risk dimensions that could affect the project success. They are financial and economic risks (𝐹1 ), contractual and legal risks (𝐹2 ), subcontractors-related risk (𝐹3 ), operational and safety risks (𝐹4 ), political and social risks (𝐹5 ), design risk (𝐹6 ), and force majeure risk (𝐹7 ) as listed in Table 1. In addition, each of the risk dimensions is also divided into 4 to 6 factors for a railway reconstruction and the hierarchical structure of risk factors is shown in Figure 1. 2.2. Assessing the Railway Reconstruction Project Risk Using Fuzzy MCDM Approach. Multiple criteria decision-making (MCDM) was used to deal with the complexity and diversity of the analyses of multiple risk factors. However, it is unrealistic to assign a crisp value for a subjective judgment, especially when the information is vague or imprecise. Therefore, the analysis of this study was conducted by using the fuzzy MCDM approach that includes the implementation of fuzzy concept and MCDM approach. Fuzzy concept uses a range instead of a value to quantify the property of uncertainty and vagueness of risk factors. Furthermore, MCDM approach was used to determine the impact and possibility of risk factors. Fuzzy MCDM analysis has been widely applied to solving the problems with more than one attribute/factor having ambiguous measurement. This study measures degree of impact of risk factors and rating occurrence likelihood of occurrence of risk factors using an integrated measure of magnitude of unintentional events and impacts of events on project success [31]. Assuming the different project risk factors equally affect project success is impractical. To better manage project risks and increase chances of project success, degree of impact and occurrence likelihood of risk factors on project success should be carefully evaluated and further used as the fundamental information for the control, response, and management of project risks. That is, the varying effects
The Scientific World Journal
Risk factors of the railway reconstruction project
4
F1 financial and economic risk
F11 F12 F13 F14
interest rate of loan increasing funds unavailability of contractor materials price fluctuation wages and salaries increasing
F2 contractual and legal risk
F21 F22 F23 F24
delay in solving contractual issues of official matter delay in solving disputes delay payment on contract and extra delay in change order negotiation
F3 subcontractors-related risk
F31 F32 F33 F34
subcontractor lack of adequate experiences subcontractor lack of adequate number of workers poor coordination with subcontractors poor management of subcontractors
F4 operational and safety risk
F41 F42 F43 F44 F45 F46
incompatibility with original railway operations limitations of construction sites difficulties in relocation of originalpipelines incomplete construction equipments imperfect construction quality accidents and hazards
F5 political and social risk
F51 F52 F53 F54
political decisions or policies variations more requirement in pollution regulations occupational safety and health regulations change resident’s protests and disturbances
F6 design risk
F61 F62 F63 F64 F65
inadequate construction methods defective design documents conflict of construction interfaces inadequate construction specifications questionable construction site investigation
F7 force majeure risk
F71 F72 F73 F74
typhoon earthquake fire accident poor geological condition
Figure 1: Hierarchical structure of risk factors for the railway reconstruction project.
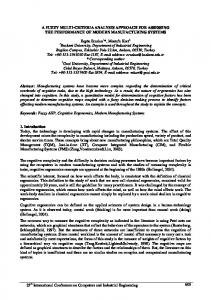
of project risk factors on project success provide valuable information needed to allocate railway reconstruction project resources. Some concepts and operations of fuzzy MCDM used in this study are briefly described as the following. 2.2.1. Fuzzy Number. Fuzzy numbers are a fuzzy subset of real numbers, representing the expansion of the idea of the confidence interval. Trapezoid fuzzy numbers (TFN) should possess the following basic features. ̃ be a trapezoid fuzzy number (TFN), and its member Let 𝐴 ship function 𝜇𝐴̃(𝑥) : 𝑋 → [0, 1] is equal to 0, { { { (𝑥 − 𝑎1 ) { { { { { (𝑎 − 𝑎 ) , 1 𝜇𝐴̃ (𝑥) = { 2 { { (𝑎4 − 𝑥) , { { { { { (𝑎4 − 𝑎3 ) {1,
𝑥 ≤ 𝑎1 or 𝑥 ≥ 𝑎4 , (1) 𝑎2 ≤ 𝑥 ≤ 𝑎3 .
Subtraction of fuzzy number: ̃ ⊝ 𝐵̃ = (𝑎1 , 𝑎2 , 𝑎3 , 𝑎4 ) ⊝ (𝑏1 , 𝑏2 , 𝑏3 , 𝑏4 ) 𝐴 = (𝑎1 − 𝑏4 , 𝑎2 − 𝑏3 , 𝑎3 − 𝑏2 , 𝑎4 − 𝑏1 ) .
𝑎1 ≤ 𝑥 ≤ 𝑎2 , 𝑎3 ≤ 𝑥 ≤ 𝑎4 ,
̃ = The trapezoid fuzzy number can be denoted by 𝐴 (𝑎1 , 𝑎2 , 𝑎3 , 𝑎4 ), where 𝑎1 ≤ 𝑎2 ≤ 𝑎3 ≤ 𝑎4 , respectively, and 𝑎1 ̃ (see Figure 2). and 𝑎4 are the lower and upper bounds of 𝐴 ̃ = (𝑎1 , 𝑎2 , 𝑎3 , 𝑎4 ) and The operational laws of two TFNs 𝐴 𝐵̃ = (𝑏1 , 𝑏2 , 𝑏3 , 𝑏4 ) are shown as below [32]. Addition of fuzzy number: ̃ ⊕ 𝐵̃ = (𝑎1 , 𝑎2 , 𝑎3 , 𝑎4 ) ⊕ (𝑏1 , 𝑏2 , 𝑏3 , 𝑏4 ) 𝐴 (2) = (𝑎1 + 𝑏1 , 𝑎2 + 𝑏2 , 𝑎3 + 𝑏3 , 𝑎4 + 𝑏4 ) .
Multiplication of fuzzy number: ̃ ⊗ 𝐵̃ = (𝑎1 , 𝑎2 , 𝑎3 , 𝑎4 ) ⊗ (𝑏1 , 𝑏2 , 𝑏3 , 𝑏4 ) 𝐴 = (𝑎1 × 𝑏1 , 𝑎2 × 𝑏2 , 𝑎3 × 𝑏3 , 𝑎4 × 𝑏4 ) .
(3)
(4)
The Scientific World Journal
5 ̃ A
1
AU
VU
0.1
0.2
U
A
S/L
VS/VL AS/AL
𝜇A ̃ (x)
𝜇A ̃ (x)
1
0
0
a1
a2
a3
0.3
0.4
0.5
0.6
0.7
0.8
0.9
1.0
x
a4
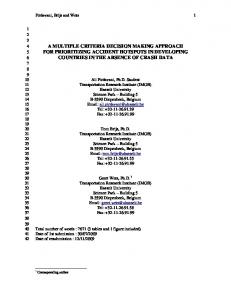
Figure 3: Membership functions of linguistics variables for measuring risk factors.
x
Figure 2: The membership function of the trapezoid fuzzy number. Table 3: Linguistic scales of occurrence likelihood. Table 2: Linguistic scales of degree of impact. Semantic scale Absolutely serious (AS) Very serious (VS) Serious (S) Average (A) Unserious (U) Very unserious (VU) Absolutely unserious (AU)
Corresponding TFNs (0.8, 0.9, 1.0, 1.0) (0.7, 0.8, 0.8, 0.9) (0.5, 0.6, 0.7, 0.8) (0.4, 0.5, 0.5, 0.6) (0.2, 0.3, 0.4, 0.5) (0.1, 0.2, 0.2, 0.3) (0.0, 0.0, 0.1, 0.2)
Semantic scale Absolutely likely (AL) Very likely (VL) Likely (L) Average (A) Unlikely (U) Very unlikely (VU) Absolutely unlikely (AU)
Corresponding TFNs (0.8, 0.9, 1.0, 1.0) (0.7, 0.8, 0.8, 0.9) (0.5, 0.6, 0.7, 0.8) (0.4, 0.5, 0.5, 0.6) (0.2, 0.3, 0.4, 0.5) (0.1, 0.2, 0.2, 0.3) (0.0, 0.0, 0.1, 0.2)
Note: this table is revised from [32] defined.
Note: this table is revised from [32] defined.
(𝐸𝑖 , 𝑖 = 1, 2, . . . , 𝑚) input their subjective judgments of the degree of impact for each risk factor by using the semantic variable listed in Table 2,
Division of fuzzy number: ̃ ⊘ 𝐵̃ = (𝑎1 , 𝑎2 , 𝑎3 , 𝑎4 ) ⊘ (𝑏1 , 𝑏2 , 𝑏3 , 𝑏4 ) 𝐴 = (𝑎1 ÷ 𝑏4 , 𝑎2 ÷ 𝑏3 , 𝑎3 ÷ 𝑏2 , 𝑎4 ÷ 𝑏1 ) .
(5) 𝐹1
Reciprocal of fuzzy number: ̃−1 = ( 1 , 1 , 1 , 1 ) . 𝐴 𝑎4 𝑎3 𝑎2 𝑎1
̃= 𝑋 (6)
2.2.2. Linguistic Variables. Zadeh [33] mentioned that it is difficult to have a logic expression in a fuzzy or vagueness environment by using a conventional quantifying approach. A linguistic variable is essentially the variable represented by a word or a sentence in human languages. This study employed the seven semantic scales to evaluate degree of impact for railway reconstruction projects and their corresponding trapezoid fuzzy numbers (TFNs) are listed in Table 2. Another seven semantic scales and their corresponding TFNs, listed in Table 3, are applied to measuring the occurrence likelihood for each risk factor in railway reconstruction projects. Figure 3 displays the Membership functions of linguistics variables for measuring risk factors. 2.2.3. Determining the Degree of Impact of Risk Factors. The ̃ for the degree of impact of each of the risk factors matrix 𝑋 (𝐹𝑗 , 𝑗 = 1, 2, . . . , 𝑛) was displayed as (7). The evaluators
𝐹2 𝐹3 .. .
𝐹𝑛
𝐸1 𝑥̃11 [ 1 [𝑥̃2 [ [ 1 [𝑥̃3 [ [ .. [.
𝐸2 𝐸3 ⋅ ⋅ ⋅ 𝐸𝑚 𝑥̃12 𝑥̃13 ⋅ ⋅ ⋅ 𝑥̃1𝑚 ] 𝑥̃22 𝑥̃23 ⋅ ⋅ ⋅ 𝑥̃2𝑚 ] ], ] 𝑥̃32 𝑥̃33 ⋅ ⋅ ⋅ 𝑥̃3𝑚 ] ] .. .. . ] . . d .. ] 1 2 3 𝑚 [𝑥̃𝑛 𝑥̃𝑛 𝑥̃𝑛 ⋅ ⋅ ⋅ 𝑥̃𝑛 ]
𝑖 = 1, 2, 3, . . . , 𝑚,
(7)
𝑗 = 1, 2, 3, . . . , 𝑛,
where 𝑚 denotes the number of evaluators, 𝑛 is the number 𝑖 𝑖 𝑖 𝑖 , 𝑎2𝑗 , 𝑎3𝑗 , 𝑎4𝑗 ) indicates the fuzzy of risk factors, and 𝑥̃𝑗𝑖 = (𝑎1𝑗 degree of impact assessed by the 𝑖th evaluator for the 𝑗th risk factor. Each of the evaluators independently performed his/her assessments based on his/her experience, intuition, and knowledge. An average score computation, displayed as (8), is then employed to synthesize the TFNs of 𝑚 evaluators, which ̃𝑗 for explored a synthesized fuzzy degree of impact value 𝑤 each of the risk factors, ̃𝑗 = 𝑤
1 𝑚 𝑖 [∑𝑥̃ ] , 𝑚 𝑖=1 𝑗
(8)
6
The Scientific World Journal Table 4: The evaluation results of degree of impact for risk factors by E1∼E11 .
𝐹11
𝐸1 S
𝐸2 S
𝐸3 VS
𝐸4 VS
𝐸5 A
𝐸6 A
𝐸7 A
𝐸8 U
𝐸9 S
𝐸10 A
𝐸11 U
𝐹12 𝐹13
A VS
AS VS
AS VS
AS VS
VS S
A VS
VS S
A S
VS AS
S S
S VS
𝐹14 𝐹21 𝐹22 𝐹23 𝐹24 𝐹31 𝐹32 𝐹33 𝐹34 𝐹41 𝐹42 𝐹43 𝐹44 𝐹45 𝐹46 𝐹51 𝐹52 𝐹53 𝐹54 𝐹61 𝐹62 𝐹63 𝐹64 𝐹65 𝐹71 𝐹72 𝐹73 𝐹74
VS A A A S VS A A S U A A A A A S VS VS S A A A A A A A U U
VS S A A A U U A A VS VS VS S VS S U A A S S S VS VS VS S VS A U
VS S S S S AS VS S VS VS A S VS AS VS A S S S AS VS VS VS AS AS AS AS AS
A S VS S AS AS S VS A AS S VS S AS S VS S U A VS S S A VS VS AS S S
A S S A A VS S VS VS VS S S VS VS VS S A A S VS S S S S S S VS S
S A U U A S S A A S S A S S S VS A A S S S A S S A A U A
A A A A S A A U A A S A A S VS S A A A S S A S A S VS S A
A VS S VS S AS VS VS AS AS VS S S AS AS AS S A VS S S A VS AS U AS S S
S A S A A A A A S A VS VS A A A VS S S AS S S A A A A A A S
U U U U A S A A A VS S S A A A S A A S A A A A S A S A S
A S S S VS S S A S VS A S S A S U S U S A A A A S A A A S
̃𝑗 = (𝑎1𝑗 , 𝑎2𝑗 , 𝑎3𝑗 , 𝑎4𝑗 ) represents the synthesized fuzzy where 𝑤 degree of impact of the 𝑗th risk factor. The synthesized results of the fuzzy risk assessment are still in fuzzy numbers format. Therefore, it is necessary to further conduct defuzzification approach to transfer fuzzy numbers to crisp numbers. By using centroid method [34], the aggregated trapezoid fuzzy numbers (̃ 𝑤𝑗 ) were then defuzzified to the best nonfuzzy performance (BNP) values (𝑤𝑗 ) as the centroid value of TFNs (̃ 𝑤𝑗 ), which is displayed and proofed as (9) 𝑎
𝑤𝑗 =
∫𝑎 4 𝑥 ⋅ 𝜇𝑤̃ (𝑥) 𝑑𝑥 1
𝑎2
× (∫
𝑎1
=
−1 𝑎3 𝑎4 (𝑥 − 𝑎1 ) (𝑎4 − 𝑥) 𝑑𝑥 + ∫ 1 𝑑𝑥 + ∫ 𝑑𝑥) (𝑎2 − 𝑎1 ) 𝑎2 𝑎3 (𝑎4 − 𝑎3 )
𝑎32 + 𝑎42 + 𝑎3 ⋅ 𝑎4 − 𝑎12 − 𝑎22 − 𝑎1 ⋅ 𝑎2 , 3 (𝑎3 + 𝑎4 − 𝑎1 − 𝑎2 ) (9)
where 𝑤𝑗 is the degree of impact of the 𝑗th risk factor in crisp numbers format. Finally, the normalized degree of impact of the 𝑗th risk factor was computed according to 𝑅𝑗 =
𝑤𝑗 , 𝑛 ∑𝑗=1 𝑤𝑗
𝑛
where ∑𝑅𝑗 = 1. 𝑗=1
(10)
𝑎
∫𝑎 4 𝜇𝑤̃ (𝑥) 𝑑𝑥 1
= (∫
𝑎2
𝑎1
𝑎3 𝑎4 𝑥 (𝑎 − 𝑥) 𝑥 (𝑥 − 𝑎1 ) 4 𝑑𝑥 + ∫ 𝑥 𝑑𝑥 + ∫ 𝑑𝑥) (𝑎2 − 𝑎1 ) 𝑎2 𝑎3 (𝑎4 − 𝑎3 )
2.2.4. Measuring the Occurrence Likelihood of Risk Factors. The same evaluators (𝐸𝑖 , 𝑖 = 1, 2, . . . , 𝑚) as assessing degree of impact are invited to input their subjective judgments for the occurrence likelihood of each risk factor (𝐹𝑗 , 𝑗 =
The Scientific World Journal
7
Railway reconstruction project related information Investigation and identification the related risk factors (by type or category in hierarchical structure)
Measuring the occurrence likelihood of risk factors
Determining the degree of impact of risk factors
Risk evaluation
Degree of risk = impact × occurrence likelihood
Risk ranking and risk map (likelihood and impact matrix)
Is the risk factor above high level risk?
No
Yes Planning and implementing of appropriate strategies or methods
Followup, monitoring, and controlling
Changes to processes, strategies, or management methods
No
Yes
Figure 4: The framework of risk analysis/management for railway reconstruction project.
1, 2, . . . , 𝑛) by employing the linguistic scales listed in Table 3. ̃ is defined as The decision matrix 𝑌 𝐸1 𝐸2 𝐸3 ⋅ ⋅ ⋅ 𝐸𝑚 𝐹1 𝑦̃11 𝑦̃12 𝑦̃13 ⋅ ⋅ ⋅ 𝑦̃1𝑚 [ 1 2 3 ] 𝐹2 [ 𝑦̃2 𝑦̃2 𝑦̃2 ⋅ ⋅ ⋅ 𝑦̃2𝑚 ] [ ], ̃= 𝑌 [ ] 𝐹3 [𝑦̃31 𝑦̃32 𝑦̃33 ⋅ ⋅ ⋅ 𝑦̃3𝑚 ] [ ] .. [ . . . . ] . [ .. .. .. d .. ] 𝐹𝑛 [𝑦̃1 𝑦̃2 𝑦̃3 ⋅ ⋅ ⋅ 𝑦̃𝑚 ] 𝑛 𝑛 𝑛 𝑛 𝑖 = 1, 2, 3, . . . , 𝑚,
𝑗 = 1, 2, 3, . . . , 𝑛, (11)
where 𝑚 denotes the number of evaluators, 𝑛 is the number 𝑖 𝑖 𝑖 𝑖 , 𝑎2𝑗 , 𝑎3𝑗 , 𝑎4𝑗 ) indicates the of risk factors, and 𝑦̃𝑗𝑖 = (𝑎1𝑗
occurrence likelihood of the 𝑗th risk factor assessed by 𝑖th evaluator. Then this study uses the average score computation as (12) to synthesize the TFNs of 𝑚 evaluators, which finally obtained a synthesized fuzzy likelihood value 𝑝̃𝑗 , 𝑝̃𝑗 =
1 𝑚 𝑖 [∑𝑦̃ ] , 𝑚 𝑖=1 𝑗
(12)
where 𝑝̃𝑗 = (𝑎1𝑗 , 𝑎2𝑗 , 𝑎3𝑗 , 𝑎4𝑗 ) represents the synthesized fuzzy likelihood regarding the 𝑗th risk factor. Similarly, the BNP value for the fuzzy number 𝑝̃𝑗 can also be yielded via 𝑃𝑗 =
𝑎32 + 𝑎42 + 𝑎3 ⋅ 𝑎4 − 𝑎12 − 𝑎22 − 𝑎1 ⋅ 𝑎2 , 3 (𝑎3 + 𝑎4 − 𝑎1 − 𝑎2 )
(13)
8
The Scientific World Journal Table 5: The evaluation results of degree of impact for risk factors by E12∼E23 .
𝐹11 𝐹12 𝐹13 𝐹14 𝐹21 𝐹22 𝐹23 𝐹24 𝐹31 𝐹32 𝐹33 𝐹34 𝐹41 𝐹42 𝐹43 𝐹44 𝐹45 𝐹46 𝐹51 𝐹52 𝐹53 𝐹54 𝐹61 𝐹62 𝐹63 𝐹64 𝐹65 𝐹71 𝐹72 𝐹73 𝐹74
𝐸12 A VS VS VS S S S S S VS VS S AS S S S AS VS AS AS S VS S S S S VS A S VS VS
𝐸13 A S VS U VS VS S VS VS VS S VS AS S VS S AS VS AS VS A VS AS VS VS AS AS AS A A VS
𝐸14 S AS VS A S VS A S VS S S VS VS VS S VS AS VS VS VS S VS VS S VS VS AS S VS S S
𝐸15 A A S S U A U U A S A A A S S U U S U U U A A U A U U A U A A
𝐸16 S S VS A S S A S S S S S A S S A A A S S A A S A S A A A S A A
𝐸17 A U VS A VS S S S A A A A A A A A A A S S S S S S S S S VS VS VS VS
where 𝑃𝑗 is the crisp occurrence likelihood of the 𝑗th risk factor. 2.2.5. Evaluating the Values of Degree of Risk. Once the degree of impacts and occurrence likelihood of risk factors are determined, the degree of impacts and the occurrence likelihood of each risk factor are multiplied and computed as (14) to investigate degree of risk for risk factors (𝐾𝑗 ): 𝐾𝑗 = 𝑅𝑗 × 𝑃𝑗 ,
(14)
where 𝑅𝑗 denotes the normalized degree of impact of the 𝑗th risk factor and 𝑃𝑗 represents the occurrence likelihood of the 𝑗th risk factors. 2.2.6. Proposed Risk Management Framework. This study mainly applies the fuzzy multiple criteria decision-making (Fuzzy MCDM) approach to assess the hierarchical structure of risk factors for the railway reconstruction project in Taiwan. The methodology mentioned above is to establish
𝐸18 S S S A VS S VS S S S S S S S S S VS VS S S A S VS S S S S A A A S
𝐸19 VS VS VS S A S S S A S S A U A AS U U A VU VU U VU A VU VU VU S S VU VU U
𝐸20 A AS S A S AS S VS S S VS S VS VS S S VS S VS S S VS AS A S VS AS S VS VS S
𝐸21 A S VS U A U VU A U S A VS VS S AS A S A VU AU VU VU U S AS VU S VU AU AU U
𝐸22 S U S A A A A A A A U A U S A U VU VU S S S S A A A A S VS VS VS A
𝐸23 S VS S S S VS S VS VS S S S VS S S S S VS S S S S S S VS VS VS S S S S
an analytical model for measuring the degree of impact and occurrence likelihood of identified risk factors and evaluating the prediction degree of risk for each identified risk factor. The proposed risk management framework as shown in Figure 4 has the following main steps: identify risk factors, develop risk factors hierarchical structure, develop conditions of the risk factors in terms of degree of impact and occurrence likelihood, synthesize the results across hierarchy to determine relative severity of the risk factors and their risk ranking, develop a risk matrix with likelihood of risk occurrence in one axis and impact in another axis, identify risk factors and their risk level for each risky activities, and develop risk responses/strategies for each risk factor.
3. Empirical Case In the empirical case of this study, 23 experts with many experiences on railway reconstruction field in Taiwan were invited to reflect their judgments on questionnaires designed to measure the degree of impact and occurrence likelihood
The Scientific World Journal
9
Table 6: The evaluation results of occurrence likelihood for risk factors by E1∼E11 . 𝐹11 𝐹12 𝐹13 𝐹14 𝐹21 𝐹22 𝐹23 𝐹24 𝐹31 𝐹32 𝐹33 𝐹34 𝐹41 𝐹42 𝐹43 𝐹44 𝐹45 𝐹46 𝐹51 𝐹52 𝐹53 𝐹54 𝐹61 𝐹62 𝐹63 𝐹64 𝐹65 𝐹71 𝐹72 𝐹73 𝐹74
𝐸1 VL L AL AL A L L L VL L L L A L A L A A L VL L L A L L L L L L A A
𝐸2 VL A VL L A A L L A A U A A A A A A L VU L U L A A A A L VL VL A A
𝐸3 L L L L VL L AL VL L A L A VL L L A VL AL A L L L VL VL VL VL L VL VL VL VL
𝐸4 A A AL A U VL VU A VL L A L VU A U VU A A L L L L A A A U U AL L A A
𝐸5 L L L A A L A A L L L L L VL VL L L L VL L L L L L L L L VL VL L L
for hierarchical structure of risk factors on railway reconstruction project. The 23 experts comprise 18 males and 5 females, in which 7 are 10–15 years experiences, 11 are 15–20 years experiences, and 5 are above 20 years experiences. 3.1. Degree of Impact Calculation of the Risk Factors. Seven major risk aspects, comprising 31 risk factors, are considered in this assessment case. Degree of impact for these 31 risk factors is obtained by a series of interviews with the 23 assessment representatives. The following is the computational process involved in deriving the degree of impact of risk factors using the Fuzzy MCDM approach. (1) These experts are asked to express their opinions regarding the degree of impact of each risk factor by using linguistic terms defined in Table 2. The evaluation results are listed in Tables 4 and 5. (2) In this stage, the linguistic variables are transferred into corresponding trapezoid fuzzy numbers. Since the judgments and experiences of these experts are
𝐸6 A L VL L A A L L A L A A L L L A A L L L L VL A A A A A L L A L
𝐸7 L A L L A L L L L A A A A A A A A L A L L A A A A A A L L A A
𝐸8 L L VL A A VL L L L VL VL VL L L L L A L A L L A L L L L A AL AL L A
𝐸9 L VL AL VL L VL A L L A L VL VL AL VL A A L VL VL VL AL L L A A L L L A L
𝐸10 A L VL L L L L L VL L L L VL VL VL L VL L AL VL L AL L L VL L L L L A A
𝐸11 L L VL A L L L VL L VL L L L L L L L L A A A L A A A A L VL A A VL
different, (8) is used to aggregate their subjective judgments toward the degree of impact of risk factors yielding the synthesized trapezoid fuzzy numbers for each risk factor listed in Table 8. (3) Defuzzify each aggregated trapezoid fuzzy number into a crisp value for ranking and further calculation. This study adopts the defuzzification method of centroid of the normal trapezoid fuzzy number [30] to derive the BNP values of degree of impact for risk factors. The trapezoid fuzzy numbers listed in Table 8 are defuzzified by using (9), and the results are shown in the third column of Table 8. (4) Equation (10) is used to normalize the degree of impact of risk factors for each risk aspect level. Table 8 also summarizes the normalized degree of impact and ranking of each risk factor assessed by the 23 evaluators. The results reveal that the five most significant risk factors are materials price fluctuation of financial and economic risk
10
The Scientific World Journal Table 7: The evaluation results of occurrence likelihood for risk factors by E12∼E23 .
𝐹11 𝐹12 𝐹13 𝐹14 𝐹21 𝐹22 𝐹23 𝐹24 𝐹31 𝐹32 𝐹33 𝐹34 𝐹41 𝐹42 𝐹43 𝐹44 𝐹45 𝐹46 𝐹51 𝐹52 𝐹53 𝐹54 𝐹61 𝐹62 𝐹63 𝐹64 𝐹65 𝐹71 𝐹72 𝐹73 𝐹74
𝐸12 L A VL VL A A A L A A A A AU VL L A U L L L A VL VU U U U A AL AL U A
𝐸13 AL VL AL VL L L A L VL A A VL L AL AL A L L AL AL A AL L VL VL A VL AL AL L VL
𝐸14 L L VL L A A U A VL L L VL A VL VL VL L VL VL VL VL L L VL VL VL L AL VL L L
𝐸15 A L VL VL U A U A A L A A A VL VL U U A U A A A L A A L A VL VL L A
𝐸16 VL VL VL L VL VL VL VL VL VL L L L L L L L L VL VL L L L L L L A VL VL L L
(𝐹13 ), questionable construction site investigation of design risk (𝐹65 ), funds unavailability of contractor of financial and economic risk (𝐹12 ), incompatibility with original railway operations of operational and safety risk (𝐹41 ), and difficulties in relocation of original pipelines of operational and safety risk (𝐹43 ). Meanwhile, the five least impact risk factors include occupational safety and health regulations change of political and social risk (𝐹53 ), delay payment on contract and extracontractual and legal risk (𝐹23 ), wages and salaries increasing of financial and economic risk (𝐹14 ), fire accident of force majeure risk (𝐹73 ), and interest rate of loan increasing of financial and economic risk (𝐹11 ). 3.2. Calculation of the Occurrence Likelihood Rating with respect to Each Risk Factor. The occurrence likelihood rating for railway reconstruction project with regard to each identified risk factor is calculated as follows. (1) To investigate and realize the actual circumstances of the project, the 23 experts are interviewed and asked to express the occurrence likelihood based on each
𝐸17 L A VL A L L L L L L L L L L L L L L L L L L L L VL VL A VL VL VL VL
𝐸18 L L L L L VL VL VL L L L L VL L VL L VL L L L L L L L L L L L L L L
𝐸19 VL VL VL L A L L L A L L A U A AL U U A VU VU U VU A VU VU VU L L VU VU U
𝐸20 L VL L L L VL L VL L VL VL L VL L VL VL L A A A A VL L L L L L L L A L
𝐸21 L A AL VU VU U U L L VL U L VL A AL L U VU U VU AU U U A VL U A VU AU AU U
𝐸22 L A VL L A A A A A A A A A L A A U A L L L L A A A A A L L L A
𝐸23 L L L L L L L L L L L L L L L L L L L L L L L L L L L L L L L
risk factor using linguistic variables shown in Table 3, and the results of the ratings are shown in Tables 6 and 7. (2) Since the cognition of each expert varies according to their subjective intuition or experiences, after converting the linguistic variables into corresponding trapezoid fuzzy numbers, this study uses (12) to synthesize their different expressions towards the possible rating of occurrence with respect to each risk factor, deriving the aggregated trapezoid fuzzy numbers listed in Table 9. (3) Also employing the method of centroid of the normal trapezoid fuzzy number to compute the BNP value of the fuzzy possible rating with respect to each risk factor, by using (13), the trapezoid fuzzy numbers are defuzzified into crisp values and the ranking can be found in Table 9. The results reveal that the five risk factors the most likelihood to occur are as follows: materials price fluctuation
The Scientific World Journal
11 Table 8: The degree of impact and its ranking for each risk factor.
𝐹1
Impact TFNs
Impact BNPs
Local weights
Local ranking
Global weights
Global ranking
𝐹11 𝐹12 𝐹13 𝐹14
(0.46, 0.56, 0.60, 0.70) (0.57, 0.67, 0.73, 0.81) (0.63, 0.73, 0.77, 0.87) (0.45, 0.55, 0.58, 0.68)
0.578 0.696 0.746 0.565
0.224 0.269 0.289 0.219
3 2 1 4
0.030 0.036 0.039 0.029
27 3 1 29
𝐹21 𝐹22 𝐹23 𝐹24
(0.48, 0.58, 0.63, 0.73) (0.49, 0.59, 0.65, 0.74) (0.43, 0.53, 0.58, 0.68) (0.50, 0.60, 0.66, 0.75)
0.604 0.616 0.552 0.629
0.252 0.257 0.230 0.262
3 2 4 1
0.031 0.032 0.029 0.033
19 17 30 13
𝐹31 𝐹32 𝐹33 𝐹34
(0.53, 0.63, 0.68, 0.77) (0.50, 0.60, 0.65, 0.75) (0.48, 0.58, 0.62, 0.72) (0.52, 0.62, 0.66, 0.75)
0.653 0.624 0.598 0.636
0.260 0.249 0.238 0.253
1 3 4 2
0.034 0.032 0.031 0.033
8 16 22 11
𝐹41 𝐹42 𝐹43 𝐹44 𝐹45 𝐹46
(0.57, 0.67, 0.71, 0.79) (0.52, 0.62, 0.68, 0.78) (0.54, 0.64, 0.70, 0.79) (0.46, 0.56, 0.61, 0.71) (0.54, 0.64, 0.70, 0.77) (0.53, 0.63, 0.67, 0.76)
0.684 0.650 0.667 0.585 0.662 0.649
0.176 0.167 0.171 0.150 0.170 0.166
1 4 2 6 3 5
0.035 0.034 0.034 0.030 0.034 0.034
4 9 5 26 6 10
𝐹51 𝐹52 𝐹53 𝐹54
(0.50, 0.60, 0.67, 0.76) (0.47, 0.56, 0.62, 0.72) (0.40, 0.50, 0.55, 0.65) (0.50, 0.60, 0.66, 0.75)
0.633 0.591 0.526 0.629
0.266 0.248 0.221 0.264
1 3 4 2
0.033 0.031 0.027 0.033
12 24 31 14
𝐹61 𝐹62 𝐹63 𝐹64 𝐹65
(0.53, 0.63, 0.69, 0.78) (0.46, 0.56, 0.62, 0.72) (0.50, 0.60, 0.63, 0.73) (0.49, 0.59, 0.62, 0.72) (0.57, 0.67, 0.73, 0.81)
0.659 0.591 0.616 0.603 0.696
0.208 0.187 0.195 0.191 0.220
2 5 3 4 1
0.034 0.031 0.032 0.031 0.036
7 25 18 20 2
𝐹71 𝐹72 𝐹73 𝐹74
(0.48, 0.58, 0.63, 0.72) (0.51, 0.61, 0.65, 0.74) (0.46, 0.55, 0.59, 0.69) (0.47, 0.57, 0.63, 0.73)
0.602 0.628 0.572 0.597
0.251 0.262 0.238 0.249
2 1 4 3
0.031 0.032 0.030 0.031
21 15 28 23
F2
F3
F4
F5
F6
𝐹7
of financial and economic risk (𝐹13 ), typhoon of force majeure risk (𝐹71 ), difficulties in relocation of original pipelines of operational and safety risk (𝐹43 ), earthquake of force majeure risk (𝐹72 ), and limitations of construction sites of operational and safety risk (𝐹42 ), meanwhile, the five risk factors more unlikelihood to occur are as follows: fire accident of force majeure risk (𝐹73 ), delay in solving contractual issues of official matter of contractual and legal risk (𝐹21 ), imperfect construction quality of operational and safety risk (𝐹45 ), incomplete construction equipment of operational and safety risk (𝐹44 ), and inadequate construction specifications of design risk (𝐹64 ).
3.3. Determining the Degree of Risk. After the degree of impact of identified risk factors and the possible rating of occurrence likelihood regarding each risk factor are calculated, use (14) and multiply the degree of impact and the occurrence likelihood with respect to each identified risk factor; the estimating degree of risk and ranking for each risk factor are derived as listed in the last two columns of Table 9. As we can find the most risky factor is materials price fluctuation (𝐹13 ), the second is difficulties in relocation of original pipelines (𝐹43 ), the third is funds unavailability of contractor (𝐹12 ), the fourth is limitations of construction sites
12
The Scientific World Journal Table 9: The occurrence likelihood and degree of risk for each risk factor.
𝐹1
Likelihood TFNs
Likelihood BNPs
Likelihood ranking
Degree of risk
Risk ranking
𝐹11 𝐹12
(0.53, 0.63, 0.70, 0.79) (0.51, 0.61, 0.66, 0.76)
0.662 0.637
6 10
0.020 0.023
17 3
𝐹13 𝐹14
(0.67, 0.77, 0.82, 0.90) (0.51, 0.61, 0.67, 0.76)
0.787 0.636
1 13
0.031 0.018
1 22
𝐹21 𝐹22
(0.43, 0.53, 0.57, 0.67) (0.51, 0.61, 0.66, 0.76)
0.552 0.637
30 11
0.017 0.020
27 14
𝐹23 𝐹24
(0.45, 0.55, 0.62, 0.71) (0.52, 0.62, 0.68, 0.78)
0.583 0.650
24 8
0.017 0.021
29 9
𝐹31 𝐹32
(0.53, 0.63, 0.67, 0.77) (0.51, 0.61, 0.66, 0.76)
0.650 0.637
9 12
0.022 0.020
6 15
𝐹33 𝐹34
(0.46, 0.56, 0.62, 0.72) (0.50, 0.60, 0.65, 0.75)
0.591 0.624
20 15
0.018 0.021
23 13
𝐹41 𝐹42 𝐹43
(0.47, 0.57, 0.61, 0.71) (0.55, 0.65, 0.70, 0.80) (0.57, 0.67, 0.72, 0.81)
0.593 0.673 0.692
19 5 3
0.021 0.023 0.024
11 4 2
𝐹44 𝐹45 𝐹46
(0.44, 0.54, 0.59, 0.69) (0.43, 0.53, 0.59, 0.69) (0.48, 0.58, 0.64, 0.74)
0.565 0.559 0.610
28 29 16
0.017 0.019 0.021
28 21 12
F2
F3
F4
F5 𝐹51
(0.48, 0.58, 0.63, 0.72)
0.602
18
0.020
16
𝐹52 𝐹53 𝐹54
(0.51, 0.61, 0.67, 0.76) (0.45, 0.54, 0.61, 0.71) (0.52, 0.62, 0.69, 0.78)
0.636 0.580 0.653
14 25 7
0.020 0.016 0.022
18 31 8
𝐹61
(0.44, 0.54, 0.60, 0.70)
0.572
26
0.019
19
𝐹62 𝐹63 𝐹64 𝐹65
(0.46, 0.56, 0.61, 0.71) (0.49, 0.59, 0.62, 0.72) (0.44, 0.54, 0.59, 0.69) (0.46, 0.56, 0.61, 0.71)
0.585 0.604 0.565 0.585
23 17 27 22
0.018 0.019 0.018 0.021
25 20 26 10
𝐹71
(0.61, 0.71, 0.77, 0.85)
0.735
2
0.023
5
𝐹72 𝐹73
(0.56, 0.65, 0.71, 0.80) (0.43, 0.52, 0.57, 0.67)
0.680 0.547
4 31
0.022 0.016
7 30
𝐹74
(0.47, 0.57, 0.61, 0.71)
0.591
21
0.018
24
F6
𝐹7
(𝐹42 ), and the fifth is typhoon (𝐹71 ). These results show the properties and situations of railway reconstruction in Taiwan. In addition, according to the BNP values of degree of impact of Table 8 and occurrence likelihood of Table 9, it can develop a likelihood and impact distribution diagram for visualizing the severity of the identified risk factors, as shown in Figure 5. The diagram also enables the related stakeholders of project to be aware which risk factors are important and their priorities.
4. Conclusions Generally speaking, more preparation in advance will be less loss on operation. Thus, this study offers a simple and systemic model to evaluate project risks for a railway reconstruction project in Taiwan. Based on the results investigated following the built model to perform the risk management or plan response strategies for construction projects. This model can benefit the stakeholders of railway
The Scientific World Journal
13
0.8 F13
Likelihood
0.75 F71
0.7 0.65
F11
F14
0.6 F53
F23
0.55 0.5 0.027
0.029
F22 F32
F52 F62
F44 F73
FF5 F72 54 F24
F33
F63 F64
F51
F34 F46
F31
F12 F41
F61
F65
F45
F21
0.031
F43
F42
0.033 Impact
0.035
0.037
0.039
Figure 5: Likelihood and impact distribution diagram.
reconstruction project to recognize what risk factors they face and to facilitate risk assessment and furthermore complete project risk management plan. The purpose of this study is to provide a scientific and simple applied framework for risk assessment for railway reconstruction projects, and based on the built framework a decision support system for project risk management could be further developed. This study proposes a multicriteria risk factor framework through complete literature review to quantify project risks. In the built model, fuzzy concept and proposed framework were employed to quantify the qualitative attributes with subjective judgments, including the degree of impact and occurrence likelihood of risk factors. This process enables decision makers to formalize the complicated, multicriteria, and fuzzy/vague perception problem of risk assessment for railway reconstruction projects. If an integrated decision support system is developed based on the built model, it will provide more benefits for project managers in making critical decisions for railway reconstruction projects.
Conflict of Interests The authors declare that there is no conflict of interests regarding the publication of this paper.
References [1] Railway Reconstruction Bureau, “Characteristic of railway reconstruction project,” 2009, http://www.rrb.gov.tw/05310 .aspx?id=21. [2] C. H. Hsiao and S. T. Cheng, “Research on the construction hazard & risk management of the railway reconstruction,” Chung Hua Journal of Architecture, vol. 2, no. 3, pp. 57–63, 2006. [3] S. Datta and S. K. Mukherjee, “Developing a risk management matrix for effective project planning—an empirical study,” Project Management Journal, vol. 32, no. 2, pp. 45–57, 2001. [4] B. R. Bellman and Z. L. Zadeh, “Decision making in a fuzzy environment,” Management Science, vol. 17, no. 4, pp. 141–164, 1970.
[5] L. A. Zadeh, “Fuzzy sets,” Information and Control, vol. 8, no. 3, pp. 338–353, 1965. [6] R. Kangari and L. S. Riggs, “Construction risk assessment by linguistics,” IEEE Transactions on Engineering Management, vol. 36, pp. 126–131, 1992. [7] J. H. Paek, Y. W. Lee, and J. H. Ock, “Pricing construction risks: fuzzy set application,” Journal of Construction Engineering and Management, vol. 119, no. 4, pp. 743–756, 1993. [8] J. H. M. Tah and V. Carr, “Information modeling for project risk analysis and management, engineering,” Construction and Architectural Management, vol. 17, no. 2, pp. 107–119, 2000. [9] S. T. Lu and G. H. Tzeng, “A decision support system for construction project risk assessment,” in Proceedings of the 2nd International Conference on Electronic Bussiness (ICE ’02), pp. 255–257, Grand Hotel, Taipei, Taiwan, 2000. [10] B. Rebiasz, “Fuzziness and randomness in investment project risk appraisal,” Computers and Operations Research, vol. 34, no. 1, pp. 199–210, 2007. [11] R. Sadiq, Y. Kleiner, and B. Rajani, “Water quality failures in distribution networks—risk analysis using fuzzy logic and evidential reasoning,” Risk Analysis, vol. 27, no. 5, pp. 1381–1394, 2007. [12] J. H. M. Tah and V. Carr, “Knowledge-based approach to construction project risk management,” Journal of Computing in Civil Engineering, vol. 15, no. 3, pp. 170–177, 2001. [13] R. J. Chapman, “The controlling influences on effective risk identification and assessment for construction design management,” International Journal of Project Management, vol. 19, no. 3, pp. 147–160, 2001. [14] J. H. M. Tah and V. Carr, “Towards a framework for project risk knowledge management in the construction supply chain,” Advances in Engineering Software, vol. 32, no. 10-11, pp. 835–846, 2001. [15] L. Y. Shen, G. W. C. Wu, and C. S. K. Ng, “Risk assessment for construction joint ventures in China,” Journal of Construction Engineering and Management, vol. 127, no. 1, pp. 76–81, 2001. [16] M. H. Faber and M. G. Stewart, “Risk assessment for civil engineering facilities: critical overview and discussion,” Reliability Engineering and System Safety, vol. 80, no. 2, pp. 173–184, 2003. [17] D. Baloi and A. D. F. Price, “Modelling global risk factors affecting construction cost performance,” International Journal of Project Management, vol. 21, no. 4, pp. 261–269, 2003.
14 [18] S. Ghosh and J. Jintanapakanont, “Identifying and assessing the critical risk factors in an underground rail project in Thailand: a factor analysis approach,” International Journal of Project Management, vol. 22, no. 8, pp. 633–643, 2004. ¨ ¸ and O. Okmen, ¨ [19] A. Oztas “Risk analysis in fixed-price designbuild construction projects,” Building and Environment, vol. 39, no. 2, pp. 229–237, 2004. [20] L. Bing, A. Akintoye, P. J. Edwards, and C. Hardcastle, “The allocation of risk in PPP/PFI construction projects in the UK,” International Journal of Project Management, vol. 23, no. 1, pp. 25–35, 2005. ¨ ¸ and O. Okmen, ¨ [21] A. Oztas “Judgmental risk analysis process development in construction projects,” Building and Environment, vol. 40, no. 9, pp. 1244–1254, 2005. [22] P. X. W. Zou, G. Zhang, and J. Y. Wang, “Identifying key risks in construction projects: life cycle and stakeholder perspectives,” in Proceeding of 12th Pacific Rim Real Estate Society Conference, Auckland, New Zealand, 2006. [23] K. C. Lam, D. Wang, P. T. K. Lee, and Y. T. Tsang, “Modelling risk allocation decision in construction contracts,” International Journal of Project Management, vol. 25, no. 5, pp. 485–493, 2007. [24] P. X. W. Zou, G. Zhang, and J. Wang, “Understanding the key risks in construction projects in China,” International Journal of Project Management, vol. 25, no. 6, pp. 601–614, 2007. [25] I. Dikmen, M. T. Birgonul, and S. Han, “Using fuzzy risk assessment to rate cost overrun risk in international construction projects,” International Journal of Project Management, vol. 25, no. 5, pp. 494–505, 2007. [26] T. Zayed, M. Amer, and J. Pan, “Assessing risk and uncertainty inherent in Chinese highway projects using AHP,” International Journal of Project Management, vol. 26, no. 4, pp. 408–419, 2008. [27] V. T. Luu, S.-Y. Kim, N. V. Tuan, and S. O. Ogunlana, “Quantifying schedule risk in construction projects using Bayesian belief networks,” International Journal of Project Management, vol. 27, no. 1, pp. 39–50, 2009. [28] S. M. H. Mojtahedi, S. M. Mousavi, and A. Makui, “Project risk identification and assessment simultaneously using multiattribute group decision making technique,” Safety Science, vol. 48, no. 4, pp. 499–507, 2010. [29] E. K. Zavadskas, Z. Turskis, and J. Tamoˇsaitiene, “Risk assessment of construction projects,” Journal of Civil Engineering and Management, vol. 16, no. 1, pp. 33–46, 2010. [30] A. Nieto-Morote and F. Ruz-Vila, “A fuzzy approach to construction project risk assessment,” International Journal of Project Management, vol. 29, no. 2, pp. 220–231, 2011. [31] H. Zhi, “Risk management for overseas construction projects,” International Journal of Project Management, vol. 13, no. 4, pp. 231–237, 1995. [32] S. J. Chen and C. L. Hwang, Fuzzy Multiple Attribute Decision Making, Methods and Applications, Springer, New York, NY, USA, 1992. [33] L. A. Zadeh, “The concept of a linguistic variable and its application to approximate reasoning-I,” Information Sciences, vol. 8, no. 3, pp. 199–249, 1975. [34] H.-M. Lee, S.-Y. Lee, T.-Y. Lee, and J.-J. Chen, “A new algorithm for applying fuzzy set theory to evaluate the rate of aggregative risk in software development,” Information Sciences, vol. 153, pp. 177–197, 2003.
The Scientific World Journal