Pirdavani, Brijs and Wets 1 2 3 4 5 6 7 8 9 10 11 12 13 14 15 16 17 18 19 20 21 22 23 24 25 26 27 28 29 30 31 32 33 34 35 36 37 38 39 40 41 42
1
A MULTIPLE CRITERIA DECISION MAKING APPROACH FOR PRIORITIZING ACCIDENT HOTSPOTS IN DEVELOPING COUNTRIES IN THE ABSENCE OF CRASH DATA
Ali Pirdavani, Ph.D. Student Transportation Research Institute (IMOB) Hasselt University Science Park – Building 5 B-3590 Diepenbeek, Belgium Email:
[email protected] Tel: +32-11-26.91.39 Fax: +32-11-26.91.99
Tom Brijs, Ph.D. Transportation Research Institute (IMOB) Hasselt University Science Park – Building 5 B-3590 Diepenbeek, Belgium Email:
[email protected] Tel: +32-11-26.91.55 Fax: +32-11-26.91.99 Geert Wets, Ph.D. 1 Transportation Research Institute (IMOB) Hasselt University Science Park – Building 5 B-3590 Diepenbeek, Belgium Email:
[email protected] Tel: +32-11-26.91.58 Fax: +32-11-26.91.99
Total number of words : 7671 (3 tables and 1 figure included) Date of 1st submission : 30/07/2009 Date of resubmission : 12/11/2009
1
Corresponding author
Pirdavani, Brijs and Wets 1 2 3 4 5 6 7 8 9 10 11 12 13 14 15 16 17
2
ABSTRACT In an efficient transportation system, traffic safety is an important issue and it is influenced by many factors. In a country like Iran, until now safety improvements are mainly concentrated on road engineering activities, without much attention for vehicle technology or driving behavior. One important aspect of road safety engineering activities is the so-called treatment of hotspots or dangerous accident locations. Until recently, accident hotspots were identified and remedied by the experts’ personal judgments and a hand-full of statistics without taking into account other important factors such as geometric and traffic conditions of the road network. This paper therefore aims to define and identify the criteria for accident hotspots, then giving a value to each criterion in order to develop a model to prioritize accident hotspots when traffic accident data is not available. To do this, the "Delphi" method has been adopted and a prioritization model is produced by the use of a "Multiple Criteria Decision Making" (MCDM) method. The procedure is illustrated on a collection of 20 road sections in Iran. In addition, the model is validated against an existing database of road sections containing safe locations and hotspots. Finally, a sensitivity analysis is carried out on the proposed method.
Pirdavani, Brijs and Wets 1 2 3 4 5 6 7 8 9 10 11 12 13 14 15 16 17 18 19 20 21 22 23 24 25 26 27 28 29 30 31 32 33 34 35 36 37 38 39 40 41 42 43 44 45 46 47 48 49 50
3
INTRODUCTION Because of Iran’s degree of urbanization, its extended country surface, long distances between main cities and its privileged location at the crossroad of international trade routes, transportation and mainly traffic safety is one of the most important challenges for Iranian road planners and the general public. For instance, in the past few years the number of vehicles including motorcycles has increased dramatically from 6,380,600 in 2000 to 14,174,400 in 2005 (an increase of 122%) whereas the total length of main and local roads in Iran has increased ‘only’ from 173,240 km in 2000 to 181,900 km in 2005 (an increase of 5%) (1). In other words, the rate of road infrastructure development has not kept up with the rate of motorization causing severe problems of congestion and road safety. With respect to road safety, the current situation in Iran is indeed among the worst worldwide. For instance, in 1995, around 10,000 road fatalities and more than 50,000 injuries were reported. Only 5 years later, more than 15,000 people died and more than 87,000 were injured in traffic accidents in Iran (2) and the problem is still getting worse. Whereas most western countries experienced a continuous decline in the number of road fatalities during the past decades, the number of road accident fatalities and injuries in Iran has reached to respectively 30,000 and 285,000 in 2006 (3). Given that the population of Iran was 66,360,000 in 2000 and around 70,000,000 in 2006 (4), the rate of road accident fatalities increased from 22.6 to 42.9 per 100,000 inhabitants. With respect to this tremendous rate of traffic accident fatalities, it is strongly needed to establish safety programs to improve the safety performance of the Iranian road network. A well-known road safety action program is the treatment of so-called hotspots or dangerous accident locations (5, 6, 7 and 8). In this paper we introduce a method for identifying and prioritizing accident hotspots in order to improve traffic safety in Iran. However, our approach will be different from traditional hotspot identification and ranking procedures, which typically depend on the availability of detailed, valid and reliable accident data. Furthermore, some researchers have argued in favor of using existing accident prediction models (APM) constructed in other regions of the world and transferring them to the local context (9). Although this looks like a promising alternative that needs more research attention in the future, it is far from clear to what extent APM’s constructed in developed countries can be easily transferred to countries where the traffic, road infrastructure and road accidents context is strongly different. Moreover, some authors have argued that the current recalibration procedures present in the traffic safety literature are incomplete and generally, it would seem worthwhile to carry out more research on traffic safety model transferability in order to compensate its lack of scientific basis (9 and10). Alternative methods are therefore required that can be used for safety assessment and prediction but which do not rely on traffic accident data such as International Road Assessment Program (iRAP) which is called Star Rating. Their proposed methodology is based on road inspection data and provides an objective measure of the level of safety. Star Ratings can be completed without reference to detailed crash data, which is often unavailable in low-income and middle-income countries (11). The approach presented in this paper therefore relies on a combination of qualitative (Delphi method) and quantitative methods (Multiple Criteria Decision Making (MCDM)) which do not depend on traffic accident data. More specifically, expert choice and decision making methods were surveyed and used to identify relevant indicators of accident occurrence, their relative importance and then a model was established to identify and prioritize accident hotspots for a collection of 20 road sections in Iran. The structure of the paper is as follows. Initially, we will elaborate on the adopted procedure of the Delphi method and the use of MCDM for prioritizing hotspots. For the purpose of illustration, the procedure is then applied to a collection of 20 road sections in
Pirdavani, Brijs and Wets 1 2 3 4 5 6 7 8 9 10 11 12 13 14 15 16 17 18 19 20 21 22 23 24 25 26 27 28 29 30 31 32 33 34 35 36 37 38 39 40 41 42 43 44 45 46
4
Iran. The procedure is validated against a database of road sections containing some known hotspots and safe sections. Finally, a sensitivity analysis is carried out on the proposed method.
METHODOLOGICAL DEVELOPMENT The Delphi Method and its Application in Road Safety Studies The Delphi technique is defined by Linstone and Turoff (12) as “a method for structuring a group communication process so that the process is effective in allowing a group of individuals, as a whole, to deal with a complex problem.” The objective of most Delphi applications is the reliable and creative exploration of ideas or the production of suitable information for decision making. The Delphi Method is based on a structured process for collecting and distilling knowledge from a group of experts by means of a series of questionnaires interspersed with controlled opinion feedback (12). Consequently Delphi (13) represents a useful communication device among a group of experts and thus facilitates the formation of a group judgment. This method is an exercise in group communication among a panel of geographically dispersed experts (12). The technique allows experts to deal systematically with a complex problem or task. The essence of the technique is fairly straightforward. It comprises a series of questionnaires sent either by mail or via computerized systems, to a pre-selected group of experts. These questionnaires are designed to elicit and develop individual responses to the problems posed and to enable the experts to refine their views as the group’s work progresses in accordance with the assigned task. The main point behind the Delphi method is to overcome the disadvantages of conventional committee action. According to Fowles (14) anonymity, controlled feedback, and statistical response characterize Delphi. The group interaction in Delphi is anonymous in the sense that comments, forecasts, and the like are not identified as to their originator but are presented to the group in such a way as to suppress any identification. In the original Delphi process, the key elements were (i) structuring of information flow, (ii) feedback to the participants, and (iii) anonymity for the participants. Clearly, these characteristics may offer distinct advantages over the conventional face-to-face conference as a communication tool. The Delphi method has been adopted previously in road safety research. For instance, in order to quantify the potential safety impacts of new in-vehicle technologies (15) and the prospective assessment of expected safety effects of new road transport informatics (16). A Delphi-type survey instrument was also used in (17) to gather expert knowledge on median safety issues that provided the impetus for field data collection in order to develop predictive models of cross-median collision crashes. In a similar study (18) a cultural consensus methodology was presented and applied to a set of median design and safety survey data that were collected using the Delphi method. To this end, a total of 21 Delphi survey participants were asked to answer research questions related to cross-median crashes. In another study (19), a Delphi study was undertaken to use expert judgment as a way of deriving a first approximation of safety thresholds, i.e. the point at which behavior can be considered unsafe. The aim of the study was to understand the relative weightings that are assigned to a number of driver behaviors and thereby to construct a Safety Index. Finally, in (20, 21 and 22) the Delphi method was proposed for several kinds of probabilistic safety assessments, including road safety.
Pirdavani, Brijs and Wets 1 2 3 4 5 6 7 8 9 10 11 12 13 14 15 16 17 18 19 20 21 22 23 24 25 26 27 28 29 30 31 32 33 34 35 36 37 38 39 40 41 42 43 44 45 46 47 48 49 50
5
Determining the Set and Importance of Decision Criteria The Delphi Method suggests 10 to 15 experts, but up to 100 expert opinions can be used for answering the questionnaires (23). This study includes the judgments of 40 experts whom were selected carefully according to their professional background. All the experts have several years of related experience in the field of traffic safety and all of them have been working in safety departments of the Iranian Ministry of Road and Transportation, the Tehran Municipality or as a university professor. Initially, a general explanation about the problem, the procedure and the purpose of this study was presented to all of the experts separately. They were told how to fill out the set of questionnaires and how to provide their opinions during the Delphi procedure. The Delphi procedure in this research mainly contains two phases to establish the basic structure of a predictive identification and prioritization model; (i) finding out the relevant criteria to identifying accident hotspots and (ii) to measure their importance. Determining Relevant Hotspot Criteria At this stage, the experts were offered a set of 7 hotspot related criteria and an explanation for each of them. These criteria correspond to the ones that have been used in classical traffic accident studies. At this stage, experts were asked to choose any criteria out of those 7 criteria and mention any other relevant criteria which they think are important and correlate to the purpose of this research. By analyzing the responses on the first questionnaire, 5 more criteria were mentioned by some experts and consequently added to the first set of criteria. Again, experts were required to choose the most important and relevant criteria out of the new set of 12 criteria. This is one of the advantages of the Delphi Method because it enables experts to improve and modify their opinions in each round with respect to feedback of other experts in the previous round. Having surveyed the experts’ opinions, the response to each criterion and a rank order of perceived importance for each criterion after the second round of survey is achieved. It is also shown that a strong agreement can be found on the first 5 criteria. This led us to continue our research only with these first 5 criteria. Below follows a short description of these 5 criteria: • Geometric conditions: This criterion contains curves, slope, width of road and other related parts of geometric characteristics of a road. • Physical conditions: This criterion contains pavement, drainage and other related parts of physical characteristics of a road. • Traffic conditions: This criterion is related to traffic characteristics of a road like traffic volume, traffic composition and traffic direction. • Specific locations: This criterion contains some special sections of a road, like roundabouts, tunnels, bridges, etc. The reason for using this criterion is that a speed related safety problem may occur when drivers are approaching these specific sections. The driving maneuver common to all of these situations is deceleration, and it becomes a problem when visual cues induce drivers to underestimate their speed and thus fail to decelerate to an appropriate speed (24). • Distance from population centers: In Iran a large amount of accidents occurs near cities, because of combination of more types of road users with different ranges of speed in addition to the fact that transitions between high speed roads and low speed roads are poorly designed, if not completely absent (25). In general the rural-urban threshold has consistently been identified as a speeding hotspot. Many motorists appear to find it difficult to slow down from open road speeds to a slower speed when entering an urban area. Commonly, the motorist is faced with a situation in which
Pirdavani, Brijs and Wets 1 2 3 4 5 6 7 8 9 10 11 12 13 14 15 16 17 18 19 20 21 22 23 24 25 26 27 28 29 30 31 32 33 34 35 36 37 38 39 40 41 42 43 44 45 46 47 48 49 50
6
they are required decelerate to a low level of speed after having traveled at a high level of speed for an extended period. In this situation, the motorist tends to underestimate the speed at which they are traveling and, as a result, they find themselves driving too fast (24). As a conclusion, sections which are located near population centers or rural-urban thresholds need special attention. According to some experts’ suggestions, some of these criteria are more common than the others and they need to be considered in more detail such as geometric, physical and traffic characteristics. So in this step of the procedure, the experts were asked to give their opinion on several sub-criteria for each of main criteria above. Using the same procedure as for the main criteria, the experts came up with the following set of sub-criteria for each main criterion: • Geometric conditions (A) Section located in sub-standard horizontal curve (A1) Section located in sub-standard vertical curve (A2) Section located in steep slope (A3) Section located in narrow width of road (A4) Poor visibility (A5) • Traffic conditions (B) Traffic volume (B1) Traffic composition (% of heavy vehicles) (B2) Traffic direction (one-way or two-way) (B3) • Physical conditions (C) Poor pavement conditions (C1) Poor drainage conditions (C2) Poor road marking conditions (C3) Poor road signing conditions (C4) • Specific locations (D) • Distance from population centers (E) Determining the Importance of the Selected Criteria After having identified all the relevant criteria, the main purpose is to determine the relative importance of each of the criteria and sub-criteria. Indeed, it is important to know the weight of each criterion and sub-criterion in order to make a quantitative comparison between the criteria to be used in establishing a predictive model. In literature, several approaches have been proposed to determine weights (26, 27 and 28). The majority of them can be classified into either subjective approaches or objective approaches depending on the information provided. The objective approaches determine weights based on objective information (i.e. a decision matrix) and these weights may be different from one decision matrix to another. In other words, weights which are calculated from two decision matrices with the same criteria but different alternatives will be different (not unique). The subjective approaches select weights based on preference information of criteria given by the Decision Makers (DM). Amongst others, they include the eigenvector method (29), the weighted least square method (30), and the Delphi method (28). This research follows a subjective approach because the purpose of this study is to make one unique weight vector to be used in a comprehensive prediction model. The most important advantage of this unique weight vector is that it can be used for each set of alternatives (sections of a road) to obtain valid results for identifying or prioritizing in the same situation. To do this, a pair-wise comparison matrix using a scale of relative importance should be constructed. More specifically, the fundamental scale of the analytic hierarchy process was
Pirdavani, Brijs and Wets
used (31). A criterion which is compared with itself, is always assigned the value 1, so the main diagonal entries of the pair-wise comparison matrix are all 1. The numbers 3, 5, 7, and 9 correspond to the verbal judgments “moderate importance”, “strong importance”, “very strong importance”, and “absolute importance” (with 2, 4, 6, and 8 for compromise between these values). At this stage, the experts are asked to fill out 4 pair-wise comparison matrices (with respect to the main criteria and the 3 sets of sub-criteria). We use the following notation: wi = weight for criterion i, i=1,.., n where n = number of criteria aij = wi / wj = the result of a pair-wise comparison between criterion i as compared to criterion j W = matrix of pair-wise comparison values, aij A set of pair-wise comparisons can thus be represented as Table 1. TABLE 1 Pair-wise Comparison between Criteria x1 x2 x3 … xn w1 w3 w2 w3 w3 w3
...
...
...
...
ai1 ai 2 ai 3 … 1
wi w1
wi w2
wi w3
x2
a 21 1 a 23 … a 2 j
x3
a 31 a32 1 … a3 j
xn
W= =
…
… …
w1 wj w2
wj w3 wj
...
...
...
w1 w2 w2 w2 w3 w2
1 a12 a13 … a1 j
...
w1 w1 w2 w1 w3 w1
x1
...
1 2 3 4 5 6 7 8 9 10 11 12 13 14 15 16 17 18 19 20 21 22 23 24 25 26 27 28 29 30 31 32 33 34 35 36 37 38 39 40 41 42 43 44 45 46 47 48 49 50
7
…
wi wj
Once pair-wise comparisons have been elicited from the experts’ decisions, the next step is to use these matrices to estimate the underlying scale of preferences. Several methods have been proposed in literature to estimate weights from matrices of pair-wise comparisons. The two most common methods for deriving criterion weights are the eigenvector and the logarithmic least squares methods (29). In fact, it can be shown by algebraic manipulations of the pair-wise definitions that criterion weights can be obtained by finding the eigenvector corresponding to the largest eigenvalue of the W matrix. The eigenvector method was originally proposed by Saaty (29) and is one of the most popular methods for calculating preferences from inconsistent matrices of pair-wise comparisons. Inconsistency occurs where the pair-wise comparison matrix does not satisfy transitivity for all pair-wise comparisons. Also Saaty’s method allows inconsistency, but provides a measure of the inconsistency in each set of judgments. The consistency of the judgmental matrix can be determined by a measure called the Consistency Ratio (CR). This measure depends on the number of criteria, the maximum eigenvalue of a pair-wise comparison matrix and a putative value which is called the “Random Index”. In general, a consistency ratio of 0.1 or less is considered acceptable; this threshold is 0.08 for matrices of size four and 0.05 for matrices of size three. If the value is higher, the judgments may not be reliable and should be elicited again (31). The CR calculated measures for the 4 matrices of this research are all in acceptable ranges. The special structure of a square reciprocal matrix means that the eigenvectors can be found and the largest eigenvector can be normalized to form a vector of relative weights (32). The weight vector is shown in Equation 1 which contains each criterion’s weight value. The normalized weight values for each criterion are shown in Table 2.
Pirdavani, Brijs and Wets
1 2 3 4
Weight vector = w t = {w1 , w2 ,..., wn }
(1)
TABLE 2 Normalized Weight Values for Each Criterion
criterion weight criterion weight criterion weight criterion weight 5 6 7 8 9 10 11 12 13 14 15 16 17 18 19 20 21 22 23 24 25 26 27 28 29 30 31 32 33 34 35
8
Normalized Weight Values for the Main criteria (A) (B) (C) (D) (E) 0.2465 (-) 0.2007 (-) 0.1989 (-) 0.1925 (0.1925) 0.1614 (0.1614) Normalized Weight Values for Geometric conditions (A1) (A2) (A3) (A4) (A5) 0.1914 0.1969 (0.0486) 0.1805 (0.0445) 0.1678 (0.0414) 0.2634 (0.0649) ( ) Normalized Weight Values for Traffic conditions (B1) (B2) (B3) 0.2916 (0.0585) 0.2998 (0.0602) 0.4086 (0.0820) Normalized Weight Values for Physical conditions (C1) (C2) (C3) (C4) 0.2193 (0.0436) 0.1818 (0.0362) 0.2641 (0.0525) 0.3348 (0.0666)
According to the assumptions with the structure of the prioritization model, each criterion and sub-criterion must be in the same level (26). In order to satisfy this condition, the weights of the sub-criteria must be multiplied by the weight of the corresponding main criterion, e.g. for poor visibility (A*A5=0.2465*0.2364=0.0649). As a result, the final weight vector contains 14 criteria weight’s values are expressed in Table 2 (Italicized values in parentheses). Establishing a Prioritization Model for Accident Hotspots Using MCDM
Once the final criteria weights are obtained, they can be applied in a multiple criteria decision context to rank a set of alternatives for which performance measures on the different criteria are known. More precisely, MCDM refers to making decisions in the presence of multiple, usually conflicting criteria. For this research, we have adopted the Technique for Order Preference Similarity to Ideal Solution (TOPSIS). The TOPSIS method was developed and improved by Hwang and Yoon (33) and has been used in several recent group decision making studies (34 and 35). This method is based on the concept that the chosen alternative should have the shortest Euclidean distance from the positive ideal solution whilst simultaneously being furthest away from the negative ideal solution. The ideal solution is a hypothetical solution for which all criterion values correspond to the maximum criterion values in the database comprising the satisfying solutions. The negative ideal solution is the hypothetical solution for which all criterion values correspond to the minimum criterion values in the database. TOPSIS thus gives a solution that is not only closest to the hypothetically best but that is also the furthest away from the hypothetically worst. The main procedure of the TOPSIS method for the selection of the best alternative from among those available is described below: Preparing a Decision Matrix In order to obtain the performance of a set of alternatives on a given set of criteria, a decision table or matrix is constructed consisting of (a) alternatives Ai (for i = 1, 2, … , n), (b) criteria
Pirdavani, Brijs and Wets 1 2 3 4 5 6 7 8 9 10 11 12
Bj (for j = 1, 2, … , m), and (c) measures of performance Mij (for i= 1, 2, …, n; j=1, 2, …, m) of the alternatives with respect to the criteria. Given the decision matrix information and a decision-making method, the task of the decision maker is to find the best alternative and/or to rank the entire set of alternatives (36). Normalizing the Decision Matrix It should be mentioned that all the elements in the decision matrix must be normalized to the same units, so that all possible criteria in the decision problem can be considered. Conversion of the decision making matrix to a dimensionless matrix is done by using Equation 2 (26 and 36). M ij N ij = (2) n
∑M i =1
13 14 15 16 17 18 19 20
28
29 30 31 32 33 34 35 36 37 38
2 ij
Obtaining the Weighted Normalized Decision Matrix
Now the weighted normalized decision matrix can be obtained by multiplying the normalized decision matrix Nij with the weight matrix Wj. Wj is a diagonal matrix such that all values are zero except for the major diagonal components which are the weight values of each criterion. Hence, the elements of the weighted normalized matrix Vij are expressed as: ⎡ v11 ... v1 j ⎢M M Vij = N ij . W j = ⎢ ⎢M M ⎢ ⎢⎣vn1 .... vnj
21
22 23 24 25 26 27
9
v1m ⎤ M ⎥⎥ M ⎥ ⎥ vnm ⎥⎦
(3)
Defining the Positive and Negative Ideal Solutions The positive ideal (best) and the negative ideal (worst) solutions can now be calculated from the weighted normalized decision matrix using Equation 4 and Equation 5(36).
Positive ideal solutions = V + =
{
= v1+ , v2+ ,..., v +j ,..., vm+
}
Negative ideal solutions = V − = =
{v
− 1
, v 2− ,..., v −j ,..., v m−
}
{ (max v
ij
{ (min v
ij
}
j ∈ J ) , (min vij j ∈ J ′) i = 1,2,..., n j ∈ J ) , (max vij j ∈ J ′)
(4)
}
i = 1,2,..., n
(5)
J and J ' stand for subsets of beneficial and non-beneficial criteria, respectively. vj+ indicates the positive ideal (best) value of the considered criterion among the values of the criterion for different alternatives. In the case of beneficial criteria (i.e., those for which higher values are desirable for the given application), vj+ indicates the higher value of the criterion. In the case of non-beneficial criteria (i.e., those for which lower values are desired for the given application), vj+ indicates the lower value of the criterion. vj- indicates the negative ideal (worst) value of the considered criterion among the values of the criterion for different alternatives. In the case of beneficial criteria (i.e., those of which higher values are desirable for the given application), vj- indicates the lower value of the criterion. In the case
Pirdavani, Brijs and Wets 1 2 3 4 5 6 7 8
9 10 11 12 13 14 15 16 17 18 19 20 21 22 23 24 25 26 27 28 29 30 31 32 33 34 35 36 37 38 39 40 41 42 43 44
10
of non-beneficial criteria (i.e., those of which lower values are desired for the given application), vj- indicates the higher value of the criterion (36). Obtaining the Separation Measures and the Relative Proximity Index (RPI) The separation of each alternative from the positive ideal and negative ideal solution is given by the Euclidean distance in the Equation 6 and Equation 7 (36): 0.5
⎧m 2⎫ si + = separation from positive ideal solution = ⎨∑ vij − v +j ⎬ , i = 1,2,..., n ⎩ j =1 ⎭
(
)
(6)
0. 5
⎧m 2⎫ s i − = separation from negative ideal solution = ⎨∑ vij − v −j ⎬ , i = 1,2,..., n (7) ⎩ j =1 ⎭ The relative closeness or proximity of a particular alternative to the ideal solution (also called the Relative Proximity Index), Pi, can then be expressed as Equation 8: si − Pi + = , 0 ≤ pi + ≤ 1 , i = 1,2,..., n (8) si − + si +
(
)
Prioritizing Alternatives According to this proximity value Pi, the set of alternatives can be ranked from the most preferred to the least preferred feasible solutions. Pi may also be called the overall or composite performance score of alternative Ai.
CASE STUDY In what follows, the above described procedure is applied and illustrated on a sample of 20 road sections between the two main cities of Tehran and Semnan in Iran. Firstly, a decision matrix for these 20 road sections was created based on field observations indicating the performance of each section on each of the given criteria. To be able to make a decision matrix for a set of road sections, it is needed to answer below questions and then fill out the database for each alternative (road section). Then it will be easily possible to fill out the decision matrix out of those databases. • (A)Geometric Conditions (A1) Section located in sub-standard horizontal curve? If yes put 1, if not 0. (A2) Section located in sub-standard vertical curve? If yes put 1, if not 0. (A3) Section located in steep slope? If yes put 1, if not 0. (A4) Section located in narrow width of road? If yes put 1, if not 0. (A5) Section located in a poor visibility condition? If yes put 1, if not 0. • (B)Traffic Conditions (B1) How much is the traffic volume, Average Annual Daily Traffic (AADT)? (B2) Ratio of heavy vehicles to all vehicles (%)? (B3) what about traffic direction? If one-way fill out 0, if two-way put 1. • (C)Physical Condition (C1) Section located in poor pavement conditions? If yes put 1, if not 0. (C2) Section located in poor drainage conditions? If yes put 1, if not 0. (C3) Section located in poor road Marking conditions? If yes put 1, if not 0. (C4) Section located in poor road Signing conditions? If yes put 1, if not 0. • (D) Section located in specific places? If yes put 1, if not 0.
Pirdavani, Brijs and Wets 1 2 3 4 5 6 7 8 9 10 11 12 13 14 15 16 17 18 19 20 21 22 23 24 25
11
•
(E) How much is the distance from population centers (Km)? Fill out with the “E” measure using Equation (9); where “d” represents the distance from population centers. 1 E= (9) 1+ 2* d Distribution of number of occurred traffic accidents against distance from population centers has the best correlation with Equation 9 (25). In this research the relation between number of accidents and different infrastructural criteria is experimented with respect to driver’s behavior and driving culture. The decision matrix is then normalized according to Equation 2 and weighted by multiplying it by the weight matrix defined in last section. Subsequently, the positive and negative ideal solution measures are calculated using Equation 4 and Equation 5. In accordance with the principals of the TOPSIS method, along with the purpose of this research which is prioritizing traffic accident hotspots, the positive ideal solutions signify the most dangerous situation and the negative ideal solutions imply the safest condition with respect to each criterion. Now the separation of each alternative from the positive ideal and negative ideal solution can be calculated along with the relative proximity to the ideal solutions according to the Equation 6, Equation 7 and Equation 8. These measures are show in columns 2-4 of Table 3. The priority of each road section for treatment can now be obtained by ranking the measures of relative proximity in descending order. In other words, the road section ranked first (i.e. with the highest measure of relative proximity) is the most dangerous section. The ranks are shown in column 5 of Table 3. TABLE 3 Separation from Positive and Negative Ideal Solutions and Relative Proximity
Section 1 2 3 4 5 6 7 8 9 10 11 12 13 14 15 16 17 18 19 20
Separation from positive ideal solution 0.0409 0.0714 0.0686 0.0516 0.0560 0.0732 0.0502 0.0703 0.0678 0.0720 0.0526 0.0449 0.0473 0.0671 0.0711 0.0719 0.0700 0.0736 0.0694 0.0603
Separation from negative ideal solution
Relative Proximity
Rank
0.0979 0.0422 0.0367 0.0762 0.1200 0.0268 0.0765 0.0735 0.0714 0.0299 0.0686 0.0833 0.0836 0.0407 0.0375 0.0493 0.0706 0.0491 0.0487 0.0382
0.7053 0.3718 0.3483 0.5962 0.6817 0.2681 0.6038 0.5113 0.5131 0.2932 0.5658 0.6497 0.6388 0.3777 0.3452 0.4068 0.5022 0.4001 0.4124 0.388
1 16 17 6 2 20 5 9 8 19 7 3 4 15 18 12 10 13 11 14
Pirdavani, Brijs and Wets 1 2 3 4 5 6 7 8 9 10 11 12 13 14 15 16 17 18 19 20 21 22 23 24 25
26 27 28 29 30 31 32 33 34
12
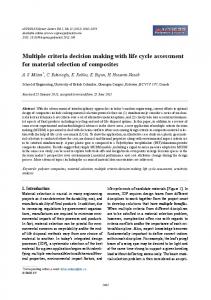
VALIDATION AND SENSITIVITY ANALYSIS Validation In order to validate the hotspot identification procedure presented in this paper, the results of the proposed procedure are correlated with a database containing 100 road sections in Iran. Forty four of the road sections in this database were identified as hotspots by the road administration in Iran according to a procedure based on an available historical crash data whilst the others were safe sections. The method used to identify different road sections as “accident hotspot” or “safe”, is known as the “Equivalent Property Damage Only Index (EPDO Index)”. This method is described in the “PIARC Road Safety Manual” (37). The EPDO index attaches a greater importance to more serious trauma by ascribing to each crash a weight that is a function of the worst level of injury sustained by one of the accident victims. Based on the average EPDO value of all locations in the reference population, a critical upper and lower value were determined and a validation data set was constructed with safe road sections (having an EPDO value below the lower critical value) and hotspots (having a EPDO value above the upper critical value). Subsequently, the RPI was calculated for each road section in the database based on the performance of each section on the decision criteria presented in this study. The measures for establishing this decision matrix were observed in the field and some of them, like traffic condition criteria, were derived from a present traffic database. Comparing the RPI values with known information about the safety of each section enables us to validate our approach and to identify a boundary of RPI values that discriminates safe from unsafe sections. Figure 1 shows the distribution of RPI values across safe and unsafe road sections in the database.
FIGURE 1 RPI values across safe and hazardous sections. Figure 1 clearly shows that RPI values are much higher (on average a value of 0.35) for hotspots than for safe road sections (on average a value of 0.17). This means that the prioritization model presented in this paper can be considered as a practical predictive identification model to identify hotspots when no or insufficient crash data are available. Furthermore, a Spearman’s rank correlation analysis was carried out on the validation data to investigate the strength of the correlation between the ranks produced by the RPI index and
Pirdavani, Brijs and Wets 1 2 3 4 5 6 7 8 9 10 11 12 13 14 15 16 17 18 19 20 21 22 23 24 25 26 27 28 29 30 31 32 33 34 35 36 37 38 39 40 41 42 43 44 45 46 47 48 49 50
13
crash risk (i.e. number of crashes divided by AADT per location). It turns out that this correlation equals 0.86 which indicates a strong correlation between the proposed RP Index and crash risk. As it was mentioned before, there is unfortunately no reliable comprehensive crash database system available in Iran which makes the identification of hotspots using classical crash data driven methods impossible. As long as such valid and reliable crash database does not exist, road engineers in Iran or any other developing country can rely on the approach presented in this paper to identify unsafe road sections.
Sensitivity Analysis In application of MCDM methods, the assessment of the data plays a crucial role. Indeed, the results obtained by application of a MCDM method are strongly related to the actual values assigned to these data. Since uncertainties may be present in the data, great care has to be taken when the results of such a method are interpreted. To facilitate this task, a number of methods have been proposed in literature, mainly focused on the assessment and influence of the weights on the ranking of the different alternatives (38 and 39). In this paper, sensitivity analysis was therefore performed in several ways. The first type of sensitivity analysis was carried out in order to find the most critical criterion. Triantaphyllou and Sanchez (40) proposed a method in which the notion of criticality is defined in terms of “smallest change” in any criterion’s weight value which will change the ranking of alternatives. Based on the data used in this paper, it turns out that criterion “B3” (section located in steep slope) is the most critical one. In fact, a change of 14% to this criterion’s weight will cause a change in the alternatives’ ranking (this percentage of change is the smallest for all 14 criteria). The second type of sensitivity analysis is carried out by removing each expert’s opinion in order to find out how sensitive the calculated weights of each criterion are to each expert’s opinion. In other words, all weights were recalculated after each of expert’s opinions was removed. The results show a very small value of standard deviation (less than 0.03) and a significant correlation regarding Spearman’s coefficient (more than 0.95) for all criteria’s recalculated weights, which means the weight values of all criteria are not very sensitive to one expert’s opinion. Finally, a third type of sensitivity analysis was carried out to study the effects of changing each criterion’s weight on the ranking of the different alternatives and their safety outcome (41, 42, 43 and 44). The biggest change would be achieved when a criterion is totally removed. Therefore, the computation of the RPI and prioritizing all alternatives has been carried out by increasing/decreasing each criterion’s weight and at last, totally removing the criterion. It turns out that no changes appear in the safety condition of any of the alternatives after removing each criterion. In other words, the condition of each road section as being safe or hotspot does not change after removing a criterion from the procedure. Furthermore, the results showed that the ranking of the different alternatives is quite robust when removing any of the criteria. To conclude, the sensitivity analysis shows that the model is very strong to changes in the data used in this study.
CONCLUSIONS The lack of reliable and valid traffic accident data puts a serious limitation on the use of classical crash prediction and hotspot identification methods in Iran. Yet, the road safety situation in Iran is so urgent that there is a need for alternative methods that can identify
Pirdavani, Brijs and Wets 1 2 3 4 5 6 7 8 9 10 11 12 13 14 15 16 17 18 19 20 21
14
hazardous road locations based on other kinds of data. In this paper, a Delphi combined with MCDM procedure was therefore developed to prioritize hotspots based on several criteria that were considered by experts as relevant for the problem, such as geometric characteristics, traffic conditions, physical conditions and location characteristics. More specifically expert opinions about relevant hotspot identification criteria and their relative importance were obtained from a Delphi experiment to construct a unique weight matrix. Subsequently, a MCDM procedure was adopted to prioritize road sections based on their performance on each of the selected criteria. One of the advantages of the MCDM method is its compensatory nature, i.e. its possibility of trade-offs between several decisions criteria. This means that the model will be more comprehensive with regard to using all relative criteria instead of using only a few of them. Furthermore, the proposed model is relatively simple and practical and a validation against a set of safe and unsafe road sections shows the potential of the presented approach for identifying hazardous locations although more extensive validation is probably required to corroborate the findings of this study. Obviously, this rather qualitative selection approach does not make classic hotspot identification methods based on historical accident data obsolete. In fact, once more and detailed crash statistics for individual road locations become available it is advisable to use statistical crash prediction and hotspot identification models since they rely on well-founded statistical, objective and data driven methodologies. However, until then, the procedure presented in this paper gives road engineers in Iran a practical safety audit tool which they can use in their systematic search for (potentially) dangerous accident locations.
Pirdavani, Brijs and Wets 1 2 3 4 5 6 7 8 9 10 11 12 13 14 15 16 17 18 19 20 21 22 23 24 25 26 27 28 29 30 31 32 33 34 35 36 37 38 39 40 41 42 43 44 45 46 47 48 49 50 51 52 53 54 55 56 57 58 59
15
REFERENCES (1)
(2) (3) (4) (5) (6)
(7) (8)
(9) (10)
(11) (12) (13) (14) (15) (16)
(17)
(18) (19) (20) (21)
(22) (23) (24) (25)
Zekavat, S. Road Safety - Government Policy, Expert Group Meeting on the Development of the Asian Highway Network: Regional Experiences and Lessons in Financial Highway Infrastructure and Improving Road Safety, 8-10 May, Bangkok, 2006. Montazeri, A. Road-traffic-related Mortality in Iran: a Descriptive Study. Journal of the Royal Institute of Public Health, 118(2), 2004, pp. 110-113. Iranian Police Statistics, Reported on http://www.bbc.co.uk/persian/iran/story/2008/04/080423_straffic-punishment.shtml Accessed 23.04.2008. Globalis an Interactive World Map (2008) UN common database, http://globalis.gvu.unu.edu/indicator_detail.cfm?Country=IRandIndicatorID=132 Cheng, W., and Washington, S.P. Experimental Evaluation of Hotspot Identification Methods. Accident Analysis and Prevention, 37(5), 2005, pp. 870-881. Brijs, T., Karlis, D., Van den Bossche, F., and Wets, G. A Model for Identifying and Ranking Dangerous Accident Locations: a Case-study in Flanders. Statistic Neerlandica, 60(4), 2006, pp. 457-476. Brijs, T., Karlis, D., Van den Bossche, F., and Wets, G. A Bayesian Model for Ranking Hazardous Road Sites. Journal of the Royal Statistical Society - Series A, 170, 2007, pp. 1-17. Elvik, R. Comparative Analysis of Techniques for Identifying Hazardous Road Locations, In Proceedings of the 87th Annual Meeting of the Transportation Research Board, CD-ROM, Washington D.C., 2008. Sawalha, Z. and Sayed, T. Transferability of Accident Prediction Models. Safety Science, 44, pp. 209-219. Turner, S., Persaud, B., Chou, M., Lyon, C., and Roozenburg, A. International Crash Experience Comparisons Using Prediction Models, In Proceedings of the 86th Annual Meeting of the Transportation Research Board, CD-ROM, Washington D.C., 2007. Star Rating Roads for Safety: The iRAP Methodology, iRAP504.04. International Road Assessment Program, Hampshire, UK, July 2009. Linstone, H. A., and Turoff, M. The Delphi Method: Techniques and Applications. Addison-Wesley Publishing Company (digital version), 2002. Helmer, O. Problems in Futures Research. Delphi and Causal Cross-impact Analysis, 1977, pp. 1731. Fowles, J. Handbook of Futures Research. Greenwood Press: Connecticut, 1978. Aittoniemi, E. Potential Safety Impacts of In-vehicle Information Service. VTT Technical Research Centre of Finland, 2005. Hydén, C. Theories on Traffic Safety Evaluation Connected to New Road Transport Informatics (RTI), Department of Traffic Planning and Engineering, Lund Institute of Technology, Lund, Sweden, 6th ICTCT workshop Salzburg, 1993. Donnell E.T., Harwood D.W., Bauer K.M., Mason J.M., and Pietrucha M.T. Cross-Median Collisions on Pennsylvania Interstates and Expressways. In Transportation Research Record: Journal of the Transportation research board, No. 1784, Transportation Research Board of the National Academies, Washington, D.C., 2002, pp. 91-99. Kim, T., Donnell E.T. and Lee, D. Use of Cultural Consensus Analysis to Evaluate Expert Feedback of Median Safety. Accident Analysis and Prevention, 40(4), 2008, pp. 1458-1467. Jamson, S., Wardman, M., Batley, R. and Carsten, O. Developing a Driving Safety Index Using a Delphi Stated Preference Experiment. Accident Analysis and Prevention, 40(2), 2008, pp. 435-442. Pulkkinen, U., and Holmberg, J. A Method for Using Expert Judgments in PSA. STUK-YTO-TR 129, 1997. Simola, K. and Virolainen, R. The STUK/VTT Expert Judgments Methodology and its Use in the Phase 2, Benchmark Exercise in Expert Judgments Techniques in PSA Level 2 (BE-EJT), 2000, pp. 205-208. Cojazzi, G. and Fogli, D. Benchmark Exercise on Expert Judgment Techniques in PSA Level 2, extended final report. European Commission, Joint Research Centre, EUR 19739 EN, 2000. Asgharpoor, M.J. Group Decision Making and Game Theory in Operation Research. Publication of Tehran University, 2003. Charlton, S.G., and O'Brien, T.G. Handbook of Human Factors Testing and Evaluation. Lawrence Erlbaum Associates Publishers, 2002. Golshan, R. Design a Model to Identify Safety Indicators for City Entrances. M.Sc. Dissertation, Iranian Science and Technology University, 2005.
Pirdavani, Brijs and Wets 1 2 3 4 5 6 7 8 9 10 11 12 13 14 15 16 17 18 19 20 21 22 23 24 25 26 27 28 29 30 31 32 33 34 35 36 37 38
(26) (27) (28) (29) (30)
(31) (32) (33) (34) (35) (36)
(37) (38) (39) (40) (41) (42) (43) (44)
16
Saaty, T.L. The Analytic Hierarchy Process. McGraw- Hill, New York, 1980. Hwang, C.L. and Yoon, K. Multiple Attribute Decision Making: Methods and Applications. Springer, Berlin, 1981. Hwang, C.L. and Lin, M.J. Group Decision Making under Multiple Criteria: Methods and Applications. Springer, Berlin, 1987. Saaty, T.L. A Scaling Method for Priorities in Hierarchical Structures. Journal of Mathematical Psychology, Vol. 15, 1977, pp. 234-281. Chu, A.T.W., Kalaba, R.E. and Spingarn, K. A Comparison of Two Methods for Determining the Weights of Belonging to Fuzzy Sets. Journal of Optimization Theory and Application, Vol. 27, 1979, pp. 531-538. Saaty, T.L. Fundamentals of Decision Making and Priority Theory with the AHP. RWS Publications, Pittsburg, 2000. Fichtner, J. On Deriving Priority Vectors from Matrices of Pair-wise Comparisons. Socio-Economic Planning Sciences, Vol. 20, 1986, pp. 341-345. Hwang, C.L. and Yoon, K. Multiple Attribute Decision Making: An Introduction. Sage, Thousand Oaks, CA, 1995. Lin, Y., Lee, P., Chang, T. and Ting, H. Multi-attribute Group Decision Making Model under the Condition of Uncertain Information. Automation in Construction, Vol. 17, 2008, pp. 792-797. Shih, H. Incremental Analysis for MCDM with an Application to Group TOPSIS. European Journal of Operational Research, Vol. 186, 2008, pp. 720-734. Venkata Rao, R. Decision Making in the Manufacturing Environment Using Graph Theory and Fuzzy Multiple Attribute Decision Making Methods. Springer Series in Advanced Manufacturing, 2007. PIARC Technical Committee on Road Safety (C13). PIARC Road Safety Manual, 2003. Wolters, W.T.M. and Mareschal, B. Novel types of sensitivity analysis for additive MCDM methods. European Journal of Operational Research, Vol. 81, 1995, pp. 281-290 Shi, Y., Olson, D.L. and Stam, A. Advances in Multiple Criteria Decision Making and Human Systems Management: Knowledge and Wisdom. IOS Press, Amsterdam, 2007. Triantaphyllou, E. and Sanchez, A. A Sensitivity Analysis Approach for Some Deterministic MultiCriteria Decision-Making Methods. Decision Sciences, 28(1), 1997, pp. 151-194. Braglia, M., Frosolini, M. and Montanari, R. Fuzzy TOPSIS Approach for Failure Mode, Effects and Criticality Analysis. Quality and Reliability Engineering International, Vol. 19, 2003, pp. 425-443. Opricovic, S. and Tzeng, G. Compromise solution by MCDM methods: A comparative analysis of VIKOR and TOPSIS. European Journal of Operational Research, Vol. 156, 2004, pp. 445-455. Ates, N.Y., Çevik, S., Kahraman, C., Gülbay, M. and Erdogan, S. A. Multi Attribute Performance Evaluation Using a Hierarchical Fuzzy TOPSIS Method. StudFuzz, Vol. 201, 2006, pp. 537-572. Onut, S. and Soner, S. Transshipment site selection using the AHP and TOPSIS approaches under fuzzy environment. Waste Management, Vol. 28, 2008, pp. 1552-1559.