Psychological Medicine (2013), 43, 2547–2562. © Cambridge University Press 2013 doi:10.1017/S003329171300024X
OR I G I N A L A R T I C L E
Using genetic, cognitive and multi-modal neuroimaging data to identify ultra-high-risk and first-episode psychosis at the individual level W. Pettersson-Yeo1*, S. Benetti1, A. F. Marquand2, F. Dell‘Acqua3,4, S. C. R. Williams2, P. Allen1, D. Prata1, P. McGuire1 and A. Mechelli1 1
Department of Psychosis Studies, King’s College London, Institute of Psychiatry, De Crespigny Park, London, UK Department of Neuroimaging, Centre for Neuroimaging Sciences, Institute of Psychiatry, King’s College London, De Crespigny Park, London, UK 3 Department of Forensic and Neurodevelopmental Science, King’s College London, Institute of Psychiatry, De Crespigny Park, London, UK 4 NIHR Biomedical Research Centre for Mental Health at South London and Maudsley NHS Foundation Trust and Institute of Psychiatry, King’s College London, London, UK 2
Background. Group-level results suggest that relative to healthy controls (HCs), ultra-high-risk (UHR) and first-episode psychosis (FEP) subjects show alterations in neuroanatomy, neurofunction and cognition that may be mediated genetically. It is unclear, however, whether these groups can be differentiated at single-subject level, for instance using the machine learning analysis support vector machine (SVM). Here, we used a multimodal approach to examine the ability of structural magnetic resonance imaging (sMRI), functional MRI (fMRI), diffusion tensor neuroimaging (DTI), genetic and cognitive data to differentiate between UHR, FEP and HC subjects at the single-subject level using SVM. Method. Three age- and gender-matched SVM paired comparison groups were created comprising 19, 19 and 15 subject pairs for FEP versus HC, UHR versus HC and FEP versus UHR, respectively. Genetic, sMRI, DTI, fMRI and cognitive data were obtained for each participant and the ability of each to discriminate subjects at the individual level in conjunction with SVM was tested. Results. Successful classification accuracies (p < 0.05) comprised FEP versus HC (genotype, 67.86%; DTI, 65.79%; fMRI, 65.79% and 68.42%; cognitive data, 73.69%), UHR versus HC (sMRI, 68.42%; DTI, 65.79%), and FEP versus UHR (sMRI, 76.67%; fMRI, 73.33%; cognitive data, 66.67%). Conclusions. The results suggest that FEP subjects are identifiable at the individual level using a range of biological and cognitive measures. Comparatively, only sMRI and DTI allowed discrimination of UHR from HC subjects. For the first time FEP and UHR subjects have been shown to be directly differentiable at the single-subject level using cognitive, sMRI and fMRI data. Preliminarily, the results support clinical development of SVM to help inform identification of FEP and UHR subjects, though future work is needed to provide enhanced levels of accuracy. Received 29 May 2012; Revised 15 January 2013; Accepted 16 January 2013; First published online 14 March 2013 Key words: Cognitive measures, first-episode psychosis, genetic information, magnetic resonance imaging, support vector machines, ultra-high-risk psychosis.
Introduction Considerable effort has been made over the last 30 years to identify biological and cognitive markers of schizophrenia. A large number of studies have reported significant differences in chronic schizophrenia (ChSz) patients relative to healthy controls (HCs) across a range of neurobiological and neurocognitive measures. These include structural magnetic resonance
* Address for correspondence: W. Pettersson-Yeo, Department of Psychosis Studies, PO Box 67, Institute of Psychiatry, King’s College London, De Crespigny Park, London SE5 8AF, UK. (Email:
[email protected])
imaging (sMRI), functional MRI (fMRI) and diffusion tensor MRI (DTI) (Ellison-Wright et al. 2008; EllisonWright & Bullmore, 2009; Minzenberg et al. 2009; Pettersson-Yeo et al. 2011), genotype (Ripke et al. 2011; Steinberg et al. 2011) and neuropsychological profile (Tyson et al. 2004; Minzenberg et al. 2009). More recently, efforts to facilitate earlier and more effective treatment intervention have resulted in studies focusing on those in the earliest stages of the illness, namely, individuals with first-episode psychosis (FEP) and those deemed to be at ultra-high risk (UHR). In these groups, similar neuroanatomical, neurofunctional and cognitive alterations (Bilder et al. 2000; Keefe et al. 2006; Wood et al. 2007; Walterfang
The online version of this article is published within an Open Access environment subject to the conditions of the Creative Commons Attribution-NonCommercial-ShareAlike licence . The written permission of Cambridge University Press must be obtained for commercial re-use.
2548 W. Pettersson-Yeo et al. et al. 2008; Benetti et al. 2009; Crossley et al. 2009; Allen et al. 2010, 2011; Koutsouleris et al. 2010; Seidman et al. 2010; Mechelli et al. 2011; Fusar-Poli et al. 2012) that may be mediated genetically (Fusar-Poli et al. 2012) have also been reported, though such alterations are usually less severe than those seen in ChSz groups (Egerton et al. 2011). The majority of studies, however, have largely employed univariate analyses that allow inference at the group level only. Therefore, to promote the clinical translation of such work, efforts have progressively turned toward alternative analytical approaches that allow inference at the level of the individual. One such technique is the supervised learning method support vector machine (SVM). A type of multivariate pattern recognition algorithm, SVM has become increasingly used in studies of psychiatric and neurological disorder (Orrù et al. 2012), the rationale for which is twofold: first, SVM allows inference at the single-subject, rather than group, level (Lao et al. 2004; Norman et al. 2006); second, as a multivariate analysis, SVM is able to account for the inter-relationship between different within-modality measures for each subject by considering them simultaneously. Specifically, SVM involves the development of a generalized decision function [represented by an optimal separating hyperplane (OSH)] using a known ‘training’ dataset (e.g. voxel intensities), able to discriminate between examples (i.e. subjects) belonging to two predefined classes (e.g. diagnostic categories). This function is then applied to new, as yet unseen ‘test’ data, and its accuracy assessed in terms of the proportion of examples correctly classified providing an estimate of how well the classifier can be expected to generalize to future individual cases (Pereira et al. 2009). At present, only a handful of studies have used SVM to investigate psychosis, with those that have predominantly employing data from only a single modality. Studies using sMRI, for example, report that ChSz patients can be significantly discriminated from HCs with accuracies of 81.1% (Davatzikos et al. 2005) and 86.1% (Sun et al. 2009), and UHR subjects from HCs with an accuracy of 82% (Koutsouleris et al. 2009a). DTI has also been used by one study which reported that ChSz patients can be discriminated from HCs with 90.62% accuracy based on white matter (WM) integrity (Ingalhalikar et al. 2010). In addition two studies using fMRI data reported the ability to discriminate ChSz patients from HCs with accuracies of 92.4% (Costafreda et al. 2011) and 81.6% (Yang et al. 2010), respectively. By contrast, only one study has applied SVM to genotype data in the context of psychosis, and reported that genetic information could accurately discriminate ChSz subjects from HCs with 73.9% accuracy (Yang et al. 2010). Lastly,
cognitive profile has also been employed by one recent study which reported that UHR subjects were discriminable from HCs with 94.2% accuracy (Koutsouleris et al. 2011). Taken together, these studies support the notion that the individual use of different modalities, each in conjunction with SVM, may allow discrimination between those at different stages of the psychosis time-course at the single-subject level. However, as no investigation has yet gathered data from such a wide range of modalities during the same study, the relative accuracies of genetic, DTI, sMRI, fMRI and neuropsychological data within the same population(s) are unknown. Furthermore, since the majority of work so far has applied predominantly to those with ChSz, it is less clear whether these same metrics can be reliably utilized to draw inference at the individual level for FEP and UHR subjects, differentiating them either from HCs, or, for the first time at cross-sectional level, from each other. In the current study, therefore, we aimed to investigate the discriminative potential of genetic, sMRI, fMRI, DTI and/or cognitive data in the classification of FEP, UHR and HC subjects at the individual level. Based on the evidence currently available, our hypotheses were threefold. (1) FEP subjects would be discriminable from HCs across the largest range of modalities, since at the group level greater magnitudes of difference have been reported in FEP over UHR subjects relative to HCs (Bilder et al. 2000; Eastvold et al. 2007; Fusar-Poli et al. 2009, 2012; de Mello Ayres et al. 2010; Smieskova et al. 2010). (2) In comparison with FEP subjects, UHR subjects would be differentiable from HCs by fewer modalities, with sMRI, DTI, fMRI and cognitive data being the most sensitive measures, in correspondence with previous group-level results (Pflueger et al. 2007; Benetti et al. 2009; Crossley et al. 2009; Koutsouleris et al. 2009b). (3) We would be able to directly discriminate FEP from UHR subjects, with sMRI and cognitive data being the most able to differentiate the two groups (Riecher-Rössler et al. 2009; Mechelli et al. 2011). Method A brief description of the materials and methods is provided in this section. For further methodological details, please see Supplement 1. Subjects FEP A total of 19 subjects were recruited through the South London and Maudsley National Health Service Trust (http://www.slam.nhs.uk). All had experienced a FEP within the past 24 months that met Diagnostic and
Biological and cognitive measures to identify psychosis at the individual level 2549 Statistical Manual of Mental Disorders, Fourth Edition (DSM-IV) criteria for a schizophreniform psychosis. At-risk mental state A total of 19 subjects were recruited from Outreach and Support in Southeast London (OASIS), a clinical service for young people at high risk of developing psychosis (Broome et al. 2005). Their clinical status was defined according to the Personal Assessment and Crisis Evaluation (PACE) criteria (Yung et al. 1998) and their diagnosis confirmed using the Comprehensive Assessment of At-Risk Mental States (CAARMS; Yung et al. 2005). In brief, individuals are classed as being UHR based on the presence of (1) attenuated psychotic symptoms, (2) brief limited intermittent psychotic symptoms, or (3) trait and state risk factors (e.g. individual has a schizotypal personality disorder or a first-degree relative with a DSM-IV psychiatric disorder combined with a significant decline in cognitive and social functioning over the past year). For FEP and UHR subjects, psychopathology was measured on the day of scanning using the Positive and Negative Syndrome Scale (PANSS; Kay et al. 1987). HCs A total of 23 subjects were recruited from the local area through advertising. No subjects met criteria for a DSM-IV psychiatric disorder, fulfilled the PACE criteria for prodromal symptoms or had a first-degree family history of psychiatric disorder. All subjects included in the study were aged 18–35 years and spoke English as their first language. Exclusion criteria included a history of neurological disorder, DSM-IV criteria for substance misuse disorder, or prior head trauma resulting in loss of consciousness and/or hospitalization (Table 1). Data acquisition MRI All neuroimaging was conducted using a 3-T MRI scanner (Sigma LX-GE, USA) at the Maudsley Hospital, London. For sMRI-derived grey matter (GM) images, T1-weighted scans were obtained with a volumetric three-dimensional Spoiled Gradient Recall sequence [repetition time (TR) = 7.044 ms, echo time (TE) = 2.82 ms, flip angle = 20°, slice thickness = 1.1 mm, in-plane resolution = 1.09 × 1.09 mm, field of view (FOV) = 21 cm2, matrix = 256 × 256] producing 196 coronal slices. For DTI-derived fractional anisotropy (FA) maps, volumes were acquired using a multi-slice peripherally-gated doubly refocused spin-echo echo planar imaging (EPI) sequence, optimized for precise measurement of the diffusion tensor in parenchyma,
from 60 contiguous near-axial slice locations with a TE = 104.5 ms, flip angle = 90°, slice thickness = 2.4 mm, FOV = 30.7 cm2 and matrix = 128 × 128. The maximum diffusion was 1300 s/mm2 and four images were acquired at slice locations with no diffusion gradients, alongside 32 diffusion-weighted images in which gradient directions were uniformly distributed in space. Functional images were acquired using a TR = 2000 ms, TE = 30 ms, flip angle = 70°, slice thickness = 3 mm, FOV = 24 cm2 and matrix = 64 × 64 producing 38 axial slices in parallel to the AC-PC (anterior commissure–posterior commissure) line. During the acquisition of functional images, subjects performed the Hayling sentence completion task (HSCT) using an experimental protocol described elsewhere (Allen et al. 2008). In brief, subjects were visually presented for 4 s with a five-, six- or seven-word sentence-stem with the last word omitted. Presentation of a question mark then required them to overtly generate a word either congruent (initiation condition) or incongruent (suppression condition) with the preceding sentence. The task was arranged into eight blocks of five sentence-stems, with each block separated by a baseline condition whereby the subject was shown a visual fixation-cross for 4 s, followed by the word ‘REST’ for 4 s which they had to read overtly. Overall, one initiation session and one suppression session were run separately, generating 600 image volumes in total. Molecular genetics Saliva samples were obtained from each subject using the Oragene® DNA collection kit (DNA Genotek Inc., Canada), preceded by 30 min of nil by mouth. Neuropsychology Designed to quantify different components of verbal learning, retention and retrieval (Delis et al. 1987) the California Verbal Learning Test, Second Edition (CVLT-II) is a neuropsychological test that comes provided with associated demographically corrected norms (Delis et al. 2000). This test was chosen since it had revealed robust deficits in ChSz patients, FEP and UHR subjects relative to matched controls in previous studies (Cirillo & Seidman, 2003; Rund et al. 2004; Niendam et al. 2006). Prior to scanning, the CVLT-II was administered to each subject by a trained researcher and their answers recorded. Data analysis sMRI Structural images were pre-processed using the Diffeomorphic Anatomical Registration using
UHR v. HC
FEP v. HC
Characteristic
HC (n = 19)
UHR (n = 19)
Age, years Gender, n Male Female
23.32 (3.43)
WRAT estimated premorbid IQ
Analysis
FEP v. UHR
HC (n = 19)
FEP (n = 19)
22.42 (3.42)
24.89 (4.41)
9 10
9 10
107.58 (10.77)
103.16 (13.14)
t = −1.22 p = 0.237
Analysis
FEP (n = 15)
FEP (n = 15)
24.37 (4.71)
23.20 (3.43)
23.27 (3.69)
12 7
12 7
9 6
9 6
108.53 (10.48)
102.74 (9.33)
104.87 (11.98)
103.80 (9.97)
t = −0.25 p = 0.807
t = −1.68 p = 0.110
Analysis
PANSS totala
52.53 (9.28)
54.37 (15.13)
53.73 (9.11)
51.80 (12.46)
t = −0.46 p = 0.655
PANSS positivea
12.84 (3.67)
12.58 (3.96)
12.80 (3.65)
12.07 (3.08)
t = −0.60 p = 0.556
PANSS negativea
14.00 (4.08)
13.79 (5.26)
14.33 (4.05)
13.47 (5.05)
t = −0.51 p = 0.618
PANSS generala
25.68 (5.01)
28.00 (8.35)
26.60 (4.97)
26.27 (7.35)
t = −0.14 p = 0.893
Total medicationb Mean medication/dayc
4538.49 (19 226.27) 13.27 (44.43)
32 828.58 (29 788.57) 204.08 (116.35)
5748.75 (21 628.90) 16.81 (49.75)
31 291.57 (27 178.41) 211.70 (109.89)
Data are given as mean (S.D.). SVM, Support vector machine; UHR, ultra-high risk; HC, healthy control; FEP, first-episode psychosis; WRAT, Wide Range Achievement Test; PANSS, Positive and Negative Syndrome Scale; S.D., standard deviation. a Symptom profile recorded at the time of the scan. b Total medication refers to the average absolute amount of medication taken by that group in standardized mg units of chlorpromazine ± 1 s.D. c Mean medication/day is the average medication dosage taken by each subject during their period of treatment in standardized mg units of chlorpromazine ± 1 s.D.
2550 W. Pettersson-Yeo et al.
Table 1. Demographic data for each SVM diagnostic comparison
Biological and cognitive measures to identify psychosis at the individual level 2551 Exponen-tiated Lie algebra (DARTEL) toolbox (Ashburner, 2007) in SPM8 software (http://www.fil. ion.ucl.ac.uk/spm) running under Matlab7.1 (Math Works, USA). This procedure involves the creation of a study-specific template and the segmentation of each individual image using said template, with the aim of maximizing accuracy and sensitivity. DTI The diffusion data were pre-processed using the ExploreDTI (Leemans et al. 2009) software package, including the RESTORE (robust estimation of tensors by outlier rejection) algorithm (Chang et al. 2005), in order to generate FA maps corrected for eddy current distortion, head motion, b-matrix reorientation and rejection of data outliers. These images were then used to create FA ‘skeletons’ depicting each subject’s unique WM network and associated FA value defined integrity for each voxel, using tract-based spatial statistics (Smith et al. 2006) software. fMRI Functional images were pre-processed using SPM8 software (http://www.fil.ion.ucl.ac.uk/spm) running under Matlab7.1 (Math Works, USA). Following the standard SPM8 functional imaging pipeline for pre-processing and analysis, using the parameter estimates obtained for all brain voxels from the task’s six experimental conditions: (1) initiation (In); (2) suppression (Su); (3) repetition of ‘REST’ during initiation (RI); (4) repetition of ‘REST’ during suppression (RS); (5) cross-fixation during initiation (CFI); and (6) cross-fixation during suppression (CFS), five contrasts of interest were computed, namely, Su > In, Su > RS, In > RI, Su > CFS and In > CFI. Genotyping DNA was extracted from saliva samples and genotyped for a pre-selected list of 26 psychosis-associated single nucleotide polymorphisms (SNPs) (Ferreira et al. 2008; O’Donovan et al. 2008; Schulze et al. 2009; Stefansson et al. 2009; Rivero et al. 2010; Chen et al. 2011; Cichon et al. 2011; Hansen et al. 2011, Ripke et al. 2011; Steinberg et al. 2011; Williams et al. 2011) (see Table 2) using the KASP™ (competitive allelespecific PCR) genotyping system. All SNPs were under Hardy–Weinberg equilibrium (p > 0.05), calculated using Fisher’s exact test. The genotype of each SNP was orthogonally coded and the values for each subject collated into a vector that could be entered into a SVM. In cases where one or more SNPs could not be genotyped for a given subject, these were
excluded for all other pairs in the SVM comparison since each vector length must be the same. The number of SNPs therefore entered into the SVM for FEP versus HC, UHR versus HC, and FEP versus UHR were 20, 20 and 19, respectively. In cases where subjects declined to provide a DNA sample, a reduced number of SVM subject pairs was examined. Neuropsychology Each subject’s answers were entered into the CVLT-II software package and a summary of raw and standardized scores generated for each task component. These scores were then collated into a single vector, reflecting the subject’s performance across the test, which could be entered into a SVM. Since one UHR subject did not complete the task, only 18 SVM subject pairs were examined for the UHR versus HC CVLT-IIbased comparison. SVM Each subject’s data (segmented GM images, FA skeletons, HSCT contrast images, orthogonally coded genotype data or CVLT-II score vectors) were entered separately into SVMs (Burges, 1998) as implemented in the PROBID software package (http://www.brainmap. co.uk/probid.htm) running under Matlab7.1 (Math Works, USA) in order to assess the diagnostic potential of each modality with respect to UHR and FEP subjects relative to HCs, and also to each other. For each comparison, subject pairs matched for age (±4 years) and gender were used to construct samples for the classifier, with each individual scan treated as a data point located in high-dimensional space and assigned by the operator to a given class. SVM comparator groups comprised 19, 19 and 15 subject pairs for FEP versus HC, UHR versus HC and FEP versus UHR, respectively. Each classifier was embedded in a leave-one-out cross-validation (LOOCV) framework, whereby all input vectors except those from one pair (one subject from each group) were used as training data for the classifier and the remaining pair withheld as test data. The accuracy of the classifier was calculated by taking the mean of its sensitivity and specificity (Hastie et al. 2001) across all LOOCV folds. Statistical significance of the accuracy was determined by a permutation test, whereby subjects were randomly assigned to a class and the LOOCV cycle repeated 1000 times. This provided a distribution of accuracies reflecting the null hypothesis that the classifier did not exceed chance. The number of times where it was greater than or equal to the true accuracy was then divided by 1000 to estimate a p value for the accuracy. For each neuroimaging comparison a discrimination map was produced visualizing each voxel’s weightvector score (wi) – representing its relative contribution
2552 W. Pettersson-Yeo et al. Table 2. Specific single nucleotide polymorphisms selected as support vector machine input and corresponding publication from which they were derived
Gene
Single nucleotide polymorphism
Reference
1. ZNF804A 2. CACNA1C 3. MHC/PRSS 4. TCF4 5. MMP16 6. NRGN 7. CMYA5 8. CMYA5 9. MHC/PRSS 10. MHC/PRSS 11. NCAN 12. PBRM1 13. TCF4/CCDC68 14. AHIL 15. MHC/PRSS 16. PCGEM1 17. CNNM2 18. NT5C2 19. ANK3 20. ANK3 21. CSMD1 22. TCF7L2 23. VRK2 24. CACNA1C 25. DYPD 26. TRIM26
rs1344706 rs1006737 rs13211507 rs9960767 rs7004633 rs12807809 rs10043986 rs4704591 rs3131296 rs6932590 rs1064395 rs2251219 rs4309482 rs7750586 rs911507 rs17662626 rs7914558 rs11191580 rs10994336 rs9804190 rs10503253 rs7903146 rs2312147 rs7972947 rs1625579 rs2021722
O’Donovan et al. (2008) Ferreira et al. (2008) Steinberg et al. (2011) Stefansson et al. (2009) Ripke et al. (2011) Stefansson et al. (2009) Chen et al. (2011) Chen et al. (2011) Stefansson et al. (2009) Stefansson et al. (2009) Cichon et al. (2011) Williams et al. (2011) Steinberg et al. (2011) Rivero et al. (2010) Steinberg et al. (2011) Steinberg et al. (2011) Ripke et al. (2011) Ripke et al. (2011) Ferreira et al. (2008) Schulze et al. (2009) Ripke et al. (2011) Hansen et al. (2011) Steinberg et al. (2011) Ripke et al. (2011) Ripke et al. (2011) Ripke et al. (2011)
ZNF804A, Zinc finger protein 804A; CACNA1C, calcium channel, voltage dependent, L-type, alpha 1 subunit; MHC/PRSS, major histocompatibility complex/cationic trypsinogen gene; TCF4, transcription factor 4; MMP16, matrix metallopeptidase 16; NRGN, neurogranin; CMYA5, cardiomyopathy associated 5; NCAN, neurocan; PBRM1, protein polybromo1; CCDC68, coiled coil domain containing 68; AHIL, Abelson helper integration 1; PCGEM1, prostate-specific transcript 1; CNNM2, cyclin M2; NT5C2, 5′-nucleotidase cytosolic II; ANK3, ankyrin 3; CSMD1, CUB and sushi multiple domains 1; TCF7L2, transcription factor 7-like-2; VRK2, vaccinia-related kinase 2; DYPD, dihydropyrimidine dehydrogenase; TRIM26, tripartite motif containing 26.
in defining the OSH – displaying the pattern of regions able to discriminate each group. Unlike previous studies (Mourão-Miranda et al. 2005; Marquand et al. 2008) no map threshold was applied since any successful discrimination was founded on the total number of voxel intensities entered into the SVM. For successful genetic and CVLT-II-based classifiers, analogous graphs showing the wi for each SNP or CVLT-II subcomponent, respectively, were also produced. Given that redundant feature extraction was not employed, nor a priori regions of interest specified, it was not possible to draw inferences regarding specific regions, SNPs or CVLT-II subcomponents out of the context of the overall pattern unlike mass-univariate results. For all classifiers, a linear
kernel was used and the SVM parameter C was fixed to unity. SVM classification accuracies In order to correct for multiple comparisons we employed both a Holm–Bonferroni step-down procedure, which controls for family-wise error (FWE) (Holm, 1979), in addition to the generally less conservative Benjamini–Hochberg procedure, which controls for false discovery rate (FDR) (Benjamini & Hochberg, 1995). Since both procedures are intended for independent data, however, which the comparisons here are unlikely to be, there is an increased
Biological and cognitive measures to identify psychosis at the individual level 2553 Table 3. Classification accuracy, sensitivity, specificity and p value for each binary group comparison, using sMRI, DTI, fMRI, genetic and cognitive input data SVM input data SVM comparison
GM
FA skeleton
Su > Ina
Su > RSa
In > RIa
Su > CFSa
In > CFIa
Genotype
CVLT-II
UHR v. HC Classification accuracy, % Sensitivity, % Specificity, % p
68.42b 68.42 68.42 0.010
65.79b 68.42 63.16 0.032
47.37 31.58 63.16 0.707
60.53 57.89 63.16 0.113
57.89 57.89 57.89 0.179
60.53 57.89 63.16 0.127
36.84 36.84 36.84 0.967
52.94 52.94 52.94 0.457
50.00 44.44 55.56 0.590
FEP v. HC Classification accuracy, % Sensitivity, % Specificity, % p
63.16 57.89 68.42 0.066
65.79b 68.42 63.16 0.031
63.16 47.37 78.95 0.064
44.74 36.84 52.63 0.791
65.79b 63.16 68.42 0.034
47.37 42.11 52.63 0.694
68.42b 63.16 73.68 0.017
67.86b 71.43 64.29 0.031
73.69c 68.42 78.95 0.002
FEP v. UHR Classification accuracy, % Sensitivity, % Specificity, % p
76.67d 80.00 73.33 0.001
56.67 46.67 66.67 0.281
53.33 40.00 66.67 0.404
46.67 46.67 46.67 0.731
63.33 53.33 73.33 0.087
53.33 40.00 66.67 0.425
73.33c 66.67 80.00 0.005
33.33 41.67 25.00 0.927
66.67b 66.67 66.67 0.034
sMRI, Structural magnetic resonance imaging; DTI, diffusion tensor neuroimaging; fMRI, functional magnetic resonance imaging; SVM, support vector machine; GM, grey matter; FA skeleton, fractional anisotropy skeleton; Su, suppression; In, initiation; RS, repetition of ‘REST’ during suppression; RI, repetition of ‘REST’ during Initiation; CFS, cross-fixation during suppression; CFI, cross-fixation during initiation; CVLT-II, California Verbal Learning Test – second edition; UHR, ultra-high risk; HC, healthy control; FEP, first-episode psychosis. a Hayling sentence completion task contrast conditions. b p < 0.05 uncorrected. c p < 0.05 false discovery rate-corrected. d p < 0.05 family-wise error-corrected.
risk of type II error. Therefore, in the absence of an optimally established method for correcting nonindependent hypotheses, for completeness both corrected and uncorrected accuracies are reported (see Table 3). Comparing classifiers Though the study’s primary focus was to investigate whether each data type can, or cannot, successfully distinguish FEP and UHR subjects from HCs, and/or each other, for completeness, a non-parametric Cochran’s Q test was also performed to examine whether the levels of accuracy for each classifier differed significantly for each diagnostic comparison. In the event of a significant result, a post hoc McNemar’s test, with Bonferroni correction, was then applied to identify which specific classifiers were statistically different.
a paired t test comparing those subjects used for the corresponding SVM comparisons was conducted for GM images, FA skeletons, HSCT contrasts and CVLT-II scores.
Results Demographics There were no significant differences with respect to pre-morbid IQ between any of the groups (p > 0.05), nor was there a significant difference in PANSS scores (total, positive, negative or general) between UHR and FEP subjects (p > 0.05). With respect to medication, all FEP subjects, except one, were medicated. In comparison, all UHR subjects were medication-naive, apart from two (see Table 1). SVM classification of GM images
Standard univariate analysis In order to compare the results of our multivariate approach with those of a standard univariate analysis,
Using GM images, SVM was able to successfully discriminate FEP from UHR subjects and UHR from HC subjects with accuracies of 76.67% (p < 0.05, FWE
2554 W. Pettersson-Yeo et al. Structural MRI 6
(a) FEP v. UHR
4
(b) UHR v. HC
–6 –4
2
–2
0
0
8 6 4 2 0
–6 –4 –2 0
DTI (c) UHR v. HC 12
–16 –12
8
–8
4
–4
0
0
(d) FEP v. HC 12
–16 –12
8
–8
4
–4
0
0
12
–15
8
–10
4
–5
0
0
12
–12
8
–8
4
–4
0
0
12
–15
8
–10
4
–5
0
0
Functional MRI (e) FEP v. HC:
(f ) FEP v. UHR:
(g) FEP v. HC:
In > RI
In > CFI
In > CFI
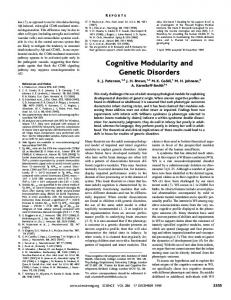
Fig. 1. Multivariate discrimination maps for successful structural magnetic resonance imaging (MRI)-, diffusion tensor neuroimaging (DTI)- and functional MRI-based support vector machine (SVM) classifiers. (a, b) Multivariate maps showing the pattern of grey matter regions used to discriminate: (a) first-episode psychosis (FEP) and ultra-high-risk (UHR) subjects – red indicates discrimination in favour of the FEP versus the UHR group, whilst blue indicates discrimination in favour of the UHR group versus the FEP group; (b) UHR and healthy control (HC) subjects – red indicates discrimination in favour of the UHR versus the HC group, whilst blue indicates discrimination in favour of the HC group versus the UHR group. (c, d) Multivariate maps showing the pattern of white matter regions used to discriminate: (c) UHR and HC subjects – green indicates discrimination in favour of the UHR versus the HC group, whilst yellow indicates discrimination in favour of the HC group versus the UHR group; (d) FEP and HC subjects – green indicates discrimination in favour of the FEP versus the HC group, whilst yellow indicates discrimination in favour of the HC group versus the FEP group. (e–g) Multivariate maps showing the pattern of neurofunction used to discriminate: (e) FEP and HC subjects using the initiation > repetition of ‘REST’ during initiation (In > RI) contrast – gold indicates discrimination in favour of the FEP versus the HC group, whilst turquoise indicates discrimination in favour of the HC group versus the FEP group; (f) FEP and UHR subjects using the initiation > cross fixation during initiation (In > CFI) contrast – gold indicates discrimination in favour of the FEP versus the UHR group, whilst
Biological and cognitive measures to identify psychosis at the individual level 2555 corrected) and 68.42% (p < 0.05), respectively. At a trend level only, SVM was also able to discriminate FEP subjects from HCs with an accuracy of 63.16% (p = 0.066). For the FEP versus UHR comparison the regional pattern most representative of FEP subjects was more rostrally and subcortically concentrated in comparison with the UHR group. Similarly for the UHR versus HC comparison, the regional pattern that most typified the UHR group appeared concentrated in more extreme cortical, rostral and caudal regions (Fig. 1a, b). SVM classification of FA skeletons Based on FA skeletons, SVM was able to successfully discriminate both FEP subjects from HCs, and UHR subjects from HCs with 65.79% accuracy (p < 0.05). The pattern of regions used for each classification was widely and diffusely spread, with no clear concentration of regions discernible (Fig. 1c, d). In contrast, it was not possible to directly discriminate FEP from UHR subjects using DTI with significant accuracy. SVM classification of HSCT contrasts Of the five contrasts tested, only two were able to make successful discriminations. Using the In > RI contrast FEP subjects were distinguishable from HCs with an accuracy of 65.79% (p < 0.05). In comparison, using the contrast In > CFI, SVM could discriminate between both FEP and UHR subjects, and also between FEP subjects and HCs, with accuracies of 73.33% (p < 0.05, FDR corrected) and 68.42% (p < 0.05), respectively. As Fig. 1e–g show, the regional pattern discriminating FEP from UHR and HC subjects was concentrated in the frontal and occipital cortices; in contrast, the pattern that most typified the UHR and HC relative to FEP subjects was widespread with greater prominence in the areas encompassing the central fissure. fMRI data were unable to distinguish UHR from HC subjects. SVM classification using genotype Using genetic information comprising data from a combination of 20 psychosis-associated SNPs, SVM was able to successfully discriminate FEP subjects from HCs with an accuracy of 67.86% (p < 0.05) (Fig. 2a). Comparatively, it was not possible to
discriminate UHR subjects from HCs, or FEP from UHR subjects using genetic data. SVM classification using CVLT-II score Based on each subject’s collated score representing their performance across the CVLT-II, SVM was able to successfully discriminate both FEP from HC subjects and also FEP from UHR subjects with accuracies of 73.69% (p < 0.05, FDR corrected) and 66.67% (p < 0.05), respectively (Fig. 2b, c). In contrast, CVLT-II score could not accurately differentiate UHR from HC subjects. Comparison of classifiers Using a Cochran’s Q test no significant differences were observed between the classifiers intended to discriminate UHR and HC subjects (Q = 8.856, p = 0.451), nor FEP and HC subjects (Q = 10.400, p = 0.319). Whilst a significant difference was observed between the classifiers intended to discriminate FEP and UHR subjects (Q = 18.353, p = 0.031), subsequent post hoc McNemar’s tests (Bonferroni corrected) comparing individual classifiers were not significant (p > 0.05). Standard univariate analysis Paired t test analysis revealed significant (p < 0.05, FWE corrected) FA differences for the contrast HC > UHR (see Supplementary Fig. 1). Further, a number of task subcomponents of the CVLT-II differed between groups in each of the three SVM comparisons (see Supplementary Table 1). In contrast, no significant differences were detected for GM or HSCT contrast data, with respect to any of the corresponding SVM comparisons. Potential confounds Since most FEP subjects were medicated we examined whether any successful classifier able to discriminate them from UHR, or HC, subjects could possibly be driven by this potential confound. This was achieved by performing a Pearson’s correlation analysis between the projection of each FEP subject’s input data onto the weight vector (i.e. the distance of each test subject’s scan from the hyperplane, quantifying the relative ease, or difficulty, with which they were categorized)
turquoise indicates discrimination in favour of the UHR group versus the FEP group; (g) FEP and HC subjects using the In > CFI contrast – gold indicates discrimination in favour of the FEP versus the HC group, whilst turquoise indicates discrimination in favour of the HC group versus the FEP group. (a–g) Left to right, axial slices with Montreal Neurological Institute (MNI) z coordinate −28, −6, 2, 16, 32, 46, 67. The colour scale for each subfigure shows the absolute value of the weight vector score for each voxel, representing its relative contribution to the optimal separating hyperplane.
2556 W. Pettersson-Yeo et al.
1
1
5
5
9
9
13
13
CVLT-II subcomponent
1 2 3 4 5 6 7 8 9 10 11 12 13 14 15 16 17 18 19 20
17 21 25 29 33
15 -16 16 0 E.5E .75 –7 3 –
E-
–1
16
E-
5 3.7
Weight vector
-16
E 7.5
15
E-
5 .12
17 21 25 29 33
37
37
41
41 45
45 5 .12
(c) FEP v. UHR
(b) FEP v. HC
CVLT-II subcomponent
Single nucleotide polymorphism
(a) FEP v. HC
.45 0.30 0.15 –0 – –
0
0 5 0 5 0.1 0.3 0.4 0.6
.45 0.30 0.15 – –
–0
0
5
0.1
0
0.3
5
0.4
0
0.6
1
Weight vector
Weight vector
Fig. 2. Weight vectors for successful genetic- and California Verbal Learning Test – second edition (CVLT-II)-based support vector machine (SVM) classifiers. (a–c). Bar charts showing the weight vector for each (a) single nucleotide polymorphism and (b, c) CVLT-II subcomponent, representing their relative contribution to the optimal separating hyperplane, used to discriminate. (a) First-episode psychosis (FEP) and healthy control (HC) subjects: light grey indicates discrimination in favour of the FEP versus the HC group, whilst dark grey indicates discrimination in favour of the HC group versus the FEP group (‘E-n’ multiplies the preceding value by (10)–n, where n is a real number). (b) FEP and HC subjects: light grey indicates discrimination in favour of the FEP versus the HC group, whilst dark grey indicates discrimination in favour of the HC group versus the FEP group. (c) FEP and ultra-high-risk (UHR) subjects: light grey indicates discrimination in favour of the FEP versus the UHR group, whilst dark grey indicates discrimination in favour of the UHR group versus the FEP group. (See Table 2 for single nucleotide polymorphisms 1–20, and Supplementary material for CVLT-II subcomponents 1–45.)
and their corresponding medication measure, i.e. total dose and mean dose per day. No significant correlations were found (see Supplementary material for details). Discussion In agreement with our first hypothesis, FEP subjects were most readily discriminable from HCs with accurate classifiers generated by all modalities, with the exception of sMRI. Notably, this demonstrates the novel finding that genetic data may be used to discriminate FEP subjects from HCs at the individual level with significant accuracy. As proposed in our second hypothesis, we show that UHR subjects are differentiable from HCs based on sMRI and DTI; however, it was not possible to distinguish these two groups using fMRI, cognitive or genetic data. Finally, consistent with our third hypothesis, we found that FEP and UHR subjects could be accurately differentiated when compared directly using sMRI, fMRI and cognitive, but not genetic or DTI, data. Taken together, the results provide a number of possible inferences associated with the UHR and FEP states. Given that DTI data were able to successfully discriminate between the two patient groups relative
to HCs, for example, supports the notion that WM alterations are associated with psychosis risk. Likewise, the fact that sMRI was able to discriminate UHR from FEP and HC subjects may imply that GM alterations are specifically associated with the UHR state, but not those who have transitioned. The absence of GM alteration in FEP subjects relative to HCs is surprising, however, given previous reports of widespread significant effects (Shepherd et al. 2012). One speculative explanation for this is that the FEP subjects recruited here were less clinically severe than those of previous studies, potentially resulting in less severe alteration. This is supported by their relatively stable symptom profile (Table 1), which may possibly, in turn, have been driven by downstream effects of exposure to anti-psychotic medication. This interpretation is made with caution, however, since the precise effects of such exposure remain unclear (Navari & Dazzan, 2009), and since a successful classifier was not generated furthermore, this could also not be investigated quantitatively using a correlation analysis. In comparison, the fact that fMRI and cognitive data could differentiate FEP from UHR and HC subjects suggests that alterations in these two domains are specifically associated with conversion to psychosis. This inference is also true for individual genotype
Biological and cognitive measures to identify psychosis at the individual level 2557 data, which were able to discriminate only between those with a FEP and HCs. Methodologically, our results consolidate the notion that multivariate techniques such as SVM may be better suited to the development of a real-world clinical diagnostic tool than standard mass-univariate methods. Although no focal abnormalities survived univariate threshold either for sMRI nor fMRI, for example, overall patterns of alteration in data from these two modalities were still able to successfully discriminate between subjects. Furthermore, the ability to accurately distinguish FEP from HC subjects using genetic data supports the notion that individuals who suffer a FEP may be genetically predisposed to transitioning (Kéri et al. 2009). As a non-invasive, easily obtained and relatively cheap data type, it could potentially serve as a good basis for future diagnostic tools in conjunction with clinical assessment. Similarly, the fact that CVLT-II score was able to distinguish FEP from both UHR and HC subjects may represent another non-invasive and inexpensive tool to inform identification of individuals with a FEP. With specific regard to UHR subjects in comparison, the fact that only sMRI and DTI were able to distinguish them from HCs might suggest that they are associated with patterns of neuroanatomical alteration that may occur in the absence of similar genetic, neurofunctional or cognitive patterns of alteration, though focal abnormalities may still be evident. This aspect of our results therefore provides tentative support for the use of sMRI and DTI as a clinical aid in identifying those at UHR of psychosis, but may be limited by the associated costs and technical expertise involved. It should be acknowledged, however, that in comparison with the few previous studies to have applied SVM to the UHR cohort, the accuracies found here discriminating UHR from HC subjects were relatively modest (Koutsouleris et al. 2009a, 2011). As with many univariate studies, this inconsistency may have arisen from a number of possible methodological differences which include, but are not restricted to, the assessment tools used to identify subjects at UHR; the strength of the scanner and the acquisition sequence used for the collection of neuroimaging data; the data-processing pipeline used to construct features for input into SVM; and the choice of SVM parameter settings (Caruana & Niculescu-Mizil, 2006; Orrù et al. 2012). Indeed, it is perhaps worth noting that as a relatively novel application to the field of psychiatry, efforts to identify the optimal criteria necessary for accurate discrimination using SVM are currently ongoing, of which these studies represent some examples. In the context of developing real-world diagnostic tools, therefore, two notes of caution must be
considered. First, the eventual use of genetic, neuropsychological and multimodal neuroimaging data in clinical practice would arguably require greater levels of diagnostic accuracy than those found here. One avenue to achieving this may lie in the integration of different types of data within the same SVM allowing information from one modality to inform that of another, for example, as used recently by Yang et al. (2010) to discriminate ChSz patients from HCs. It remains, however, that any future translational implementation of SVM must account for the fact that the impact of misclassifying someone ill as healthy may be worse than misclassifying someone healthy as ill. As such, a classifier able to detect patients with excellent sensitivity, but healthy individuals with only good specificity, may be preferred to a classifier with excellent specificity but only good sensitivity. Second, it should be noticed that the application of SVM could only reach the same level of diagnostic accuracy as traditional methods of clinical assessment since the development of the classifier is based on the distinction between groups in the training data, which ultimately relies on traditional diagnostic methods. Nevertheless, such technology may help in a clinical setting by discriminating between those most difficult to categorize using traditional methods of assessment alone. Furthermore, it could potentially be used in a forensic setting as an objective means of reducing controversy in evaluations of mental illness and minimizing errors in detecting malingering (Sartori et al. 2011). Limitations The study’s primary limitation was that at the time of scanning, the majority of FEP patients were medicated, and correspondingly, symptomatically stable. Although we found no evidence for a significant impact of medication, it is possible that anti-psychotic exposure, or even other variables not considered here, may still have contributed to the classification in an as yet undetectable way, potentially confounding the inference one can draw from the successful discriminator. It should also be acknowledged furthermore that the medication measures used as variables to detect potential confounds (i.e. total dose, average dose) may not have fully captured the historical and cumulative effects of exposure to anti-psychotics which may, in comparison, be more severe. Consequently, it cannot be ruled out, for example, that the successful FEP classifiers were simply distinguishing subjects who have, or have not, been exposed to antipsychotics. However, it remains that since the exact nature and extent of the effects of anti-psychotic medication on brain structure are not yet known (Navari & Dazzan, 2009), this is an issue not specific to the
2558 W. Pettersson-Yeo et al. current study, but is instead one that applies to the vast majority of studies of psychiatric patients. A second limitation is that, in the absence of an optimally established method for correcting for non-independent comparisons, we used two types of correction intended for multiple independent comparisons which may have resulted in an increased risk of type II error. However, we also reported uncorrected results for completeness. A third limitation, applicable to any study with access restricted to their own sample, is that as a single-centre, cross-sectional, study we are unable to make inference regarding the generalizability across different research centres for any of the successful classifiers, nor at this stage make any prediction of subsequent progression within the UHR group. A fourth limitation of the study is that the three subject groups were not compared using a multi-class classification approach, which would have provided a closer approximation of how differential diagnostic decisions are made in real-world clinical practice. However, since multiple binary classifiers for each possible comparison were generated in the current study, a quantitative estimate is still provided demonstrating the relative ease, or difficulty, with which subjects from each group may be differentiated from the subjects of every other group, with respect to each data type. Lastly, since we did not use any a priori regions of interest or automated data-driven feature selection, we are unable to make inferences regarding specific neuroanatomical regions, CVLT-II task components, SNPs, or risk alleles, since in each case the entirety of the data entered into the SVM was used to generate the classifier. Conclusion The evidence presented here demonstrates that subjects who have had a FEP can be identified at the individual level using a range of biological and cognitive measures including genetic, DTI, fMRI and cognitive data. In contrast, sMRI and DTI were the only modalities that allowed identification of those at UHR of psychosis with significant accuracy. For the first time we have shown that FEP and UHR subjects can be directly differentiated using neuropsychological, sMRI and fMRI data. From a clinical perspective, the results provide preliminary support to the translational development of SVM as a clinically useful diagnostic aid, highlighting patterns of genetic, cognitive, neuroanatomical and neurofunctional alterations that could, in the future, be potentially used to inform identification of those with subclinical symptomatology and recent converters. Nevertheless, we would stress that the eventual use of this approach in everyday clinical practice would arguably require
greater levels of diagnostic accuracy than found in the present study, with the integration of data representing one possible solution.
Supplementary material For supplementary material accompanying this paper visit http://dx.doi.org/10.1017/S003329171300024X.
Acknowledgements This work was supported by the Wellcome Trust (no. WT085390/Z/08/Z). W.P.-Y. was supported by a Ph.D. studentship from the Medical Research Council. A.F.M. gratefully acknowledges support from King’s College Annual Fund and the King’s College London Centre of Excellence in Medical Engineering, funded by a Wellcome Trust and Engineering and Physical Sciences Research Council (EPSRC) grant (no. WT088641/Z/09/Z). D.P. was supported by a National Institute for Health Research (NIHR) post-doctoral fellowship. A.M. was supported by an Investigator Award from the National Alliance for Research on Schizophrenia and Depression (NARSAD). The authors thank the NIHR Biomedical Research Centre for Mental Health at the South London and Maudsley NHS Foundation Trust for its continued support of our translational research objectives.
Declaration of Interest None.
References Allen P, Chaddock CA, Howes OD, Egerton A, Seal ML, Fusar-Poli P, Valli I, Day F, McGuire PK (2011). Abnormal relationship between medial temporal lobe and subcortical dopamine function in people with an ultra high risk for psychosis. Schizophrenia Bulletin 38, 1040–1049. Allen P, Mechelli A, Stephan KE, Day F, Dalton J, Williams S, McGuire PK (2008). Fronto-temporal interactions during overt verbal initiation and suppression. Journal of Cognitive Neuroscience 20, 1656–1669. Allen P, Stephan KE, Mechelli A, Day F, Ward N, Dalton J, Williams SC, McGuire P (2010). Cingulate activity and fronto-temporal connectivity in people with prodromal signs of psychosis. NeuroImage 49, 947–955. Ashburner J (2007). A fast diffeomorphic image registration algorithm. Neuroimage 38, 95–113. Benetti S, Mechelli A, Picchioni M, Broome M, Williams S, McGuire P (2009). Functional integration between the posterior hippocampus and prefrontal cortex is impaired in both first episode schizophrenia and the at risk mental state. Brain 132, 2426–2436.
Biological and cognitive measures to identify psychosis at the individual level 2559 Benjamini Y, Hochberg Y (1995). Controlling the false discovery rate: a practical and powerful approach to multiple testing. Journal of the Royal Statistical Society: Series B (Methodological) 57, 289–300. Bilder RM, Goldman RS, Robinson D, Reiter G, Bell L, Bates JA, Pappadopulos E, Willson DF, Alvir JM, Woerner MG, Geisler S, Kane JM, Lieberman JA (2000). Neuropsychology of first-episode schizophrenia: initial characterization and clinical correlates. American Journal of Psychiatry 157, 549–559. Broome MR, Woolley JB, Johns LC, Valmaggia LR, Tabraham P, Gafoor R, Bramon E, McGuire PK (2005). Outreach and support in south London (OASIS): implementation of a clinical service for prodromal psychosis and the at risk mental state. European Psychiatry 20, 372–378. Burges C (1998). A tutorial on support vector machines for pattern recognition. Data Mining and Knowledge Discovery 2, 121–167. Caruana R, Niculescu-Mizil N, (2006). An empirical comparison of supervised learning algorithms using different performance metrics. In Proceedings of the 23rd International Conference on Machine Learning, 161–168. Chang L-C, Jones DK, Pierpaoli C (2005). RESTORE: robust estimation of tensors by outlier rejection. Magnetic Resonance in Medicine 53, 1088–1095. Chen X, Lee G, Maher BS, Fanous AH, Chen J, Zhao Z, Guo A, van den Oord E, Sullivan PF, Shi J, Levinson DF, Gejman PV, Sanders A, Duan J, Owen MJ, Craddock NJ, O’Donovan MC, Blackman J, Lewis D, Kirov GK, Qin W, Schwab S, Wildenauer D, Chowdari K, Nimgaonkar V, Straub RE, Weinberger DR, O’Neill FA, Walsh D, Bronstein M, Darvasi A, Lencz T, Malhotra AK, Rujescu D, Giegling I, Werge T, Hansen T, Ingason A, Nöethen MM, Rietschel M, Cichon S, Djurovic S, Andreassen OA, Cantor RM, Ophoff R, Corvin A, Morris DW, Gill M, Pato CN, Pato MT, Macedo A, Gurling HMD, McQuillin A, Pimm J, Hultman C, Lichtenstein P, Sklar P, Purcell SM, Scolnick E, St Clair D, Blackwood DHR, Kendler KS; GROUP investigators; International Schizophrenia Consortium (2011). GWA study data mining and independent replication identify cardiomyopathy-associated 5 (CMYA5) as a risk gene for schizophrenia. Molecular Psychiatry 16, 1117–1129. Cichon S, Mühleisen TW, Degenhardt FA, Mattheisen M, Miró X, Strohmaier J, Steffens M, Meesters C, Herms S, Weingarten M, Priebe L, Haenisch B, Alexander M, Vollmer J, Breuer R, Schmäl C, Tessmann P, Moebus S, Wichmann H-E, Schreiber S, Müller-Myhsok B, Lucae S, Jamain S, Leboyer M, Bellivier F, Etain B, Henry C, Kahn J-P, Heath S; Bipolar Disorder Genome Study (BiGS) Consortium, Hamshere M, O’Donovan MC, Owen MJ, Craddock N, Schwarz M, Vedder H, Kammerer-Ciernioch J, Reif A, Sasse J, Bauer M, Hautzinger M, Wright A, Mitchell PB, Schofield PR, Montgomery GW, Medland SE, Gordon SD, Martin NG, Gustafsson O, Andreassen O, Djurovic S, Sigurdsson E, Steinberg S, Stefansson H, Stefansson K, Kapur-Pojskic L, Oruc L, Rivas F, Mayoral F,
Chuchalin A, Babadjanova G, Tiganov AS, Pantelejeva G, Abramova LI, Grigoroiu-Serbanescu M, Diaconu CC, Czerski PM, Hauser J, Zimmer A, Lathrop M, Schulze TG, Wienker TF, Schumacher J, Maier W, Propping P, Rietschel M, Nöthen MM (2011). Genome-wide association study identifies genetic variation in neurocan as a susceptibility factor for bipolar disorder. American Journal of Human Genetics 88, 372–381. Cirillo MA, Seidman LJ (2003). Verbal declarative memory dysfunction in schizophrenia: from clinical assessment to genetics and brain mechanisms. Neuropsychology Review 13, 43–77. Costafreda SG, Fu CHY, Picchioni M, Toulopoulou T, McDonald C, Kravariti E, Walshe M, Prata D, Murray RM, McGuire PK (2011). Pattern of neural responses to verbal fluency shows diagnostic specificity for schizophrenia and bipolar disorder. BMC Psychiatry 11, 18. Crossley NA, Mechelli A, Fusar-Poli P, Broome MR, Matthiasson P, Johns LC, Bramon E, Valmaggia L, Williams SCR, McGuire PK (2009). Superior temporal lobe dysfunction and frontotemporal dysconnectivity in subjects at risk of psychosis and in first-episode psychosis. Human Brain Mapping 30, 4129–4137. Davatzikos C, Shen D, Gur RC, Wu X, Liu D, Fan Y, Hughett P, Turetsky BI, Gur RE (2005). Whole-brain morphometric study of schizophrenia revealing a spatially complex set of focal abnormalities. Archives of General Psychiatry 62, 1218–1227. de Mello Ayres A, Scazufca M, Menezes PR, Nakano EY, Regina ACB, Schaufelberger MS, Murray RM, McGuire PK, Rushe T, Busatto GF (2010). Cognitive functioning in subjects with recent-onset psychosis from a low-middle-income environment: multiple-domain deficits and longitudinal evaluation. Psychiatry Research 179, 157–164. Delis D, Kramer J, Kaplan E, Ober B (1987). California Verbal Learning Test: Adult Version. Manual. The Psychological Corporation: San Antonio, TX. Delis D, Kramer J, Kaplan E, Ober B (2000). California Verbal Learning Test, Second Edition. Adult Version. The Psychological Corporation: San Antonio, TX. Eastvold AD, Heaton RK, Cadenhead KS (2007). Neurocognitive deficits in the (putative) prodrome and first episode of psychosis. Schizophrenia Research 93, 266–277. Egerton A, Borgwardt S, Tognin S, Howes O, McGuire P, Allen P (2011). An overview of functional, structural and neurochemical imaging studies in individuals with a clinical high risk of psychosis. Neuropsychiatry 1, 477–493. Ellison-Wright I, Bullmore E (2009). Meta-analysis of diffusion tensor imaging studies in schizophrenia. Schizophrenia Research 108, 3–10. Ellison-Wright I, Glahn DC, Laird AR, Thelen SM, Bullmore E (2008). The anatomy of first-episode and chronic schizophrenia: an anatomical likelihood estimation meta-analysis. American Journal of Psychiatry 165, 1015–1023. Ferreira MAR, O’Donovan MC, Meng YA, Jones IR, Ruderfer DM, Jones L, Fan J, Kirov G, Perlis RH, Green EK, Smoller JW, Grozeva D, Stone J, Nikolov I, Chambert K, Hamshere ML, Nimgaonkar VL,
2560 W. Pettersson-Yeo et al. Moskvina V, Thase ME, Caesar S, Sachs GS, Franklin J, Gordon-Smith K, Ardlie KG, Gabriel SB, Fraser C, Blumenstiel B, Defelice M, Breen G, Gill M, Morris DW, Elkin A, Muir WJ, McGhee KA, Williamson R, MacIntyre DJ, MacLean AW, St Clair D, Robinson M, Van Beck M, Pereira ACP, Kandaswamy R, McQuillin A, Collier DA, Bass NJ, Young AH, Lawrence J, Ferrier IN, Anjorin A, Farmer A, Curtis D, Scolnick EM, McGuffin P, Daly MJ, Corvin AP, Holmans PA, Blackwood DH, Gurling HM, Owen MJ, Purcell SM, Sklar P, Craddock N; Wellcome Trust Case Control Consortium (2008). Collaborative genome-wide association analysis supports a role for ANK3 and CACNA1C in bipolar disorder. Nature Genetics 40, 1056–1058. Fusar-Poli P, Howes O, Valli I, Allen P, Broome M, Grasby P, McGuire P (2009). Multimodal functional imaging investigation before and after the onset of psychosis. International Journal of Neuropsychopharmacology 12, 579–581. Fusar-Poli P, Smieskova R, Serafini G, Politi P, Borgwardt S (2012). Neuroanatomical markers of genetic liability to psychosis and first episode psychosis: a voxelwise meta-analytical comparison. World Journal of Biological Psychiatry. Published online 27 January 2012. doi:10.3109/15622975.2011.630408. Hansen T, Ingason A, Djurovic S, Melle I, Fenger M, Gustafsson O, Jakobsen KD, Rasmussen HB, Tosato S, Rietschel M, Frank J, Owen M, Bonetto C, Suvisaari J, Thygesen JH, Pétursson H, Lönnqvist J, Sigurdsson E, Giegling I, Craddock N, O’Donovan MC, Ruggeri M, Cichon S, Ophoff RA, Pietiläinen O, Peltonen L, Nöthen MM, Rujescu D, St Clair D, Collier DA, Andreassen OA, Werge T (2011). At-risk variant in TCF7L2 for type II diabetes increases risk of schizophrenia. Biological Psychiatry 70, 59–63. Hastie T, Tibshirani R, Friedman J (2001). The Elements of Statistical Learning: Data Mining, Inference and Prediction. Springer-Verlag: New York. Holm S (1979). A simple sequentially rejective multiple test procedure. Scandinavian Journal of Statistics 6, 65–70. Ingalhalikar M, Kanterakis S, Gur R, Roberts TPL, Verma R (2010). DTI based diagnostic prediction of a disease via pattern classification. Medical Image Computing and Computer Assisted Intervention 13, 558–565. Kay S, Opler L, Fiszbein A (1987). The Positive and Negative Syndrome Scale (PANSS) for Schizophrenia. Schizophrenia Bulletin 13, 261–276. Keefe RSE, Perkins DO, Gu H, Zipursky RB, Christensen BK, Lieberman JA (2006). A longitudinal study of neurocognitive function in individuals at-risk for psychosis. Schizophrenia Research 88, 26–35. Kéri S, Kiss I, Kelemen O (2009). Effects of a neuregulin 1 variant on conversion to schizophrenia and schizophreniform disorder in people at high risk for psychosis. Molecular Psychiatry 14, 118–119. Koutsouleris N, Davatzikos C, Bottlender R, Patschurek-Kliche K, Scheuerecker J, Decker P, Gaser C, Möller H-J, Meisenzahl EM (2011). Early recognition and disease prediction in the at-risk mental states for psychosis
using neurocognitive pattern classification. Schizophrenia Bulletin 38, 1200–1215. Koutsouleris N, Meisenzahl EM, Davatzikos C, Bottlender R, Frodl T, Scheuerecker J, Schmitt G, Zetzsche T, Decker P, Reiser M, Möller H-J, Gaser C (2009a). Use of neuroanatomical pattern classification to identify subjects in at-risk mental states of psychosis and predict disease transition. Archives of General Psychiatry 66, 700–712. Koutsouleris N, Patschurek-Kliche K, Scheuerecker J, Decker P, Bottlender R, Schmitt G, Rujescu D, Giegling I, Gaser C, Reiser M, Möller H-J, Meisenzahl EM (2010). Neuroanatomical correlates of executive dysfunction in the at-risk mental state for psychosis. Schizophrenia Research 123, 160–174. Koutsouleris N, Schmitt GJE, Gaser C, Bottlender R, Scheuerecker J, McGuire P, Burgermeister B, Born C, Reiser M, Möller H-J, Meisenzahl EM (2009b). Neuroanatomical correlates of different vulnerability states for psychosis and their clinical outcomes. British Journal of Psychiatry 195, 218–226. Lao Z, Shen D, Xue Z, Karacali B, Resnick S (2004). Morphological classification of brains via high-dimensional shape transformations and machine learning methods. Neuroimage 21, 46–57. Leemans A, Jeurissen B, Sijbers J, Jones D (2009). ExploreDTI: a graphical toolbox for processing, analyzing, and visualizing diffusion MR data. In 17th Annual Meeting of the International Society for Magnetic Resonance in Medicine, p. 3537. Marquand AF, Mourão-Miranda J, Brammer MJ, Cleare AJ, Fu CHY (2008). Neuroanatomy of verbal working memory as a diagnostic biomarker for depression. Neuroreport 19, 1507–1511. Mechelli A, Riecher-Rössler A, Meisenzahl EM, Tognin S, Wood SJ, Borgwardt SJ, Koutsouleris N, Yung AR, Stone JM, Phillips LJ, McGorry PD, Valli I, Velakoulis D, Woolley J, Pantelis C, McGuire P (2011). Neuroanatomical abnormalities that predate the onset of psychosis: a multicenter study. Archives of General Psychiatry 68, 489–495. Minzenberg MJ, Laird AR, Thelen S, Carter CS, Glahn DC (2009). Meta-analysis of 41 functional neuroimaging studies of executive function in schizophrenia. Archives of General Psychiatry 66, 811–822. Mourão-Miranda J, Bokde ALW, Born C, Hampel H, Stetter M (2005). Classifying brain states and determining the discriminating activation patterns: Support Vector Machine on functional MRI data. NeuroImage 28, 980–995. Navari S, Dazzan P (2009). Do antipsychotic drugs affect brain structure? A systematic and critical review of MRI findings. Psychological Medicine 39, 1763–1777. Niendam TA, Bearden CE, Johnson JK, McKinley M, Loewy R, O’Brien M, Nuechterlein KH, Green MF, Cannon TD (2006). Neurocognitive performance and functional disability in the psychosis prodrome. Schizophrenia Research 84, 100–111. Norman KA, Polyn SM, Detre GJ, Haxby JV (2006). Beyond mind-reading: multi-voxel pattern analysis of fMRI data. Trends in Cognitive Sciences 10, 424–430.
Biological and cognitive measures to identify psychosis at the individual level 2561 O’Donovan MC, Craddock N, Norton N, Williams H, Peirce T, Moskvina V, Nikolov I, Hamshere M, Carroll L, Georgieva L, Dwyer S, Holmans P, Marchini JL, Spencer CCA, Howie B, Leung H-T, Hartmann AM, Möller H-J, Morris DW, Shi Y, Feng G, Hoffmann P, Propping P, Vasilescu C, Maier W, Rietschel M, Zammit S, Schumacher J, Quinn EM, Schulze TG, Williams NM, Giegling I, Iwata N, Ikeda M, Darvasi A, Shifman S, He L, Duan J, Sanders AR, Levinson DF, Gejman PV, Cichon S, Nöthen MM, Gill M, Corvin A, Rujescu D, Kirov G, Owen MJ, Buccola NG, Mowry BJ, Freedman R, Amin F, Black DW, Silverman JM, Byerley WF, Cloninger CR; Molecular Genetics of Schizophrenia Collaboration (2008). Identification of loci associated with schizophrenia by genome-wide association and follow-up. Nature Genetics 40, 1053–1055. Orrù G, Pettersson-Yeo W, Marquand AF, Sartori G, Mechelli A (2012). Using Support Vector Machine to identify imaging biomarkers of neurological and psychiatric disease: a critical review. Neuroscience and Biobehavioral Reviews 36, 1140–1152. Pereira F, Mitchell T, Botvinick M (2009). Machine learning classifiers and fMRI: a tutorial overview. Neuroimage 45, 199–209. Pettersson-Yeo W, Allen P, Benetti S, McGuire P, Mechelli A (2011). Dysconnectivity in schizophrenia: where are we now? Neuroscience and Biobehavioral Reviews 35, 1110–1124. Pflueger MO, Gschwandtner U, Stieglitz R-D, Riecher-Rössler A (2007). Neuropsychological deficits in individuals with an at risk mental state for psychosis – working memory as a potential trait marker. Schizophrenia Research 97, 14–24. Riecher-Rössler A, Pflueger MO, Aston J, Borgwardt SJ, Brewer WJ, Gschwandtner U, Stieglitz R-D (2009). Efficacy of using cognitive status in predicting psychosis: a 7-year follow-up. Biological Psychiatry 66, 1023–1030. Ripke S, Sanders AR, Kendler KS, Levinson DF, Sklar P, Holmans PA, Lin D-Y, Duan J, Ophoff RA, Andreassen OA, Scolnick E, Cichon S, St Clair D, Corvin A, Gurling H, Werge T, Rujescu D, Blackwood DHR, Pato CN, Malhotra AK, Purcell S, Dudbridge F, Neale BM, Rossin L, Visscher PM, Posthuma D, Ruderfer DM, Fanous A, Stefansson H, Steinberg S, Mowry BJ, Golimbet V, De Hert M, Jönsson EG, Bitter I, Pietiläinen OPH, Collier DA, Tosato S, Agartz I, Albus M, Alexander M, Amdur RL, Amin F, Bass N, Bergen SE, Black DW, Børglum AD, Brown MA, Bruggeman R, Buccola NG, Byerley WF, Cahn W, Cantor RM, Carr VJ, Catts SV, Choudhury K, Cloninger CR, Cormican P, Craddock N, Danoy PA, Datta S, de Haan L, Demontis D, Dikeos D, Djurovic S, Donnelly P, Donohoe G, Duong L, Dwyer S, Fink-Jensen A, Freedman R, Freimer NB, Friedl M, Georgieva L, Giegling I, Gill M, Glenthøj B, Godard S, Hamshere M, Hansen M, Hansen T, Hartmann AM, Henskens FA, Hougaard DM, Hultman CM, Ingason A, Jablensky AV, Jakobsen KD, Jay M, Jürgens G, Kahn RS, Keller MC, Kenis G, Kenny E, Kim Y, Kirov GK,
Konnerth H, Konte B, Krabbendam L, Krasucki R, Lasseter VK, Laurent C, Lawrence J, Lencz T, Lerer FB, Liang K-Y, Lichtenstein P, Lieberman JA, Linszen DH, Lönnqvist J, Loughland CM, MacLean AW, Maher BS, Maier W, Mallet J, Malloy P, Mattheisen M, Mattingsdal M, McGhee KA, McGrath JJ, McIntosh A, McLean DE, McQuillin A, Melle I, Michie PT, Milanova V, Morris DW, Mors O, Mortensen PB, Moskvina V, Muglia P, Myin-Germeys I, Nertney DA, Nestadt G, Nielsen J, Nikolov I, Nordentoft M, Norton N, Nöthen MM, O’Dushlaine CT, Olincy A, Olsen L, O’Neill FA, Orntoft TF, Owen MJ, Pantelis C, Papadimitriou G, Pato MT, Peltonen L, Petursson H, Pickard B, Pimm J, Pulver AE, Puri V, Quested D, Quinn EM, Rasmussen HB, Réthelyi JM, Ribble R, Rietschel M, Riley BP, Ruggeri M, Schall U, Schulze TG, Schwab SG, Scott RJ, Shi J, Sigurdsson E, Silverman JM, Spencer CCA, Stefansson K, Strange A, Strengman E, Stroup TS, Suvisaari J, Terenius L, Thirumalai S, Thygesen JH, Timm S, Toncheva D, van den Oord E, van Os J, van Winkel R, Veldink J, Walsh D, Wang AG, Wiersma D, Wildenauer DB, Williams HJ, Williams NM, Wormley B, Zammit S, Sullivan PF, O’Donovan MC, Daly MJ, Gejman PV; Schizophrenia Psychiatric Genome-Wide Association Study (GWAS) Consortium (2011). Genome-wide association study identifies five new schizophrenia loci. Nature Genetics 43, 969–976. Rivero O, Reif A, Sanjuán J, Moltó MD, Kittel-Schneider S, Nájera C, Töpner T, Lesch K-P (2010). Impact of the AHI1 gene on the vulnerability to schizophrenia: a case–control association study. PLoS ONE 5, e12254. Rund BR, Melle I, Friis S, Larsen TK, Midbøe LJ, Opjordsmoen S, Simonsen E, Vaglum P, McGlashan T (2004). Neurocognitive dysfunction in first-episode psychosis: correlates with symptoms, premorbid adjustment, and duration of untreated psychosis. American Journal of Psychiatry 161, 466–472. Sartori G, Pellegrini S, Mechelli A (2011). Forensic neurosciences: from basic research to applications and pitfalls. Current Opinion in Neurology 24, 371–377. Schulze TG, Detera-Wadleigh SD, Akula N, Gupta A, Kassem L, Steele J, Pearl J, Strohmaier J, Breuer R, Schwarz M, Propping P, Nöthen MM, Cichon S, Schumacher J; NIMH Genetics Initiative Bipolar Disorder Consortium, Rietschel M, McMahon FJ (2009). Two variants in Ankyrin 3 (ANK3) are independent genetic risk factors for bipolar disorder. Molecular Psychiatry 14, 487–491. Seidman LJ, Giuliano AJ, Meyer EC, Addington J, Cadenhead KS, Cannon TD, McGlashan TH, Perkins DO, Tsuang MT, Walker EF, Woods SW, Bearden CE, Christensen BK, Hawkins K, Heaton R, Keefe RSE, Heinssen R, Cornblatt BA; North American Prodrome Longitudinal Study (NAPLS) Group (2010). Neuropsychology of the prodrome to psychosis in the NAPLS consortium: relationship to family history and conversion to psychosis. Archives of General Psychiatry 67, 578–588.
2562 W. Pettersson-Yeo et al. Shepherd AM, Laurens KR, Matheson SL, Carr VJ, Green MJ (2012). Systematic meta-review and quality assessment of the structural brain alterations in schizophrenia. Neuroscience and Biobehavioral Reviews 36, 1342–1356. Smieskova R, Fusar-Poli P, Allen P, Bendfeldt K, Stieglitz RD, Drewe J, Radue EW, McGuire PK, Riecher-Rössler A, Borgwardt SJ (2010). Neuroimaging predictors of transition to psychosis – a systematic review and meta-analysis. Neuroscience and Biobehavioral Reviews 34, 1207–1222. Smith SM, Jenkinson M, Johansen-Berg H, Rueckert D, Nichols TE, Mackay CE, Watkins KE, Ciccarelli O, Cader MZ, Matthews PM, Behrens TEJ (2006). Tract-based spatial statistics: voxelwise analysis of multi-subject diffusion data. Neuroimage 31, 1487–1505. Stefansson H, Ophoff RA, Steinberg S, Andreassen OA, Cichon S, Rujescu D, Werge T, Pietiläinen OPH, Mors O, Mortensen PB, Sigurdsson E, Gustafsson O, Nyegaard M, Tuulio-Henriksson A, Ingason A, Hansen T, Suvisaari J, Lonnqvist J, Paunio T, Børglum AD, Hartmann A, Fink-Jensen A, Nordentoft M, Hougaard D, Norgaard-Pedersen B, Böttcher Y, Olesen J, Breuer R, Möller H-J, Giegling I, Rasmussen HB, Timm S, Mattheisen M, Bitter I, Réthelyi JM, Magnusdottir BB, Sigmundsson T, Olason P, Masson G, Gulcher JR, Haraldsson M, Fossdal R, Thorgeirsson TE, Thorsteinsdottir U, Ruggeri M, Tosato S, Franke B, Strengman E, Kiemeney LA; Genetic Risk and Outcome in Psychosis (GROUP), Melle I, Djurovic S, Abramova L, Kaleda V, Sanjuan J, de Frutos R, Bramon E, Vassos E, Fraser G, Ettinger U, Picchioni M, Walker N, Toulopoulou T, Need AC, Ge D, Yoon JL, Shianna KV, Freimer NB, Cantor RM, Murray R, Kong A, Golimbet V, Carracedo A, Arango C, Costas J, Jönsson EG, Terenius L, Agartz I, Petursson H, Nöthen MM, Rietschel M, Matthews PM, Muglia P, Peltonen L, St Clair D, Goldstein DB, Stefansson K, Collier DA (2009). Common variants conferring risk of schizophrenia. Nature 460, 744–747. Steinberg S, de Jong S, Irish Schizophrenia Genomics Consortium, Andreassen OA, Werge T, Børglum AD, Mors O, Mortensen PB, Gustafsson O, Costas J, Pietiläinen OPH, Demontis D, Papiol S, Huttenlocher J, Mattheisen M, Breuer R, Vassos E, Giegling I, Fraser G, Walker N, Tuulio-Henriksson A, Suvisaari J, Lönnqvist J, Paunio T, Agartz I, Melle I, Djurovic S, Strengman E; GROUP, Jürgens G, Glenthøj B, Terenius L, Hougaard DM, Ørntoft T, Wiuf C, Didriksen M, Hollegaard MV, Nordentoft M, van Winkel R, Kenis G, Abramova L, Kaleda V, Arrojo M, Sanjuán J, Arango C, Sperling S, Rossner M, Ribolsi M, Magni V, Siracusano A, Christiansen C, Kiemeney LA, Veldink J, van den Berg L, Ingason A, Muglia P, Murray R,
Nöthen MM, Sigurdsson E, Petursson H, Thorsteinsdottir U, Kong A, Rubino IA, De Hert M, Réthelyi JM, Bitter I, Jönsson EG, Golimbet V, Carracedo A, Ehrenreich H, Craddock N, Owen MJ, O’Donovan MC; Wellcome Trust Case Control Consortium 2, Ruggeri M, Tosato S, Peltonen L, Ophoff RA, Collier DA, St Clair D, Rietschel M, Cichon S, Stefansson H, Rujescu D, Stefansson K (2011). Common variants at VRK2 and TCF4 conferring risk of schizophrenia. Human Molecular Genetics 20, 4076–4081. Sun D, van Erp TGM, Thompson PM, Bearden CE, Daley M, Kushan L, Hardt ME, Nuechterlein KH, Toga AW, Cannon TD (2009). Elucidating a magnetic resonance imaging-based neuroanatomic biomarker for psychosis: classification analysis using probabilistic brain atlas and machine learning algorithms. Biological Psychiatry 66, 1055–1060. Tyson PJ, Laws KR, Roberts KH, Mortimer AM (2004). Stability of set-shifting and planning abilities in patients with schizophrenia. Psychiatry Research 129, 229–239. Walterfang M, Yung A, Wood AG, Reutens DC, Phillips L, Wood SJ, Chen J, Velakoulis D, McGorry PD, Pantelis C (2008). Corpus callosum shape alterations in individuals prior to the onset of psychosis. Schizophrenia Research 103, 1–10. Williams HJ, Craddock N, Russo G, Hamshere ML, Moskvina V, Dwyer S, Smith RL, Green E, Grozeva D, Holmans P, Owen MJ, O’Donovan MC (2011). Most genome-wide significant susceptibility loci for schizophrenia and bipolar disorder reported to date cross traditional diagnostic boundaries. Human Molecular Genetics 20, 387–391. Wood SJ, Brewer WJ, Koutsouradis P, Phillips LJ, Francey SM, Proffitt TM, Yung AR, Jackson HJ, McGorry PD, Pantelis C (2007). Cognitive decline following psychosis onset: data from the PACE clinic. British Journal of Psychiatry Supplement 191, s52–s57. Yang H, Liu J, Sui J, Pearlson G, Calhoun VD (2010). A hybrid machine learning method for fusing fMRI and genetic data: combining both improves classification of schizophrenia. Frontiers in Human Neuroscience 4, 192. Yung AR, Phillips LJ, McGorry PD, McFarlane CA, Francey S, Harrigan S, Patton GC, Jackson H (1998). Prediction of psychosis. A step towards indicated prevention of schizophrenia. British Journal of Psychiatry Supplement 172, s14–s20. Yung AR, Yuen HP, McGorry PD, Phillips LJ, Kelly D, Dell’Olio M, Francey SM, Cosgrave EM, Killackey E, Stanford C, Godfrey K, Buckby J (2005). Mapping the onset of psychosis: the Comprehensive Assessment of At-Risk Mental States. Australian and New Zealand Journal of Psychiatry 39, 964–971.