Geographic Information Systems (GIS) are an innovative and powerful tool to define relationships between species and habitat in large marine ecosystems.
http://journal.nafo.int J. Northw. Atl. Fish. Sci. Vol. 22: 37–46
Using Geographic Information Systems to Predict North Atlantic Right Whale (Eubalaena glacialis) Habitat Elizabeth Moses 1 and John T. Finn Department of Forestry and Wildlife Management, Holdsworth Hall University of Massachusetts, Amherst, MA 01003, USA
Abstract Geographic Information Systems (GIS) are an innovative and powerful tool to define relationships between species and habitat in large marine ecosystems. The objectives of this study were: 1) to gather bathymetry, SST(sea-surface temperature), and right whale (Eubalaena glacialis) sightings data and convert them to GIS coverages, and 2) to create a GIS based logistic regression model to predict North Atlantic right whale (Eubalaena glacialis) distribution as a function of SST and bathymetry. Part of the Scotian Shelf, 45°00'N to 42°00'N latitude and 66°00'W to 61°00'W longitude, was used as a study area to develop the model. The validity of the model was tested in a separate area with known right whale distribution, and the results showed that the model predicted sightings where right whales had been observed. Observations had shown that during their seasonal migration, a portion of the population does not appear in the known summering grounds in the Gulf of Maine, Bay of Fundy, and on the Scotian Shelf. New genetic evidence suggested an additional summering ground. Using the model, predictions for the North Atlantic showed possible summering grounds in areas which were historical whaling grounds. The results from the model can be incorporated into the Recovery Plan for this species. GIS offers an inexpensive method to examine marine mammals in relation to environmental and oceanographic features which affect their life histories. Key words:
bathymetry, GIS, ecosystems, models, right whales, sea-surface temperature
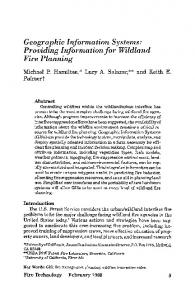
Introduction The North Atlantic right whale (Eubalaena glacialis) is the most endangered of the great whale species. Numbers in the 1600s showed a population size of perhaps 1 200–1 700 but had dropped by the mid-1700s to approximately 50–175 individuals due to commercial whaling (Reeves and Mitchell, 1987; Reeves et al., 1992). From information gathered over the last 40 years, the present North Atlantic right whale population appears to be concentrated in five areas off the US and Canadian coasts. Right whales are found off Cape Cod and in Massachusetts Bay from March through May, in the Great South Channel from April through June, and in the Bay of Fundy and Nova Scotian waters from July through October, with some portions of the population traveling to the coasts of Florida and Georgia from November through May (Kraus et al., 1986; Kraus, 1990; Slay, 1992) (Fig. 1). 1 Present
The North Atlantic population has been studied extensively from aerial and shipboard platforms. However, despite the information gathered, factors affecting distribution of the population remain poorly understood and the specific characteristics of right whale habitat remain unknown. Where some portions of the population migrate during the winter is still unknown, and new genetic evidence and sightings data suggest an additional summering ground (Knowlton et al., 1992; Schaeff et al., 1993). Locating and characterizing these unknown summering and wintering grounds are imperative to the recovery of the North Atlantic population. At a meeting conducted by the National Marine Fisheries Service (NMFS) in 1992, the Northern Right Whale Recovery Plan (NMFS, 1991) was presented to members of the right whale scientific community. This plan identified the need for a habitat study to categorize the biological and physical
address: 12 Calhoun Drive, P. O. Box 1344, Sumter, South Carolina 29151, USA
38
J. Northw. Atl. Fish. Sci., Vol. 22, 1997
Fig. 1. East coast of North America, bathymetric coverage, showing areas of known right whale distribution. SEUS = Southeast United States, GSC = Great South Channel, CCB = Cape Cod Bay, BOF = Bay of Fundy, SS = Scotian Shelf.
characteristics (e.g. bathymetry, sea-surface temperature) and to predict likely areas of still unknown right whale habitat. Evidence from the field and from similar cetacean studies (Hui, 1985; Reilly and Thayer, 1990; Watts and Gaskin, 1985) suggests that there may be a significant relationship between environmental features and cetacean distribution. During one season in 1989, Woodley (MS 1992) examined oceanographic features in relation to
feeding right (E. glacialis) and finback (Balaenoptera physalus)whale densities in the Bay of Fundy. His findings indicate that right whales were located in deep areas with high zooplankton abundance. This supports the work of Wishner et al. (1995) who found that right whales in the Great South Channel co-occurred with high concentrations of the copepod, Calanus finmarchicus, in older lifestages. Mayo and Marx (1990) determined that zooplankton density was significantly higher in
MOSES and FINN: GIS to Predict Right Whales areas where right whales were feeding than in areas where whales were not found. In looking at right whales in the Great South Channel, Brown and Winn (1989) found that the whales were distributed non-randomly near 100 m isobaths and thermal fronts. They concluded that "frontal features and/ or associated phenomena play an important role in the distribution pattern of right whales". Since the right whale range covers such a large part of the North Atlantic Ocean and may extend to areas currently unknown, it would be beneficial to derive a quantitative method to identify potential summering grounds. We propose that right whale sightings are very closely related to oceanographic features. The null hypothesis for this study is that there is no relationship between right whale sightings and sea-surface temperature (SST) and bathymetric features. The objectives of this project were: (i) to develop a mathematical model of known right whale summer habitat using GIS and (ii) to use the model to predict possible additional right whale summering grounds in the North Atlantic.
Methods Study area and data sets The study area was on the Nova Scotian Shelf and consists of an area approximately 125 000 km 2 , defined by 45°00'N to 42°00'N latitude and 66°00'W to 61°00'W longitude. It includes Browns and Baccaro Banks, between which is one of the best known sites of right whale occurrence, an area which had not been previously studied in detail (Fig. 2). This area (Roseway Basin) is a conservation area for right whales where they are protected from disturbance and injury under Canadian Law (DFO, 1994). The two main sources of right whale sightings and effort data were the Cetacean and Turtle Assessment Program (CeTAP), conducted by the University of Rhode Island from 1978 to 1982, and aerial and shipboard surveys dedicated to right whale sightings, collected by the Right Whale Consortium (New England Aquarium, University of Rhode Island, and Center for Coastal Studies) from 1980 to the present (1994). The combined sightings data cover the years from 1978 through 1994 and cover the known North Atlantic areas, as well as the area off the southeast U.S. coast, which has been surveyed since 1984.
39
The source of SST and bathymetry data was the Modern Average Global Sea-Surface Temperature (MAGSST) file through the U.S. Geological Survey (USGS). This file was developed from the NOAA Advanced Very High Resolution Radiometer Multichannel Sea Surface Temperature data. The SST data used cover nine oceanic regions, including the North Atlantic, during the period from October 1981 to December 1990. The SST over the nine years were combined and averaged for each month and each week, producing 12 monthly and 52 weekly values. The average monthly SST was chosen as the most appropriate data set to use in constructing our model. The data are in 10' × 10' (about 16 km × 16 km) cell resolution. Complete global-gridded bathymetry and elevation, as developed by Edwards (1989), in 5' × 5' (about 8 km × 8 km) cell resolution, with depth measured in meters, was the source of bathymetric data used in this analysis. Variables The dependent variable was distribution of right whales. Presence or absence of whales in a study cell was used, rather than number of whales expected, since it was of interest to know if right whales could be found in a certain area. This also reduced the problem of multiple sightings within a cell which would have weighted the cell too highly. For the model, independent variables were selected based on data sets of relevant oceanographic features that were accessible and transferable into a GIS format. The variables chosen, SST and bathymetry, have been shown to be very important in right whale distribution since they are directly related to right whale food distribution (Murison and Gaskin, 1989). In choosing SST and bathymetry as the independent variables, it was assumed that the correlates found by Murison and Gaskin (1989) would prove to be indicative of right whale distribution elsewhere. Creating the model A Geographic Information Systems (GIS) program, ARC/INFO ® , including both vector and raster (GRID) modules was used in this research. A primary coverage was developed which contained the study area as defined by latitude and longitude, the coastline of Nova Scotia, and bathymetric contour lines for 100 meters (50 fathoms) and 200 meters (100 fathoms). Additional coverages, in GRID
40
J. Northw. Atl. Fish. Sci., Vol. 22, 1997
Fig. 2. Study area off the Scotian Shelf, showing right whale concentration between Browns and Baccaro Banks. (Source: Right Whale Consortium).
(raster) format, were created for each independent variable: SST (12 coverages for each monthly average) and bathymetry. Another coverage, which detailed right whale sightings for the study area, was created with 16 km x 16 km (10' × 10') cells. The sightings and effort data were created in 10' × 10' cells with the starting point of the entire grid block being at the intersection of latitude and longitude, i.e. 66°00'W longitude and 42°00'N latitude. In the raw data files, sightings and effort per cell are given by the midpoint of that cell. For example, from the above starting point, the midpoint would be 66°05'W longitude and 42°05'N latitude. This midpoint corresponds with the number of sightings and effort (in km) for that cell.
Sightings in the study area made under the following conditions were selected: Beaufort sea-state ≤3, visibility at least 2 miles (3.2 km), and altitude of less than 1 000 feet (304.8 m) for aerial sightings. Aerial and shipboard sightings (N = 463 points), with associated effort, were combined for the purposes of this project, making the assumption that no difference in effort exists between the two sighting platforms. Multiple sightings may have occurred within each grid cell, however only one sighting per cell was used, so the number of sightings becomes equal to the number of cells with right whale presence. Using the above parameter conditions, other data sets were eliminated and only s i g h t i n g s f r o m t h e C e TA P a n d N e w E n g l a n d Aquarium files were used. The CeTAP effort data
MOSES and FINN: GIS to Predict Right Whales were not available to be incorporated into this coverage. The sightings and effort were categorized by season, editing out the winter season (no sightings data exist) and combining spring, summer, and autumn. Effort files were associated with the sightings and the same parameter conditions (above) were applied. Effort, in terms of kilometers (km) of trackline searched per cell, produced an effort coverage with 16 km × 16 km cells. The coastline and bathymetric contours were entered in ARC/INFO ® using files from NOAA, NMFS in Woods Hole, MA. A 10' × 10' grid, called a fishnet in the Lambert projection, was constructed to overlay the primary coverage. Because of the Lambert projection and the location of a study area at high latitudes, a 10' × 10' grid was not exactly equal to 18.5 km × 18.5 km and the resulting distortion produced an area approximately 16 km × 16 km (ESRI 1990). The bathymetry data had two sections. Coastal contours and isobaths for 100 m (50 fathoms) and 200 m (100 fathoms) were obtained from NMFS and entered into the GIS database using ARC/INFO ® . The global gridded elevation and depth values were obtained from the MAGSST database and imported into the GRID and projected into the Lambert projection. These values are in 5' × 5' (8 km × 8 km) cell resolution for the entire North Atlantic. Values are displayed in terms of shades of gray; darker areas represent deeper depths (Fig. 3). A slope value (percent) was calculated for each cell in relation to adjoining cells and ranged from 0.0 to 6.475. A grid coverage was also created of bathymetry and the standard deviation of bathymetry was based on a 3' × 3' cell box around the cell of interest. The SST data set from the MAGSST database included 12 separate images for the monthly averages from 1981 to 1990. Once imported into GRID, temperature was added as an attribute and the grid, in 10' × 10' (16 km × 16 km) cell resolution for the entire North Atlantic, was projected into Lambert. Here too values are displayed in shades of gray; with darker areas representing lower temperatures (the complete temperature range from -2.1°C to 48.9°C). Only data from the four summer months of June, July, August, and September for the 9-year time period were used.
41
Testing the model To examine our hypothesis, a mathematical model using GIS software and statistically analyzed right whale distribution was developed to determine if a significant relationship exists between whale occurrence and SST and bathymetric features for the area off the Scotian Shelf. To test the validity of the resulting model, it was used to predict where right whales should be found in Massachusetts Bay, an area of known right whale occurrence. By overlaying the coverage of right whale sightings for the area, it was possible to view how closely the real data fit the prediction model. The model was then used to predict the presence of right whales in the North Atlantic, based on the same SST and bathymetric features. In this model, logistic regression deals with presence/absence (binary or dichotomous) or ordinal data as dependent variables, and continuous or class data as independent variables (Kleinbaum, et al., 1988; Hosmer and Lemeshow, 1989). The predictions of logistic regression are in terms of probability of right whale presence in a cell, given the cell's independent oceanographic variable. The form of the equation is
p = e ( f ) / (1 + e ( f )) where f = a 0 + a 1 x 1 + a 2 x 2 + ... a i x i, x 1 – x i are the independent variables, a 0 – a i are the regression coefficients to be determined, and p is the probability of a right whale sighting within a cell. For the logistic regression, an 8 km × 8 km cell represented a single data point. Data coverages at 16 km resolution were sampled at 8 km resolution. No attempt was made to delete spatially autocorrelated data points. Two sets of data points were used in the analysis: 1) effort-masked data points (cells) which included only those cells occurring in water which contained effort, and 2) land-masked data points that cloaked out cells which were on land and did not reference whether or not cells in water had effort. To develop the regression model from the data for the study area, a suite of logistic regression analyses was conducted on each data set, using SST and bathymetry (and derived variables) as the independent variables. This produced 14 independent variables, with right whale presence or absence as the dichotomous dependent variable (0 = absence, 1 = presence).
42
J. Northw. Atl. Fish. Sci., Vol. 22, 1997
Fig. 3. Study area off the Scotian Shelf, showing bathymetric coverage. Darkest cells = deepest water, lightest cells = shallowest water. Range: 4 201 m to 0 m (land not included) at mean tide.
For each data set, four different logistic regressions were performed, one linear (with no squared terms), and three non-linear regressions, viz one with all fourteen independent variables, one with backwards elimination and one with forward selection. The SAS LOGISTIC procedure (SAS, 1990), was used in two stepwise procedures (Hosmer and Lemeshow, 1989) to eliminate variables from the models.
Results and Discussion The null hypothesis was rejected based on the statistical results of the best logistic regression, the landmasked backward elimination equation. Of the eight logistic regressions performed, only one had a non-significant Hosmer-Lemeshow goodness-of-
fit (Table 1) and this backward elimination regression equation was used for all further testing. Results for the backward elimination model, with 11 df, showed a significant chi-square value of 184.537 (p = .0001) and the predicted probabilities produced a good fit compared to the observed sightings (Hosmer-Lemeshow goodness-of-fit χ 2 = 12.862, p = .1167). Eleven terms were considered significant, with a c value (Region of Concordance) of 81.1% (Table 1). Using the backward elimination model, a coverage of predicted right whale presence in the Scotian Shelf study area was created. The areas with a higher probability of predicted right whale sightings were generally consistent with right whale sightings where dedicated aerial surveys had focused (between Browns and
MOSES and FINN: GIS to Predict Right Whales
43
TABLE 1. Results of logistic regression (see parameter descriptions below). Four different regressions for each type of masked data.
Right Whale Counts Present Absent df
HosmerHosmerLemeshow Lemeshow Significant chi-square 1 chi-square 2 p-value 2 terms 3
c(area under ROC curve) 4
Effort-Masked Linear
239
569
7
32.675
31.438
0.0001
5
0.632
Full
239
569
14
92.809
30.338
0.0002
11
0.723
Backward elimination
239
569
13
92.495
32.779
0.0001
13
0.722
Forward selection
239
569
6
68.4
62.985
0.0001
6
0.697
Linear
243
1 441
7
148.974
25.187
0.0014
5
0.741
Full
243
1 441
14
189.021
16.492
0.0359
11
0.812
Backward elimination
243
1 441
11
184.537
12.862
0.1167
11
0.811
Forward selection
243
1 441
5
138.705
54.384
0.0001
4
0.768
Land-Masked
1
ch i-square = whether the regression is better than chance at describing results (significant = not random, not significant = random).
2
Hosmer-Lemeshow chi-square (with p value) = comparison of predicted vs observed (significant = big difference between observed and expected, which is poor fit; not significant = small difference between observed and expected, which is good fit).
3
Significant terms = number of independent variables determined to be statistically significant.
4
c = area under Regions of Concordance curve, number of agreements between observed and expected. A value higher than 70% is a good fit (Lemeshow, Univ. of Massachusetts, Amherst, USA, pers. comm.).
Baccaro Banks). The coverage also indicated a high probability of right whale sightings in the Bay of Fundy; however, sightings and associated effort data for that area were not plotted. To test the prediction model, the same equation obtained for SST and bathymetry from the study area was applied to an area of the North Atlantic which included the other three right whale summering grounds. By overlaying the prediction grid with the Right Whale Consortium sightings data, a visual comparison of the two was possible (Fig. 4). Right whale areas of concentration in CCB, GSC, and BOF were predicted, but equally high predictions were made for the middle of the Gulf of Maine, George's Bank and the southern New England Shelf. Again, using the same equation from the study area model, a grid coverage which predicts areas of additional right whale summering grounds for the entire North Atlantic was created (Fig. 5). In addition to the east coast of North America from
Cape Hatteras to Nova Scotia, the regression predicted right whales in the southern Gulf of St. Lawrence, on the Grand Banks (off Newfoundland), on the Reykjanes Ridge running south from Iceland, and on the continental shelf around Ireland. Other less likely predictions included areas off the Canadian coast in the Labrador Sea, in Hudson Bay, in Baffin Bay west of Greenland and in the Great Lakes. Clearly additional criteria, such as salinity, are required to eliminate or confirm some of these areas. However, occasional opportunistic right whale sightings have been reported in the Gulf of St. Lawrence, Long Island Sound and the Delaware River. Despite the limitations of the data used, this simple model predicted a number of possible additional summering grounds for right whales. It shows that logistic regressions can convert sightings data to quantified hypotheses about habitat characteristics. These results, along with information from old whaling records (Reeves and Mitchell, MS 1987),
44
J. Northw. Atl. Fish. Sci., Vol. 22, 1997
Fig. 4. Model prediction in three right whale summering grounds (GSC, CCB, BOF). Lightest cells = highest probability of right whale presence. Black dots represent partial Right Whale Consortium sightings data. Area is approximately defined by 61°00'W to 71°00'W longitude and 41°00'N to 46°00'N latitude.
new satellite telemetry and tracking data, and what is known of their life history, may help determine where other summering grounds exist. This approach to studying right whales can serve as a model for assessing potential distribution of any species for which enough baseline and life history data are available to create GIS coverages. In addition, the results of this project can be incorporated into what is known about present right whale distribution and will enable managing agencies, both in the United States and Canada, to identify and protect critical areas of right whale habitat more effectively.
Acknowledgements We thank Dr Robert Kenney at the University of Rhode Island for his invaluable assistance in obtaining and editing the sightings data and the members of the New England Aquarium's Right Whale Research Team for access to their data. We also thank the anonymous reviewer(s) of this manuscript for constructive editing. Partial funding for this research was provided by the National Marine Fisheries Service and the Department of Forestry and Wildlife at the University of Massachusetts, Amherst.
MOSES and FINN: GIS to Predict Right Whales
45
Fig. 5. Predicted right whale distribution areas for the North Atlantic based on best logistic equation (Table 1). White areas indicate high probability of right whale presence. (Map projection Lambert conformal conic, map scale 1:54 000 000).
References BROWN, C. W., and H. E. WINN. 1989 Relationship between the distribution pattern of right whales, Eubalaena glacialis, and satellite-derived sea surface thermal structure in the Great South Channel. Cont. Shelf. Res. 9: 247–260. DFO (Department of Fisheries and Oceans). 1994. Caution mariners: please avoid collisions with Right Whales! Communications Directorate, Ottawa, Ont., Canada. Cat. No. Fs 23250/1994E. EDWARDS, M. H. 1989. Global gridded elevation and bathymetry (ETOPO5): digital raster data on a 5-minute geographic (lat/long) 2 160 × 4 320 (centroid-registered) grid. NOAA National Geophysical Data Center, Boulder, CO. 9-track tape, 18.6 megabytes. ESRI (Environmental Systems Research Institute, Inc.). 1990. Understanding GIS, the ARC/INFO® method. ESRI, Redlands, CA. HOSMER, D. W., and S. LEMESHOW. 1989. Applied
logistic regression. John Wiley & Sons, U.S.A. HUI, C. A. 1985. Undersea topography and the comparative distributions of two pelagic cetaceans. Fish. Bull., 83: 472–475 KLEINBAUM, D. G., L. L. KUPPER, and K. E. MULLER 1988. Applied regression analysis and other multivariable methods, 2nd ed. Duxbury Press, Belmont, CA. KNOWLTON, A. R., J. SIGURJÓSSON, J. N. CIANO, and S. D. KRAUS. 1992. Long-distance movements of North Atlantic right whales (Eubalaena glacialis). Mar. Mam. Sci., 8: 397–405. KRAUS, S. D. 1990. Sampling strategies used in some major photo-identification studies. Rep. Int. Whal. Comm., (Special Issue 12), p. 24. KRAUS, S. D., J. H. PRESCOTT, A. R. KNOWLTON, and G. S. STONE. 1986. Migration and calving of right whales (Eubalaena glacialis) in the western North Atlantic. In: Right Whales: Past and Present Status, R. L. Brownell, Jr., P. B. Best, and J. H. Prescott, (eds.) Int. Whal. Comm., (Special Issue No. 10), p. 139–144.
46
J. Northw. Atl. Fish. Sci., Vol. 22, 1997
MAYO, C. A., and M. K. MARX. 1990. Surface foraging behavior of the North Atlantic right whale, Eubalaena glacialis, and associated zooplankton characteristics. Can. J. Zool., 68: 2214–2220. MURISON, L. D., and D. E. GASKIN. 1989. The distribution of right whales and zooplankton in the Bay of Fundy, Canada. Can. J. Zool., 67: 1411–1420. NMFS (National Marine Fisheries Service) 1991. Recovery Plan for the Northern Right Whale (Eubalaena glacialis). Prepared by the Right Whale Recovery Team for the National Marine Fisheries Service, Silver Spring, MD. REEVES, R. R., and E. MITCHELL. 1987. Shore whaling for right whales in the Northeastern United States. Final Report to USDOC, NMFS/NOAA, SEFC, Miami, FL. REEVES, R. R., J. M. BREIWICK and E. MITCHELL. MS 1992. Pre-exploitation abundance of right whales off the eastern United States. NEFSC Ref. Doc. 92-05, NMFS, Woods Hole, MA. REILLY, S. B., and V. G. THAYER 1990. Blue whale (Balaenoptera musculus) distribution in the Eastern Tropical Pacific. Mar. Mam. Sci., 6: 265–277. SAS Institute, Inc. 1990. SAS/STAT user's guide. LOGISTIC procedure. SAS Institute, Cary, N. C.
SCHAEFF, C. M., S. D. KRAUS, M. W. BROWN and B. N. WHITE. 1993. Assessment of the population structure of western North Atlantic right whales (Eubalaena glacialis) based on sighting and mt DNA data. Can. J. Zool., 71: 339–345. SLAY, C. K. 1992. Maintenance dredging and aerial surveillance for right whales, U.S. Navy trident submarine entrance channel, King's Bay, Georgia, Winter 1991/92. Final Report USACE Contract No. DACW1792Q0008. U.S. Army Corps of Engineers. WATTS, P., and D. E. GASKIN 1985. Habitat index analysis of the Harbor Porpoise (Phoceona phocoena) in the southern coastal Bay of Fundy, Canada. J. Mamm., 66: 733–744. WISHNER, K. F., J. R. SCHOENHERR, R. BEARDSLEY, and C. CHEN. 1995. Abundance, distribution and population structure of the copepod Calanus finmarchicus in a springtime right whale feeding area in the southwestern Gulf of Maine. Cont. Shelf Res., 15: 475–507. WOODLEY, T. H. MS 1992. A characterization of North Atlantic right (Eubalaena glacialis) and finback (Balaenoptera physalus) whale habitat in the lower Bay of Fundy, Canada. Master's Thesis, The University of Guelph, Ontario, Canada. 104 p.