Using gestures to learn about graphs: the contribution of multimodal technology S. Anastopoulou, M. Sharples, C. Baber University of Birmingham Educational Technology Research Group, School of Engineering, Birmingham, B15 2TT, UK
[email protected],
[email protected],
[email protected] Abstract This paper describes a study that investigates the use of a multimodal technology in a learning task. In relation to the recent interest in learning as a multimodal experience, the use of a technology to acquire and visualize data while in a learning task in real time is argued to be beneficial and enjoyable for pupils. A study is described which investigates whether using the learner’s own movements or viewing someone else’s movements produces different outcomes when learning about kinematics graphs.
1. Introduction This paper investigates the contribution of multimodal human computer interaction to science education. Two issues are of main importance: multimodal learning and multimodal technology. Jewitt et al. (2001) describe the interaction between visual, actional and linguistic communication as multimodal learning. According to Baber et al. (2001), multimodal technology aims to support people’s sensory and response modalities while they use an interactive system. Multimodal systems can provide people with more advanced interactive means than conventional graphical user interfaces [1-3]. They support a combination of modalities that can be matched to the task or the environment. Multimodal systems, therefore, can support a learning task that uses multiple modalities, such as learning distance-time graphs. Within the classroom, the use of multiple modalities offers a rich range of resources for pupils to employ while learning. Each modality can cover a different aspect of phenomena which could challenge prior conceptions of the world and provide resources to imagine and think with [4]. In science education, particular aspects of multimodal communication become salient. Science shows an overriding importance of material things in relation to language; it connects with action through experiment and demonstration, and it uses images for knowledge representation [5]. Science education faces considerable problems in enabling children to understand scientific
concepts, especially those that are abstract [6]. Recent studies have introduced different ways for communicating science concepts to pupils, like the effect of gestures in scientific discourse [7, 8] or the effect of action while learning [4, 5, 9]. According to Franks (2001), action makes ideas seem real, create involvement, construct fact and convey the realism of scientific truth. This paper describes a study that investigates the use of a multimodal technology in a learning task. It uses movement as a means to record data, which is displayed in graphs and results in correction of the movement providing a multimodal learning experience. A study is described which investigates whether using the learner’s own movements or viewing someone else’s movements produces different outcomes when learning about distance-time graphs.
2. The educational context Learning about distance-time graphs, which forms part of the science education curriculum, is often learnt in isolation from pupils’ own movements. Usually, at schools, the motion of objects such as cars is studied. In this study, the focus is on the learners’ own bodies. If learning about graphs can be related to their own movements, they might be able to understand abstract representations of motion better and easier. Learning through their own movements can give learners a realisation that they are ‘doing science’ while they are moving their bodies [10]. Such an experience can make learners think of the abstract representations not as alien to their understanding but as a source of meaning that is not only related to the learning task at hand but also to the way they perceive themselves. Having access to the generation of the graph, and being able to change it as they move about, gives learners access to syntonic learning [10]: the graph is related to their senses and knowledge about their body (body syntonicity). Either moving the hand about or keeping it still causes a line to be generated on the display: this gives them the chance to realize the difference between the line that represents motion and the line that represents the lack of it. Graph generation also gives them a sense of themselves as persons with specific goals and desires
(ego-syntonicity) and gives them a sense of excitement and satisfaction when they accomplish it. They have to shape a specific graph: the graph in this way becomes a specific goal. Being able to plot a graph according to their movements gives learners a link to out-of-school activities: it associates science with the idea of being active and on the move (cultural syntonicity). The abstracted form of a graph becomes a meaningful representation of the hand’s motion. The graph not only describes laboratory situations in a school but also everyday situations. Learners can be stimulated to relate their activities to scientific concepts and to question whatever is not easily related, they, thus, become scientists themselves.
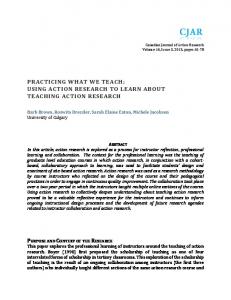
3. The Study The study investigates the use of a multimodal technology while learning about distance-time graphs. The technology consisted of a motion tracker to capture hand movements and a PC with special-purposed software to show the data in graphical form on the display. (Figure 1)
relation between their own hand movement and the graph formation: instead of focusing on any object in the environment it was thought that the use of their body would interest them more and would trigger them a better understanding of the graph and its representation. The study focused on the differences in understanding about distance-time graphs between students who formed graphs as they moved their hand and those that watched somebody else moving their hand and formed the graphs. The second condition removes any advantage of using their own body for data collection. It does not give access to body-syntonic or ego-syntonic learning. The hand of the other person could be just another object in the world. However, bearing in mind the lack of sufficient facilities in the classroom, pupils are very likely to watch the teacher or a fellow student doing an experiment. The study aims to investigate if there is any difference in understanding the concepts and enjoying the learning experience when performing the task with their own hands or watching it being performed. The hypothesis was: “when students experiment by their own movements, they will gain a better understanding of the distance-time graph and will enjoy the learning experience more than if they watch somebody else doing it”. The first condition was the experimental condition and the second was the control.
3.1 Method
Figure 1: Screenshot of the display The students needed to learn four main issues through relating the graph to their hand movement: to realize that a horizontal line on a graph means keeping the hand still, for the line to go up, the hand needs to move forward, for the line to go down, the hand needs to return to the original point, the slope of the graph shows how fast the movement is done, that is the speed of the movement. For the students to learn how to interpret a graph correctly, the relation between the hand’s movements and the line of the graph is important. This study explores the
The study was conducted with 22 students of Year 9 (14 years old) who were introduced to the concept of the distance-time graph. It was expected that the students would know little or nothing about the subject because they had not previously been taught distance-time graphs. The study was undertaken by the first author in a secondary school in Birmingham, UK. There were 11 students in each condition. Students were randomly assigned to the conditions on presentation to the experimenter. In each condition, there was one student in the room per session. Each child sat next to the experimenter and the student faced the laptop. Each session lasted about half an hour. Four tasks were assigned to all of the conditions: Initially, students were given a set of questions, which asked them what they already knew about the subject. Then, for the teaching session the group was split into ‘Doers’ and ‘Watchers’. The ‘Doers’ had the tracker’s sensor attached to their wrist with the aid of a sweatband. They moved their hand about freely to get familiar with the movement and the generation of the graph for approximately 3 minutes. Meanwhile, they discussed with the experimenter the details of the graph i.e. the name of each axis, the values it would have and what negative values would mean. As soon as the discussion ended, the
students tried to generate specific graphs and describe their movements in writing. The ‘Watchers’ were shown specific graphs and they watched the experimenter generating them on the display. At beginning of the first movement, they discussed with the experimenter about the details of the graph. Subsequently, students were asked to write down what the experimenter did. All participants had to interpret 4 graphs, of varying difficulty. A set of verbal protocols was used, to ensure that all students were given exactly the same instructions. The third part of the experiment involved the students answering questions in the form of a written test. They could not look back to the previous sheets. Finally, the pupils were asked to reflect on the experience and express their opinion about the study. They completed a short attitude survey, based on a 5 point Likert scale. In particular, they were asked whether they found the session interesting, if they liked it, if they liked watching their own data, how difficult were the questions and whether they felt that they understood the distance-time graphs.
3.2 Results The results discussed below are based on the writings of the pupils. From the initial set of questions, it was apparent that the students did not know about the distance-time graph. There was no difference in what the pupils knew between conditions. During the teaching session, ‘doers’ were significantly better in describing the graph in terms of their own hand movements (Mann Whitney test, z=-2.012, p