and classification function of discriminant analysis, were match of result models and input typological data reaches 70-90 %. These models are useful for ...
Using GIS and maximum likelihood classification to model forest altitudinal zones P. Vahalík, M. Klimánek Department of Geoinformation Technologies Faculty of Forestry and Wood Technology Mendel University in Brno, Czech Republic
Abstract There are 10 forest altitudinal zones for forest ecosystem on the territory of the Czech republic are described by phytocoenological studies using bioindicator species of plants. This classification is influenced by many abiotic factors. Using factors describing the site requirements of bioindicator species, allow estimating forest altitudinal zones by comprehensive modeling. As the potentially relevant factors the average temperature, precipitation, solar radiation, topographic exposure, aspect, slope, curvature, stream distance, soil and geology were identified. Their spatial distribution was mapped using spatial analysis techniques and Python regression code. Resulting rasters were subjected to discriminant analyzes to identify the significant abiotic factors. Results helped to merge the factors in a comprehensive analytical model based on the maximum likelihood classification and classification function of discriminant analysis, were match of result models and input typological data reaches 70-90 %. These models are useful for mapping of forest altitudinal zones outside of the forests, like urban zones (restoration or afforestation purposes), agricultural land or others site altered by human or natural activities. Models can also analytically verify typological studies performed in the field. Another area of application is presented in the context of climate change to study the shift of forest altitudinal zones as a part of decision support system. Keywords: forest altitudinal zones, regression, Python, spatial analysis, spatial decision support
1. Introduction Forest altitudinal zones and their modeling form part of forest typology and in general they represent an important fundamental material for landscape, forest or environmental activities. For biotope mapping, designing area systems of environmental stability and many other environmental works, the knowledge of forest altitudinal zones spatial distribution is also essential. According to (Volařík [1]) forest altitudinal zones are parts of two main typological systems used in the Czech Republic – (1) in the system of geobiocoenologic typology and (2) in the forest typological system of the Forest Management Institute (ÚHÚL). In the former Czechoslovakia, 10 forest altitudinal zones were defined (Zlatník [2]), which bear the name of the dominant tree in the potential natural state, these are: 1. oak, 2. beech-oak, 3. oak-beech, 4. beech, 5, fir-beech, 6. spruce-fir-beech, 7. spruce, 8. dwarf pine, 9. alpine and 10. sub-nival zones. Forest altitudinal zones show relationship between the sequence of differences of natural vegetation and the sequence of differences of altitude and exposure climate. Altitudinal zonation is mainly dependent on the temperatures of the air, soil and amount and time distribution of atmospheric rainfalls, incl. horizontal rainfalls. Edges of forest altitudinal zones are usually smooth, borders are fuzzy, only some borders are crisp. Contacts and sequence of forest altitudinal zones can be considerably modified by the specifics of mesoclimate. Inversion of altitudinal zonation especially occurs in deep river cuttings influenced by climatic inversion (Buček, Lacina [3]). Temperature and rainfalls, therefore, have an important role in the spatial distribution of forest altitudinal zonation. These climatic factors are mainly influenced by relief and elevation. In terms of relief there are also other influential factors such as factors of exposition, slope or intensity of solar radiation and others. In general,
it can be said that the influence of rainfalls on landscape modifications is regional, given mainly by the morphology of the territory and its prevalent circulation of air masses, while temperature has a local character. Solar radiation and average rainfalls are directly connected with elevation above the sea level, as opposed to temperature. Intensity of the solar radiation increases together with rising elevation by 10 % per one kilometer, while temperature decreases (by 0.54 ºC per 100 m) and the number of rainfalls increases (Randuška et al. [4]). At present, the basis for modeling altitudinal zonation is phytocoenological landscape study which uses the existence of bioindicator species of plants. Bioindicator species choose their sites based on their life requirements, which indirectly reveals abiotic factors influencing the spatial distribution of forest altitudinal zonation. Through a summary and geospatial analysis of these factors it is possible to determine the extent of their influence on the phenomenon studied using the existing forest altitudinal zonation maps which are the result of landscape typological mapping. Forest altitudinal zonation has been described in many geobiocoenological studies together with factors which influence it (Zlatník [2]), (Buček, Lacina [3]). Different authors describe a number of problems encountered when modeling forest altitudinal zonation (Kusbach [5]), (Grulich, Culek [6]), (Grulich et al. [7]). As mentioned above, the change in forest altitudinal zonation is mainly influenced by average temperature and precipitation in the given territory, which are determined by the combination of macroclimatic and mesoclimatic characteristics of the area. In terms of mesoclimate a greater influence is attributed to the configuration of the relief regarding the elevation of the territory and its geomorphology. In GIS all characteristics of the relief are based on the digital terrain models and ensuing geomorphological analyses. General geomorphological analyses necessary for effective mapping were a detailed subject of many studies, see e.g. (Klimánek [8]), (Pike et al. [9]), (Li, et al. [10]), or (Imhof [11]). Other important Morphological-climatic analyses which have an influence to the studied phenomenon are analysis of average temperatures with respect to altitude gradient solved by regression methods. In statistics, regression analysis includes any techniques for modeling and analyzing several variables, when the focus is on the relationship between a dependent variable and one or more independent variables. More specifically, regression analysis helps one to understand how the typical value of the dependent variable changes when any one of the independent variables is varied, while the other independent variables are held fixed. Most commonly, regression analysis estimates the conditional expectation of the dependent variable given the independent variables that is the average value of the dependent variable, when the independent variables are held fixed. Less commonly, the focus is on a quantile, or other location parameter of the conditional distribution of the dependent variable given the independent variables. In all cases, the estimation target is a function of the independent variables called the regression function. Regression analysis is widely used for prediction and forecasting, where its usage has substantial overlap with the field of machine learning. Regression analysis is also used to understand which among the independent variables are related to the dependent variable, and to explore the forms of these relationships (Freedman [12]). Topographic exposure as the other influential abiotical factor describes the degree to which the area is protected by the surrounding relief and in the given point it is equal to the sum of all the vertical angles to the horizon in eight basic cardinal directions (Ruel [13]). Topographic exposure as one of criteria for defining inversion areas in the relief with respect to its shape and prevalent direction of winds is studied in the following publications - Scott et Mitchell, [14]; Lanquaye et Mitchell, [15]; Ruel et al, [16]. The calculation of the topographic exposure is most often made using advanced analytical tools and scripts such as Morphometric Protection Index – MPI (Yokohama et al., [17]), which are part of open source software GIS SAGA (Software for Automated Scientific Analyses). Implementation of the topographic exposure using the shaded relief in ESRI ArcGIS software is described by Mikita and Klimánek [18]. Using geoinformation technologies for modeling forest altitudinal zonation was partly dealt with by Buček, Vlčková [19]), which used the existing typological model describing the forest altitudinal zonation in the Czech Republic for the prediction of the shift of these zones in connection with the climate changes. Forest altitudinal zonation using the digital elevation model was modeled by Volařík [1], who defined vegetation tiers based on regression dependency of elevation, temperature solar radiation with forest altitudinal zones. Prediction of vegetation types providing predictive habitat models of specific plant species using Canonical Correspondence Analysis and Logistic regression is dealt with by Chahouki et al. [21]. Prediction of vegetation zones in humid areas using thermal index which associate temperature sum with thermal seasonality is deal with by Chiu [22]. Space distribution of broad-leaved trees zones and coniferous zones is modeled by Da et al. [23]. The aim of this work is creating of the comprehensive analytical method of forest altitudinal zones modeling. To fulfill the aim of the work it is essential to consider dealing with a series of sub-problems. 1. Analyze the spatial distribution of abiotical factors with potential influence to the forest altitudinal zonation. 2. Analyze the statistical significance of particular abiotic factors to forest altitudinal zonation. 3. Create analytical model of forest altitudinal zones using influential abiotic factors. 4. Apply the forest altitudinal zones modelling to the examples which are usefull in forestry practice.
2. Material and methods 2.1. Testing areas Due to diversity in altitude and terrain in the Czech Republic, the study is applied on several locations with different relief features, in order to represent different morphological and climatic entities. The study is based on the data of the following locations: Mendel’s University Training Forest Enterprise in Křtiny (about 10,000 ha north-east from Brno), south part of the Bílé Karpaty Mountains (about 11,000 ha south of the town of Uherský Brod) and central part of the Moravskoslezské Beskydy Mountains (about 28,000 ha around Staré Hamry). These locations represent rolling hilly landscape with a lower precipitation amount and higher average temperature as well as mountainous location with high precipitation, low temperatures and significant altitude variability. Table 1: Representative characteristics of study areas (data of climate is for period 1961 – 1990) Study area Range of forest Altitudinal range Temperature range Precipitation altitudinal zones [m a. s. l.] [°C] range [mm] Beskydy 2. – 8. 368 – 1324 2.5 – 7.5 946 – 1532 Bílé Karpaty 1. – 5. 264 – 968 6.8 – 9.5 538 – 920 Křtiny 1. – 5. 212 – 573 6.0 – 8.8 509 – 707 2.2. Input data and applied software Characteristics of relief of testing areas are created by use of contour lines (spacing – 2m) coming out from the ZABAGED (Fundamental Base of Geographic Data in the Czech Republic). Relief characteristics used in forest altitudinal zones models of Czech Republic are based on the digital terrain model with spatial resolution 80 m created by National Aeronautics and Space Administration (NASA). Rasters of climatic factors are produced by the data (temperature, precipitation) measured by Czech Hydrometeorological Institute in years 1961 – 1990. Geology and soil conditions data comes from the Czech Geological Survey. Processing of spatial data was carried out in ESRI ArcGIS 10 software with the use of extensions Spatial Analyst and 3D Analyst. The base for the analysis was a vector layer of forest typology for the chosen areas taken from the Regional Plans of Forest Development (OPRL). Evaluation of the ratio of impact of individual abiotic factors was processed by software Statistica 9 (StatSoft Company). Information source about the relief of the area were contour lines of the ZABAGED further processed into digital terrain models (DTM) by ArcGIS tool Topo To Raster. This tool creates “hydrologically” correct model and it usually reaches the best results from the available interpolation tools (Klimánek, [20]). The created DTM became background for the creation of factors for further analysis. 2.3. Data processing and analysis 2.3.1. Abiotic factors The analysed factors include the following: average annual temperature, annual precipitation, orientation to cardinal points, slope gradient, relief curvature (convex, concave and flat parts of the relief), overall global annual radiation, topographical exposure factor (describes the degree to which the area is protected by the surrounding relief), types of soil and geology of the area and a layer of distance from drainage system. All factors were processed to rasters with spatial resolution of 5 m in the ArcGIS software environment. 2.3.2. Spatial distribution of abiotic factors For the creation of the map of average temperatures, the Czech Hydrometeorological Institute climatic data from the nearest climatic stations (20 stations inside or close to each area) were used. A regression script was written to statistically analyze the dependence of temperature and altitude in areas of interest. The regression script has been written using the Python programming language to perform linear, exponential, power and norder polynomial regression. Calculated equations of regressions are subsequently used for the modeling of average temperatures. Script also offers a possibility to choose optimal regression method using additional set of control points. This part of regression script is activated only when the columns of the attribute table where the values of additive control points are listed are defined by potential user. For example, in locations with insufficient number of climatic stations, regression expressing the dependence of temperature and altitude measured by climatic stations can use additional set of control values of temperature and altitude measured in the field. These data has to be registered in the attribute table custom columns regardless of the relevance of the attribute row to single vector elements of the input data set. Then the script is calculating the courses of single regression lines around
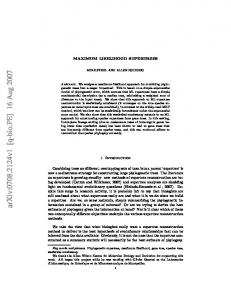
the values of additional control points using the least square method. Lowest resulting value of the least square method means closest progress of regression line around the control data set and describes the suitability of the particular regression type for the studying phenomenon (See Fig.1).
Figure 1: Least square methods over input data set and additional control data set By calculating equations in the ArcGIS software, maps of average temperatures based on altitude were created; however these maps do not make provision for the zonation of temperatures. This zonation was further solved by the calculation of temperature normality for chosen stations based on the equation (Eq.1). Tnorm = Treal / Tavg T = Tnorm * Tavg Eqn.(1) Normality of temperature Eqn.(2) Resultant value of temperature Where Tnorm means temperature normality, Tavg is the average temperature found out for the station according to regression equation, and Treal is average temperature measured by climatic station. The resultant value of normality is around 1, when lower temperatures mean stations below average and conversely higher normality suggests higher temperatures on average. By the interpolation of temperature normality values by means of the Spline tool, the values of normality for all areas under observation were calculated from equation (Eq.2). The model of average temperatures according to regression equation was further multiplied by temperature normality creating resultant map of average temperatures, which takes into account both the impact of altitude and the zonation of average temperatures. In the case of average annual precipitation a similar procedure was tested, the results of regression, however, did not completely confirm the dependence on altitude, because in the case of precipitation the mentioned zonation plays a more important part. For example in mountain valleys there does not occur a significant decrease in precipitation as opposed to the surrounding hilltops. The map of average precipitation was thus created by a mere interpolation of values of precipitation-gauge station by means of Spline tool. Regarding changes of forest altitudinal zonation a significant role is played by the factor of global radiation, which is given by the mutual combination of slope, aspect and relief curvature. The calculation of annual global radiation (direct and diffuse) was carried out directly in the ArcGIS software by means of tool Area Solar Radiation from DTM of areas of interest. The created maps express overall amount of solar radiation falling on the surface of the earth in WH/m2. The impact of climatic inversion was expressed as a factor of topographic exposure. The raster of topographic exposure was created by analytic illumination of the relief from 32 horizontal directions with the simulation of the current of air under the vertical angle of 5° by the multiple use of the Hillshade tool (Mikita et al.[18]). The factors of slope, aspect and relief curvature were created by means of ordinary tools (Slope, Aspect and Curvature) of the ArcGIS software. The examination of the impacts also additionally included factors of soil composition and geological subsurface (Czech Geological Survey datasets) gained by the conversion of vector
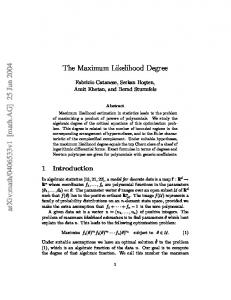
maps and further also the factor of the distance from drainage system calculated by tool Euclidean Distance from the vector layer of water course from ZABAGED. 2.4. Analysis of the relative importance for individual factors All factors rasters format were combined by means of ArcGIS software with the raster of forest altitudinal zonation from typological map from the OPRL database (only in forest areas). The resultant matrix of values for each pixel of the raster was exported as a table for processing into the Statistica 9 software and further analysed by discriminant analysis. This is based on the knowledge of differences between classes and affiliation to given classes to groups from training set (forest altitudinal zones from OPRL data). The discriminant analysis applies the value of Wilk’s lambda which determines the power of individual classes to correctly classify objects into desired groups. After defining fixed (forest altitudinal zones from the training set) and moving variables (values of factors), a table of variables, which stand as candidates for the model, is calculated. In another step table of results of discriminant analysis is created where the Wilk’s lambda value increases with increasing unsubstitutablity of a class in the model for the correct classification (see Fig. 2.). The height of this value identifies the unsubstitutablity of individual factors at correct assigning individual pixels into forest altitudinal zones, which describes the ratio of influence of individual abiotic factors on the phenomenon under observation.
Figure 2: Ratio of influence of abiotic factors on forest altitudinal zones 2.5. Multi-criteria modeling of the forest altitudinal zones After the identification of significant abiotic factors, all other factors with insignificant impact were eliminated from the model. The actual process of modeling forest altitudinal zonation was done in two ways: By classification – (1) by means of tool MLC (Maximum Likelihood Classification) of the ArcGIS 10 software and (2) by classification function of discriminant analysis of Statistica 9 software with subsequent use of the map algebra of the ArcGIS software. MLC classification is a process of object oriented classification which based on covariation subdivides pixels into pre-set number of classes which corresponds to the number of entrance categories in a training set (that is forest altitudinal zones). For determining covariation of individual pixels a signature set of the ASCII (American Standard Code for Information Interchange) type is used. The first step is the creation of signatures by means of tool Create Signatures which creates ASCII file containing two types of information. First is the general information about all classes such as the number of elements, names of input rasters, class numbers and others. Second type of information is statistics of each class which comprise of numbers of features and their values of covariation towards the value from the training group (that is the value of the forest altitudinal zone from the OPRL data). The set of signatures is thus used for the actual classification function, which is based on the comparison of values of covariation for each pixel, where calculates the value of likelihood based on a category of forest altitudinal zones into is assigned. Classification function is based on the above described discriminant analysis used for the evaluation of the ratio of impact for individual factors. The calculation of Wilk’s lambda defining significance of individual classes in the model is followed by the calculation of classification function. The classification function is a table where each class (factors) has its unique row and each category (forest altitudinal zones) has its column. The
values in the table represent variables with the help of which it is possible to calculate the value of likelihood of the affiliation of pixels to a forest altitudinal zone, which is represented by a particular column (see Eqn. 3 and Tab. 2). Table 2: Table of the classification function of discriminant analysis in the Bílé Karpaty Mts. Factor Variables of 1th Variables of Variables of Variables of Variables of 5th th th veg. zone 2 veg. zone 3 veg. zone 4th veg. zone veg. zone Temperature 0,6092 0,6234 0,5883 0,5438 0,4798 Precipitation 1,3303 1,3188 1,3374 1,2909 1,2404 Topographic 1,5563 1,6039 1,3346 1,2274 1,2932 exposure Radiation 0,000203 0,000201 0,000195 0,000188 0,000179 Slope 5,3806 5,3118 5,1867 5,1501 5,0766 Aspect 0,0353 0,0379 0,0355 0,0331 0,0318 Constant -971,996 -965,729 -942,898 -846,833 -778,492 F(1) = 0,60922 * temperature + 1,33026 * precipitation + 1.55633 * topex + … – 971,996 Where F(1) means likelihood of pixel affiliation to the 1st forest altitudinal zone Eqn. (3) Calculation of likelihood from the table of classification function This equation is subsequently processed by map algebra in the ArcGIS 10 software tool Raster Calculator into the raster of likelihood for each category that is the forest altitudinal zone contained in the model. Each input raster thus carries the value of pixel corresponding to the likelihood of affiliation of a given pixel towards a given forest altitudinal zone. Then the same amount of likelihood rasters is created as is the forest altitudinal zones in the model. These rasters are combined into another one and analytically re-evaluated in a way that in each pixel a value of forest altitudinal zone is assigned for which it has the highest value of likelihood affiliation. At some pixels, however occurs a concordance of likelihood values of affiliation to three forest altitudinal zones, these pixels are removed from the raster (on average this concerns about 3 % pixels in the model). At the concordance of two likelihood values the pixels are marked as transitions between two neighbouring zones (on average 18 % pixels in the model) and are marked as double-digits in relation to the value of forest altitudinal zones whose transition they represent. 2.6. Application possibilities 2.6.1. Modeling of the forest altitudinal zones in the Czech Republic As the suitable method of multi-criteria modeling of the forest altitudinal zones, the maximum likelihood classification was chosen, because of its simple implementation on a large volume of input dataset. Considering variation of abiotic conditions of the study area, it was necessary to separate whole state area to appropriate parts due to the abiotic conditions. Czech forest management uses the system of the Natural Forest Areas (PLO), which is separating the country to the 41 PLO due to the similarity of given natural characteristics. The spatial distribution of all influential abiotic factors was analyzed and the results were stripped by the boundaries of individual natural forest areas. Then the maximum likelihood classification was used for each of them. Finally all results were unified to the raster dataset output representing spatial distribution of forest altitudinal zones of entire Czech Republic even at the non-forest stands. 2.6.2. Model of the forest altitudinal zones in the Czech Republic after warming by one of Celsius The same model is applicable for prediction of forest altitudinal zones response to the likely change of an abiotic factor; there is also considered increasing of the average temperature in the model. This variant expected to increase of temperature by one degree of Celsius. Input raster of average temperature spatial distribution was adjusted to simulate expected temperature and subsequently used by modeling process.
3. Results Forest altitudinal zones modeling were performed by using two different methods: classification tools of Maximum Likelihood Classification and classification function of discriminant analysis. Both procedures resulted in creating a new raster depicting spatial distribution as an outcome of geospatial match of influential abiotic factors with OPRL typology data as a training set. The mutual concordance of newly created maps and the original typology of OPRL data in the location of central Beskydy for MLC analysis is 91 %, for the classification function 80 % (17 % pixels represents transitions between zones). In the University Forest Křtiny region the concordance of output with the training set for MLC analysis is 73 %, for classification function 78 %
(26 % pixels represents transitions between zones). In the location of the Bílé Karpaty there occurred the concordance of the training set and the output for MLC analysis 83 %, for classification function 81 % (11 % pixels represents transitions between zones). Table 3: Concordance of models with data of training set (OPRL data) Study area Concordance of Concordance of class. MLC and OPRL [%] function and OPRL [%] Beskydy 91 80 Bílé Karpaty 83 81 Křtiny 73 78
Transitions between two zones at the class. function [%] 17 11 26
Model of forest altitudinal zones of entire Czech Republic simulates the spatial distribution of studied phenomenon at forest stands and even at the non-forest stands. Areas of distribution of each zone are shown in Fig. 3. As expected areas of 1st 2nd and 3th forest altitudinal zone in contemporary forest habitats are in comparison to their areas nationwide markedly lower. This ratio is reversed between 4th and 7th zone. Forest altitudinal zones response to the warming by one degree is shown by Fig. 4. Area of 1st 2nd and 3th zone dramatically increases with increasing the average temperature by 1 °C.
Figure. 3: Proportion of forest altitudinal zones in contemporary forest and nationwide habitats
Figure 4: Nationwide proportion of forest altitudinal zones before and after warming by 1 °C
Figure 1: Spatial distribution of forest altitudinal zones in the Czech Republic
Figure 2: Change of forest altitudinal zones in the Czech Republic after warming by 1 °C
4. Discussion As expected, forest altitudinal zones are primarily affected by average temperature and precipitation. The third significant factor, topographical exposure, is nevertheless nominally (by expressing Wilk‘s lambda value) equally influential as before mentioned precipitation (see Fig 2). Topographical exposure, i. e. exposal of the locality towards surrounding landscape, is an abiotic factor that can primarily reflect the inversion of forest altitudinal zones. However, the procedure of creating a raster map of this particular factor employs contour lines which are available in the full extent of the study site, contrary to temperature and precipitation layers which are based on interpolation of values collected by several climatologic stations. Local extremes of topographical exposure are thus expressed more detail then with precipitation or temperature which are being generalized during the processing. This fact apparently leads to overestimate the influence of topographic exposure on forest altitudinal zonality at the expense of precipitation. This factor is however essential in analytical modeling of the studied phenomenon, as well as other factor with lower levels of significance, i. e. slope, aspect and solar radiation. The source data for precipitation mapping is missing information on horizontal precipitation (fog, dew), which makes up a significant proportion of total rainfall, especially in mountainous areas. When incorporating these data into the model, local extremes would be probably highlighted to increase the influence of this factor on studied phenomenon of spatial distribution. Mutual variability of the values determining the degree of these factors influence the forest altitudinal zonality at individual areas differs with distinct topographic characteristics and climate. Value of topographic exposure factor reaches higher level of influence at central Beskydy Mountains than at Bílé Karpaty Mountains, which corresponds with reality. This information however shows the necessarity of suitable selection of the study areas, which may have a high variability in presence of individual forest altitudinal zones, but not a high variability of topographical and climatic characteristics. Analogously, an enlargement of studied area causes a generalization of the modeled phenomenon. The climatic data used in the model date from the 1966 to 1990, which means the data are out-of-date, but this has no significant effect on the model analysis, which primarily considers their relative spatial variability and distribution and not their actual value. For the topographical characteristic, the contour data of ZABAGED were used. These are not continuous in locations of extreme terrain singularities (cliffs, ravines etc.) which are omitted in the resulting model. Resulting rasters created by classification models have different degree of match to the forest altitudinal zones from OPRL data on different areas. The difference in the outputs may be a result of much more detailed typization of forest altitudinal zones in the OPRL data compared with actual variability of the area or due to different approach or subjective view of each surveyor. Due to the nature of the forest altitudinal zone training sets (typological OPRL maps based on the field mapping) it is necessary to expect many errors in the input data which inevitably affect the modeling analyses output. The influence of local training data errors on analytic outputs can be considered insignificant when compared to the volume of input data and taking the random distribution of sporadic errors into account. On the contrary, the used analysis can identify these inconsistencies, which is going to be validated by a field survey.
5. Conclusion When comparing both multi-criteria modeling procedures, the MLC analysis offers a partly generalized output, while the classification function creates a more detailed model of forest altitudinal zonation. The disadvantage of classification function is a much more complicated data processing procedure and a classification inability at insufficiently represented categories of forest altitudinal zones. Classification function is also unable to work with categories which are in the model represented on a very low scale (for example 2nd and 3rd forest altitudinal zones in the Beskydy location). Modeling of these categories by means of the above described method must be done by extending the chosen location so that the representation of individual LVS in the training set was proportional. Therefore, for larger areas the MLC analysis seems to be more suitable, while the classification function is a more effective tool for modeling smaller territories with a high quality of input data. For reaching effective results, at both alternatives, especially the classification function, it is necessary to choose a sufficiently large territory so that the model proportionally consists of all modeled forest altitudinal zones, or the method can also be applied for defining chosen zones. The general qualitative variable denouncing efficiency and likelihood of outputs is similarly as at most geographical information analysis the quality of inputs. The practical application of both methods is especially in modeling forest altitudinal zones outside forest stands, where standard methods based on terrain phytocoenological survey cannot be used; this means in exposed urban areas or areas where the representation of species had been changed significantly. As this is a
complex analytical model, it can be used for the simulation of forest altitudinal zones displacement due to change of any abiotic factor. Increasing average temperature by one degree of Celsius, will dramatically change the proportion and space distribution of studied phenomenon. A model of this evolution is particularly important in areas of forest decision support systems. Expansion of the first and second forest altitudinal zone can be of considerable problem, particularly in areas with a higher proportion of spruce in forest habitats. The study may also support the phytocoenological mapping, by the easier orientation in the terrain or it can help to identify altitudinal transitions or to complete maps in terrains which are difficult to access. Future benefit may also be in applying these methods for landscape planning at the creation (and revision) of terrain systems of ecological stability, in agriculture for evaluating features of locations for plant breeding or for regional planning and infrastructure development.
7. References 1. 2. 3. 4. 5. 6. 7.
8. 9.
10. 11. 12. 13. 14. 15. 16. 17.
18. 19. 20. 21. 22.
23.
Volařík, D. Application of digital elevation model for mapping vegetation tiers, Journal of forest science, vol. 56, no. 3: pp. 112-120, 2010. Zlatník, A. Lesnická fytocenologie, Praha, Státní zemědělské nakladatelství, 1976. Buček, A., Lacina, J. Geobiocenologie II, Brno, MZLU v Brně: pp. 10-37, 2002. Randuška, R., Vorel, J., Plíva, K. Fytocenológia a lesnícka typológia, Príroda, Bratislava, 1986. Kusbach, A. Určení LVS – základ typologického mapování. In: Viewegh J. Seminář Problematika lesnické typologie II: pp. 19-21, Kostelec nad Černými lesy, ČZU, 2000. Grulich, V., Culek, M. Poznámky k vegetačním stupňům. In: Culek M. et al. Biogeografické členění České republiky, II. Díl, Praha, Agentura ochrany přírody a krajiny ČR, 2005. Grulich V., Petříček V., Culek M. Problémy se zařazováním náhradní přírodě blízké vegetace do vegetačních stupňů. In: Culek M., et al. Biogeografické členění České republiky, II. Díl, Praha, Agentura ochrany přírody a krajiny ČR, 2005. Klimánek, M. Digitální modely terénu, Brno, Mendelova zemědělská a lesnická univerzita v Brně: pp. 85, 2006. Pike, R.J., Evans, I., Hengl, T. Geomorphometry: A Brief Guide. In: Geomorphometry – Concepts, Software, Applications. In: Hengl, T., Hannes, I. (eds.). Series Developments in Soil Science vol. 33, Elsevier: pp. 3-33, 2008. Li, Z., Zhu, Q., Gold, Ch. Digital terrain modeling – Principles and Methodology, Washington, CRC Press: pp. 84-127, 2005. Imhof, E. Cartographic Relief Presentation, ESRI Press, Kalifornia: pp. 110-142, 2007. Freedman, D. Statistical Models: Theory and Practice, Cambridge University Press, 2005. Ruel, J.C. Understanding windthrow, Silvicultural implications, Forestry Chronicle 71: pp. 434-444, 1995. Scott, R.E., Mitchell, S.J. Empirical modelling of windthrow risk in partially harvested stands using tree, neighbourhood and stand attributes, For. Ecol. Management 218: pp. 193-209, 2005. Lanquaye, C.O., Mitchell, S.J. Portability of stand-level empirical windthrow risk models. For. Ecol. Management 216: pp. 134-148, 2005. Ruel, J.C., Mitchell, S.J., Dornier, M. A GIS based approach to map wind exposure for windthrow hazard rating, Northern Journal of Applied Forestry, vol. 19: pp. 183-187, 2002. Yokohama, R., Shirasawa, M., Pike, R.J. Visualizing Topography by Openness: A New Application of Image Processing to Digital Elevation Models, Photogrammetric Engineering and Remote Sensing(68), No. 3:pp. 257-266, 2002. Mikita, T., Klimánek, M. Topographic exposure and its practical applications, Journal of Landscape Ecology, vol. 3, no. 1: 42-51, 2010. Buček, A. Vlčková, V. Scénář změn vegetační stupňovitosti na území České republiky: deset let poté, Ochrana přírody, vol. 64, 2009. Klimánek, M. Přesnost digitálního modelu terénu a jeho využití v lesnictví, Acta Universitatis Agriculturae et Silviculturae Mendelianae Brunensis, no. 4:pp 137-144, 2007. Chahouki M.A.Z., Azarnivand, A., Jafari, M., Tavili, A. Multivariate statistical methods as a tool for modelbased prediction of vegetation types. Q. J. For. Res., vol. 30: pp. 89-112, 2008. Chiu, C. A., Lin, P. H., Hsu, C. K., Shen, Z.-H. A novel thermal index improves prediction of vegetation zones: Associating temperature sum with thermal seasonality. Ecological Indicators, vol. 23: pp. 668-674, 2012. Da, L. J., Kang, M. M., Song, K., Shang, K. K., Yang, Y. C., Xia, A. M., Qi, Y. F. Altitudinal zonation of human-disturbed vegetation on Mt. Tianmu, Eastern China, Ecological Research, vol. 24: pp. 1287-1299, 2009.