Using image processing to detect and classify narrow-band cricket and frog calls T. Scott Brandesa兲 Tropical Ecology Assessment and Monitoring (TEAM) Initiative, Conservation International, 1919 M Street, NW, Washington, D.C. 20036
Piotr Naskrecki Museum of Comparative Zoology, Harvard University, 26 Oxford Street, Cambridge, Massachusetts 02138
Harold K. Figueroa Bioacoustics Research Program, Cornell Laboratory of Ornithology, 159 Sapsucker Woods Road, Ithaca, New York 14850
共Received 4 February 2006; revised 13 July 2006; accepted 22 August 2006兲 An automatic call recognition 共ACR兲 process is described that uses image processing techniques on spectrogram images to detect and classify constant-frequency cricket and frog calls recorded amidst a background of evening sounds found in a lowland Costa Rican rainforest. This process involves using image blur filters along with thresholding filters to isolate likely calling events. Features of these events, notably the event’s central frequency, duration and bandwidth, along with the type of blur filter applied, are used with a Bayesian classifier to make identifications of the different calls. Of the 22 distinct sonotypes 共calls presumed to be species-specific兲 recorded in the study site, 17 of them were recorded in high enough numbers to both train and test the classifier. The classifier approaches 100% true-positive accuracy for these 17 sonotypes, but also has a high false-negative rate 共over 50% for 4 sonotypes兲. The very high true-positive accuracy of this process enables its use for monitoring singing crickets 共and some frog species兲 in tropical forests. © 2006 Acoustical Society of America. 关DOI: 10.1121/1.2355479兴 PACS number共s兲: 43.80.Ev, 43.80.Ka 关JAS兴
I. INTRODUCTION
Biodiversity documentation is the first step in its effective conservation. Yet practical implementation of specieslevel surveys in tropical ecosystems invariably runs into the problem of taxonomic impediment, or the lack of expertise to provide the necessary identification of collected organisms. In addition, the need to physically collect specimens to produce species diversity estimates often proves costly, time consuming, and logistically difficult. For some groups of organisms using their acoustic signals provides a viable alternative to specimen collecting, and allows for monitoring of species richness, presence or absence of indicator species, or even estimates of abundance.1 Acoustic signaling is a widespread behavior among many terrestrial and aquatic animals.2 Cicadas, orthopteroid insects 共crickets, katydids, and relatives兲, frogs, birds, and bats are only some of the groups that can be monitored acoustically. Crickets 共Orthoptera: Grylloidea兲 are particularly well suited for the purpose of acoustic monitoring because the range of frequencies employed by most species as a whole 共1 – 12 kHz兲 is audible to humans, their signals are simple 共few species employ frequency modulation兲, and their calls are species-specific.3 In most species of crickets the males produce audible calls using a modified area on their first pair of wings known
a兲
Electronic mail:
[email protected]
2950
J. Acoust. Soc. Am. 120 共5兲, November 2006
Pages: 2950–2957
as the stridulatory apparatus. Its basic design consists of a row of teeth on the underside of the right wing 共the stridulatory file兲 that produce sounds when rubbed against a hardened edge 共the scraper兲 of the left wing. The signal is amplified by the vibration of a membranous area of the wing 共the mirror兲. In some species additional sound amplification and redirection is achieved by using leaves as acoustic baffles, or by singing from horn-shaped burrows. The resulting signal serves primarily as an attractant to conspecific females, and in most cases is unique and easily recognizable. This allows us to record and recognize individual acoustic signatures of each species 共sonotypes兲 present in an area. The specificity of cricket calls even allows for using them to describe species in the absence of distinctive morphological characters typically used by insect taxonomists,4,5 and to use the calls to identify species in the field.6 In many tropical ecosystems crickets dominate the acoustic space both in terms of the number of species signaling at any given moment, and the frequency spectrum of their calls. Most of the cricket calls’ energy is within the audible part of the sound spectrum, and only some members of the subfamily Phalangopsinae produce ultrasonic calls in the range above 22 kHz.7 This concentration of crickets’ calls within the audible part of the spectrum, and their abundance in most ecosystems, makes them ideal candidates for long-term monitoring. At the same time crickets are very sensitive indicators of environmental change, as exemplified recently by the extinction of a number of Hawaiian species
0001-4966/2006/120共5兲/2950/8/$22.50
© 2006 Acoustical Society of America
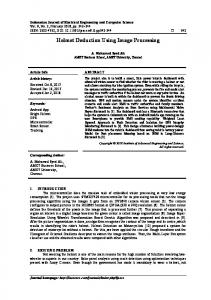
FIG. 1. Typical spectrogram of canopy recording. At least 8 sonotypes of crickets 共1–6兲 and frogs 共7, 8兲 present.
due to invasion of exotic ant species.8 Acoustic monitoring has already been successfully implemented in detection of rare or endangered insect species in temperate zones,9 and the same technique can be used to monitor species richness and the presence of species indicative of particular changing habitat parameters in tropical ecosystems.10 Multiple encouraging papers on automated recognition of bioacoustics signals have been recently published for a range of animals, including bats,11–13 birds,14,15 anurans,16 and Orthoptera.17–19 Since cricket songs have a simple structure, the more involved techniques used in human speech recognition that have shown promise in bird song identification,15 such as dynamic time warping and hidden Markov models, add unnecessary complication. Current research on Orthoptera call recognition17–19 rely heavily on time-domain signal processing and require a high signal to noise ratio in order to properly analyze call waveforms. This same problem holds true with frequency-domain features commonly used in sound recognition such as spectrum flux and spectral power,20,21 and mixed species choruses that vary in composition make these tools less useful. This reliance on low background noise severely limits the ability of these approaches to accurately identify crickets in tropical rainforests since numerous cricket species often call simultaneously and some of the quieter sounds present might be from crickets we are trying to detect. In the work presented here, an image processing approach is suggested as a method for detecting and classifying cricket 共and some frog兲 calls recorded amidst the constellation of background noises typically found shortly after sunset in tropical forests. II. MATERIALS AND METHODS A. Sound recordings
In the work presented here we used field recordings of crickets from a lowland rainforest in La Selva Biological Station located in NE Costa Rica. Some of the recordings were made with in-house autonomous recording units that were placed midcanopy, and deployed to acoustically monitor crickets nightly for weeks at a time. However, to quicker J. Acoust. Soc. Am., Vol. 120, No. 5, November 2006
assemble a library of cricket calls at the site, hand-held recorders were also used. The autonomous recorders were placed midcanopy to effectively record sounds originating from both the canopy and the ground.22 These devices used a PDA to make a 10 min recording nightly, starting 1 h after local sunset. PDAs where chosen since software can be written for them to make high-quality digital recordings at scheduled intervals. We used Hewlett Packard iPAC 5555 PDAs with a custombuilt power supply 共rechargeable NiMH battery pack兲 and weatherproof case, and in-house scheduledrecording software.23 The devices record sound at 44.1 kHz with 16-bit resolution and use a 16-element microphone and amplifier designed by the Bioacoustics Research Program at Cornell University. The microphone has a toroid beampattern and is very effective at collecting sounds within the canopy. A spectrogram of a typical canopy recording is shown in Fig. 1; most of the sounds are from crickets and frogs. There are at least 8 distinct sonotypes 共6 crickets and 2 frogs兲 present amidst a background of more distant individuals. While the frog calls are known for La Selva, no known libraries of cricket calls exist for the area. Work is still ongoing in assigning species labels to each acoustic signature and in the work presented here we designate our classifications as sonotype number. B. Automatic call recognition „ACR…
The ACR process we use involves operating on a spectrogram image of a sound. Spectrograms created with a FFT size of 512 points, a Hanning window, and a 50% window overlap provide sufficient resolution in both time 共5.8 ms兲 and frequency 共86.1 Hz兲 to allow detection and classification of dozens of sonotypes at our site. As shown in Fig. 2, once
FIG. 2. Steps in automatic call recognition using the image processing presented here.
Brandes et al.: Detecting narrow-band calls with image processing
2951
FIG. 3. 1 min average of spectrogram and zones to look for cricket and frog calls. Zone 1 = 0 – 0.75 kHz; Zone 2 = 0.75– 3.6 kHz; Zone 3 = 3.6– 7.1 kHz; Zone 4 = 7.1– 8.6 kHz; Zone 5 = 8.6– 22 kHz.
the spectrogram is generated, the image is then filtered, events are detected, and finally the events are classified. Details for each of these steps follow. C. Image filtering
The images are filtered in 3 steps. Initially the images are broken into 4–5 frequency bands within which to look for calls. The image is then sent through a blur filter. Finally, the image is sent through a thresholding filter, where a threshold level is applied independently for each frequency band. The images are broken into 4–5 frequency bands based on relative background noise level. This allows the cutoff threshold of the thresholding filter to be adjusted for each frequency band, allowing calls in other frequency bands that are fainter than the background in the loudest frequency band to stand out. These frequency bands are chosen by calculating the average value of the intensity within the first minute of the spectrogram across all frequencies 共Fig. 3兲. The different frequency bands are chosen by setting their boundaries as the positions which bound the various frequency intensity peaks. Bands are set to group intensity peaks such that intensity minimums are not higher than relative peaks within the band. In Fig. 3, band 3 共3.6 kHz– 7.1 kHz兲 has the most intensity. If it were merged with frequency band 2 or 4, calls in those frequency ranges would not have a high enough dB level to be above the cutoff level of the thresholding filter and would not be detected. In the work presented here, these bands were chosen manually, however this step could be safely automated by using the frequency bin values generated in the first minute of each recording since they stay consistent throughout each of our 10 min canopy recordings. 1. Blur filters
For many loud constant-frequency calls, this filter can be bypassed. However, when the signal to noise ratio drops, bypassing this filter and going straight to the thresholding filter will extract only fragments of full calls. This is shown 2952
J. Acoust. Soc. Am., Vol. 120, No. 5, November 2006
in the long call centered around 5.25 kHz in Fig. 4, where only the first 80% of the call is shown as continuous when the thresholding filter is applied. With a higher signal to noise ratio, the entire call would be revealed as continuous. The event detection algorithm discussed shortly looks for continuous call chunks, and smaller call fragments would not necessarily be grouped together. A remedy for this is to use a filter to blur the image in order to get call fragments to connect. This works very well with a boxcar averaging blur filter applied prior to the thresholding filter, set to slightly blur only in time, not in frequency. With a boxcar averaging filter, the grey-scale value of each pixel in the new image ˜Pr,c in row r and column c is the average of all the initial image pixel values Pr,c within a rectangular swath 共mask兲 centered over it, with width w and height h. With indices i and j, the boxcar averaging filter can be written as h
˜P = r,c
w
兺兺
Pr+i,c+j
i=−h j=−w
共2h + 1兲共2w + 1兲
.
In the work presented here, we set w = 1 and h = 0, creating a slight blur in time, and none in frequency. This is effective for connecting most cricket call fragments. With our sampling rate and spectrogram parameters, this limits our time resolution to be on the order of 10 ms, which is sufficiently long for the crickets we recorded. The results of both the boxcar averaging blur filter with the thresholding filter and the thresholding filter on its own are shown in Fig. 5. The top image is of the spectrogram without any filtering, the middle with a thresholding filter, and the bottom image with both a boxcar averaging blur and thresholding filter. The thresholding filter is applied on the second frequency band. Two calls of the same sonotype are shown. The leftmost call is from a nearby individual, and the rightmost is from a more distant individual. This demonstrates how the signal detection degrades as the signal to noise ratio diminishes. Notice how the rightmost call in Brandes et al.: Detecting narrow-band calls with image processing
FIG. 5. Boxcar averaging blur filter with thresholding filter example. The thresholding filter is used in the bottom 2 images, between 750 Hz– 3.6 kHz. The boxcar averaging blur filter is applied in the lower image. Note how the call fragments of the rightmost call in the middle image are connected to form a continuous call when both filters are applied in the bottom image, allowing easier identification. The call on the left is from an individual of the same species that is closer to the microphone.
FIG. 4. Thresholding filter example. Calls are separated from the background. Note that the lower frequency call 共5.5 kHz兲 in the filtered image 共bottom兲 becomes fragmented toward the end. The louder calls present remain intact in the filtered image. Blurring the image before applying the thresholding filter minimizes call fragmentation.
the thresholding only filter is fragmented, whereas the call is continuous with the boxcar averaging blur filter. Some cricket calls consist of a series of discrete chirps and this pulse train is repeated periodically. In these cases, applying a Gaussian blur filter 2h
2w
兺 兺 Pr+i,c+je−共i /2h 兲e−共j /2w 兲 i=−2h j=−2w 2
˜P = r,c
2
2
2
共4h + 1兲共4w + 1兲
can smooth the pulse train into a continuous dash and facilitate detection. Here, the pixel values of the new image are generated on a weighted average 共based on a normalized Gaussian distribution兲 of the pixel values of the initial image within a particular swath centered over each pixel. This can be seen in Fig. 6 with the sonotype consisting of a pulse train near 3 kHz. Images on the left are without the blur filter and the ones on the right are made with a Gaussian blur filter with w = 3 and h = 0.5. The lower 2 images show how the detection results change once the thresholding filter is applied. In the bottom left image where the blur filter is not used, each individual pulse is detected, whereas in the bottom right image where the blur filter is used, the entire J. Acoust. Soc. Am., Vol. 120, No. 5, November 2006
pulse train is detected as a single unit. In this image it is also interesting to see how the 5.5 kHz sonotype stands out more prominently from the background as the image is blurred. In the work presented here, we chose to use both of these blur filters empirically, based on their performance, and in the detection process, they are each run independently on all the sounds and are used to detect different sonotypes. In this way, the type of blur filter used serves as one of the features or parameters with which to classify a sonotype. 2. Thresholding filter
The purpose of the thresholding filter is to set a threshold of an intensity level required to consider a call present, and to condition the image for the event detection process. This process is done for each frequency band independently, each with a slightly different threshold level. The threshold level for each frequency band is set as an intensity level relative to the sound present in that frequency band 共based on a running 10 s average兲. For the sound shown in Fig. 3, the sound level is a little higher in bands 3 and 4 than in bands 2 and 5, and a threshold level of 8 dB relative to the within-frequency band sound level is used, whereas a 9 dB threshold is used in bands 2 and 5. No known sonotypes from the site are low enough in frequency to be in band 1, so a threshold level on that band was not set. Adjusting the threshold levels slightly depending on the signal to noise ratio allows the calls to stand out better; however, keeping the threshold level at 8 dB would have produced good results. For the work presented here, these threshold levels were chosen manually, and better results might be obtainable
Brandes et al.: Detecting narrow-band calls with image processing
2953
FIG. 6. Gaussian-blur with thresholding filter example. The blur filter is applied to the images on the right. In the lower images, a thresholding filter is applied. Note that when both filters are applied, the entire pulse train is selected as the event, not just the individual pulses as in the bottom left image. This facilitates the call recognition process. Also notice how the sonotype at 5.5 kHz is more prominent in the blurred image. This shows how blurring can make a pattern more pronounced.
in an automated process by running the same sections at a range of threshold levels and using the results that yield the most events. D. Event detection
After the filtering, a block detection algorithm is run to find events within the spectrogram that might be cricket calls. This algorithm goes through the filtered image keeping track of blocks of nonblank pixels that meet specific structural requirements based on 4 parameters: maximum bandwidth 共8 pixels, 689 Hz兲, maximum time allowed to exceed bandwidth 共4 pixels, 23 ms兲, minimum duration 共3 pixels, 17 ms兲, and maximum duration 共241 pixels, 1.4 s兲. The values for these parameters are set near the extreme values of the collection of sonotypes to minimize computation time on events that will not be classified as known sonotypes. During the exploratory phase, when sonotype ranges are being determined, this added efficiency can lead to missed calls. Since we are looking for constant-frequency calls, there is an additional constraint that as the image is swept along the time axis, at least one pixel in the current time band must fit within the frequency bandwidth swept out to that point by the event. This allows the event bandwidth to increase throughout a call, but does not allow it to capture steep sweeping calls; though, it could be modified to do so. The “maximum time allowed to exceed bandwidth” parameter allows short-time broadband noise such as a rain drop to not interfere with detecting a call. E. Event classification
Once the events in the spectrogram are detected, features are automatically measured from these pixel clusters and the calls are classified as particular sonotypes, or as unknown events. The features measured from each event are the central frequency, bandwidth, duration, and type of blur filter used. These features separate the sonotypes recorded at our site with little overlap, and we designed a Bayesian classifier to label events as belonging to particular sonotypes. Distributions of the features of the training set of sonotypes are used to generate 95% confidence intervals for these features 2954
J. Acoust. Soc. Am., Vol. 120, No. 5, November 2006
for each sonotype, and these intervals serve as the decision bounds for the classifier. For the sonotypes we recorded enough times to both train and test, these 4 features completely separate each sonotype. However, for 2 of the sonotypes that we recorded in too low of number to both train and test the classifier, the additional features of the time gap between similar calls as well as the number of similar calls in a pulse train are required to fully separate these sonotypes from others. Since we have very few recordings of these sonotypes, these 2 additional features were not automatically generated in our testing sets, and these additional sonotypes went undetected in our testing trials 共none were even detected manually兲. III. FIELD RESULTS
Twenty-two distinct constant-frequency sonotypes were identified from the site. Two sonotypes, ST101 and ST102, are from frogs, whereas the remaining sonotypes are from crickets. Most of the sonotypes are separable with the central frequency, duration, and blur filter used. Figure 7 shows the distribution of training samples for the 22 sonotypes recorded, plotted as central frequency vs duration. A Gaussian blur filter is used to find sonotype 2; each of the other 21 sonotypes are found by applying a boxcar averaging blur filter. A 95% confidence interval of the distribution of each sonotype is shown as an ellipse over the distribution points. A few of the ellipses have some overlap 共ST 15, ST 22, ST 23兲 and require additional features for separation. These 95% confidence intervals serve as the decision boundaries for the Bayesian classifier. Only 1 call for sonotype 8 and 9 was found, so the arbitrarily set confidence interval around them only serves to show the approximate bounds with which to try to detect those calls 共no additional calls were found for either sonotype兲. A confusion matrix for the 17 sonotypes recorded enough times to both train and test, separated with only 4 features 共central frequency, duration, bandwidth, and blur filter兲, is shown in Table I. Sonotypes 6, 8, 9, 14, and 15, present in Fig. 7, were not found enough times to do both training and testing, and are absent from Table I. “Unknown” Brandes et al.: Detecting narrow-band calls with image processing
TABLE II. Accuracy measures for 17 sonotypes based on the confusion matrix in Table I.
ST ST ST ST ST ST ST ST ST ST ST ST ST ST ST ST ST
FIG. 7. 共Color online兲 Two of the features used to separate sonotypes, central frequency and call duration, are shown for 22 sonotypes. The estimated 95% confidence interval around the distributions are represented by ellipses. Gaps between the sonotypes indicate possible openings for additional species we did not record.
1 2 7 10 11 12 13 16 17 18 19 20 21 22 23 101 102
True positive
False negative
Train/test detections 共N兲
97.78% 100% 100% 100% 100% 100% 98.15% 100% 100% 100% 100% 100% 100% 100% 100% 100% 100%
78.85% 17.86% 71.55% 25.00% 26.32% 17.85% 24.64% 67.82% 11.58% 42.78% 38.89% 08.62% 41.30% 08.33% 37.50% 68.42% 42.16%
3 / 44 25/ 46 290/ 865 20/ 114 8 / 28 50/ 336 75/ 159 24/ 65 298/ 741 56/ 226 15/ 55 40/ 371 12/ 27 50/ 363 10/ 35 7/6 279/ 834
ture values overlap provides insight into how accurate the classifier is. With no overlap in these distributions, the classifier will be 100% accurate in its classifications. The shape of the collective distribution of sonotype features and the degree to which this area is filled with sonotypes is also noteworthy. The sonotype feature distributions collectively in Fig. 7 appear bound by a curve, limiting cricket calls between approximately 3 kHz and 12 kHz, and allowing a wider range of call durations at the lower frequencies, gradually shortening maximum call duration up to the 12 kHz calls. It is likely that the bounds of this curve are determined by the stridulatory apparatus of the crickets at our site. If the area of usable feature space is bound by cricket physiology, then the degree to which this area is saturated with cricket sonotypes might be insightful in determining the degree to which the ensemble of cricket species at a site have remained
calls are defined as events that have feature values outside of the estimated ranges of the sonotypes defined by the training set. Since many crickets call in pulse trains, instead of choosing training and testing sets randomly, entire pulse trains were used for either training or testing. This was done by designating the first samples of sonotypes found within sound files manually as the training set, and sonotypes found manually in subsequent files as the testing set. Accuracy percentages from the confusion matrix are shown in Table II, along with the number of training and testing samples. Sample number of test detections are counted as the number of correct detections of a sonotype during the testing phase. IV. DISCUSSION
One of the interesting aspects of the sonotypes in Fig. 7 is their distribution. The degree to which the sonotype fea-
TABLE I. Confusion matrix for 17 sonotypes. Actual classifications are in the leftmost column, and the assigned classifications in the topmost row. Correct identifications are indicated on the diagonal. Events labeled as “unknown” by the classifier are shown in the column labeled “UNKN.”
UNKN ST1 ST2 ST7 ST10 ST11 ST12 ST13 ST16 ST17 ST18 ST19 ST20 ST21 ST22 ST23 ST101 ST102
UNKN
ST1
ST2
ST7
ST10
ST11
ST12
ST13
ST16
ST17
ST18
ST19
ST20
ST21
ST22
ST23
ST101
ST102
32 164 10 2175 38 10 73 52 134 97 169 35 35 19 33 21 13 608
1 44 0 0 0 0 0 0 0 0 0 0 0 0 0 0 0 0
0 0 46 0 0 0 0 0 0 0 0 0 0 0 0 0 0 0
0 0 0 865 0 0 0 0 0 0 0 0 0 0 0 0 0 0
0 0 0 0 114 0 0 0 0 0 0 0 0 0 0 0 0 0
0 0 0 0 0 28 0 0 0 0 0 0 0 0 0 0 0 0
0 0 0 0 0 0 336 0 0 0 0 0 0 0 0 0 0 0
0 0 0 0 0 0 0 159 3 0 0 0 0 0 0 0 0 0
0 0 0 0 0 0 0 0 65 0 0 0 0 0 0 0 0 0
0 0 0 0 0 0 0 0 0 741 0 0 0 0 0 0 0 0
0 0 0 0 0 0 0 0 0 0 226 0 0 0 0 0 0 0
0 0 0 0 0 0 0 0 0 0 0 55 0 0 0 0 0 0
0 0 0 0 0 0 0 0 0 0 0 0 371 0 0 0 0 0
0 0 0 0 0 0 0 0 0 0 0 0 0 27 0 0 0 0
0 0 0 0 0 0 0 0 0 0 0 0 0 0 363 0 0 0
0 0 0 0 0 0 0 0 0 0 0 0 0 0 0 35 0 0
0 0 0 0 0 0 0 0 0 0 0 0 0 0 0 0 6 0
0 0 0 0 0 0 0 0 0 0 0 0 0 0 0 0 0 834
J. Acoust. Soc. Am., Vol. 120, No. 5, November 2006
Brandes et al.: Detecting narrow-band calls with image processing
2955
intact. Gaps in feature space could also be due to lack of time spent collecting recordings for an area, and sonotype overlaps could occur without causing interference problems if those species seldom call at the same time of day or year. Interesting gaps that exist in Fig. 7 include the frequency range between 8.6 kHz and 11.7 kHz, and calls over 0.3 s long between 3.6 kHz and 5 kHz. Implications for these gaps require further study. For most sonotypes shown in Fig. 7, the duration varies more than central frequency. Some of this is an accurate representation for the variation in call length, such as for sonotype 16. For other sonotypes, such as sonotype 2, the lower end of the distribution is a little misleadingly stretched. When the sonotypes are recorded with a high signal to noise ratio, their features are measured accurately. However, when the sonotype is fainter, only fragments of the call are detected. The blur filter goes a long way towards connecting these fragments, but with sonotype 2 in particular, the intensity of the call increases throughout the duration of the call 共Fig. 6兲 and the measured duration of the call will vary depending on how loud the quieter beginning of the call is 共how far away the insect is from the microphone兲. By accepting a larger range in the call duration, the Bayesian classifier is able to detect more distant individuals than it would otherwise. By increasing the acceptable range of a feature like this, the possibility of misclassification increases if the range of features of different sonotypes begin to overlap. To avoid misclassification in this situation, additional features are needed. Sonotype 2 is the only sonotype listed that is measured after a Gaussian blur is applied, so the use of the filter itself would safely allow accurate classification if sonotype 2 had feature distributions that overlapped different sonotypes. The central frequency of the sonotypes have some spread to them, some more than others. The variation captured in Fig. 7 mostly reflects the variation within a pulse train and the variation between individuals. Air temperature can play a large role in central frequency shift of a sonotype but did not for the work presented here since the air temperature during the recordings varied little within the extremes of 22.5 ° C and 24.4 ° C. In cases where air temperature can change more dramatically, training set sonotypes need to be recorded at multiple temperatures. Central frequency does not noticeably shift as a function of air temperature for all cricket species, but for the species that air temperature does affect this way, the shift in central frequency is linear.24,25 For these sonotypes, once the linear relationship between central frequency and air temperature is found, air temperature during a recording should be used as a parameter to estimate the acceptable distribution of central frequencies for these sonotypes when trying to detect them. A. Improving performance
The approach to ACR described in this work very accurately identifies our sonotypes, but the emphasis is clearly on keeping a high true-positive accuracy at the expense of falsenegative accuracy. Our application is in monitoring sonotypes from canopy recordings, and since most crickets call in 2956
J. Acoust. Soc. Am., Vol. 120, No. 5, November 2006
pulse trains, presence and absence can be readily determined even by detecting only some of the pulses in those pulse trains. In general, there is no need to detect each call within the entire sequence of calls. Two separate sources of error arose to lower the true-positive accuracy in 2 sonotypes down from 100%, although still above 97.5% 共Table II兲. In one instance, a consecutive string of sonotype 102 calls completely overlapped to create an event that matched sonotype 1. In the other instance, a few faint calls of sonotype 16 had degraded to the point that they resembled the shorter and smaller bandwidth calls of sonotype 13. Each of these instances point out how the duration and bandwidth features detected from events can lead to some misclassifications with sonotypes that have overlapping central frequency distributions. To decrease these misclassifications, additional features such as the time gap between similar events and the number of similar events within a specified amount of time 共duration of a pulse train兲 can be used to make accurate identifications. These features look to have little variance for many of the sonotypes, particularly the short duration ones which are more likely to lead to misclassifications. To detect these features, most of the calls within a sequence of calls will need to be detected. Call sequences recorded with a high signal to noise ratio have enough of their calls detected to measure these features. Requiring these features for classification would increase the false-negative percentage for these sonotypes, but would also improve the true-positive percentage to nearly 100%. Most crickets call in a rather continuous pulse train, and when trying to establish the presence or absence of sonotypes, it is not necessary to detect each call within a pulse train, only some of them. Table II shows that the falsenegative classification percentage of 4 sonotypes is above 50%. While not generally a problem when detecting presence or absence of a sonotype, it is desirable for these percentages to be lower. The reason for these high values is mostly due to not having a wide enough distribution of feature values for those sonotypes. For sonotypes 1 and 101, this is likely due to having small training sets 共N = 3 and 7, respectfully兲. The other 2 sonotypes, ST7 and ST16, have many more training samples, but they are likely not varied enough. Each training set was chosen as the first sonotype instances encountered, not randomized from a group of known instances. Randomizing this training process would likely allow the feature distributions for these sonotypes to be expanded while keeping the number of training samples the same. B. Finding novel calls
When looking at class distributions similar to the ones shown in Fig. 7, the possibility of using clustering techniques to determine class boundaries in an automated way looks intriguing. In this paper, the class assignment of the training sonotypes is done manually by grouping calls that look nearly identical and are often part of a continuous series of call sequences, and they are presumed to come from the same species. If the training was done with isolated calls recorded with a high signal to noise ratio, using automated Brandes et al.: Detecting narrow-band calls with image processing
clustering techniques might well be possible. The training sets, though, are created from field recordings with various background sounds. This results in miscellaneous noises being classified as events along with sonotypes. Since the sonotypes are not necessarily more numerous than miscellaneous noises, the events are manually classified. After the training phase, clustering of unknown calls might provide an automated way to find novel calls, at least those that have a duration longer than 0.2 s. Most of the unknown events are short in duration, and applying a minimum duration filter goes far towards weeding out events that are not novel sonotypes. Once enough of these filtered events are found, a clustering method such as from Diday26 might be useful in finding clusters that correspond to novel sonotypes. A dynamic clustering method such as this would likely be a good choice since it allows the clusters to be elongated, as many of the manually classified sonotype clusters are. V. CONCLUSIONS
The ACR process described in this paper detects constant-frequency cricket and frog calls with a high truepositive accuracy. The accuracy of this approach largely depends on how comprehensively sonotypes are known for an area, and to what extent the sonotype feature values overlap. The success of this process shows that image processing techniques applied to spectrogram images can provide a useful approach in ACR applications. This process works with recordings made in tropical forests, where multiple species can call simultaneously and numerous background noises are present, and can be used to monitor presence or absence of cricket species that have constant-frequency calls, or relative abundance measures if there are multiple recording locations. Potential for misclassification of cricket sonotypes is largely dependent on how complete the libraries of cricket calls for an area are, and how well variation in those calls is known. The more complete an understanding there is for the type of calls that can be encountered, the more accurately the feature-space can be partitioned for each sonotype, and the more accurately the automated process will run. ACKNOWLEDGMENTS
We would like to thank the Gordon and Betty Moore Foundation for funding this work through the Tropical Ecology, Assessment and Monitoring 共TEAM兲 Initiative in the Center for Applied Biodiversity Science at Conservation International 共CI兲. We would also like to thank the Bioacoustics Research Program 共BRP兲 at the Cornell University Lab of Ornithology for the helpful suggestions and insight from their engineers, as well as for providing their eXtensible BioAcoustics Toolbox 共XBAT兲, custom designed software for developing sound recognition algorithms that runs within MATLAB®, and their custom designed 16-element microphones and preamplifier that we acquired through an ongoing collaboration CI has with the BRP lab. 1
P. F. Fischer, U. Schulz, H. Schubert, P. Knapp, and M. Schmöger, “Quantitative assessment of grassland quality: Acoustic determination of population sizes of Orthopteran indicators species,” Ecol. Appl. 7, 909–920
J. Acoust. Soc. Am., Vol. 120, No. 5, November 2006
共1997兲. W. J. Bailey, Acoustic Behaviour of Insects. An Evolutionary Perspective 共Chapman and Hall, London, 1991兲. 3 K. Riede, “Acoustic monitoring of Orthoptera and its potential for conservation,” Journal of Insect Conservation 2, 217–223 共1998兲. 4 T. J. Walker, “Cryptic species among sound-producing ensiferan Orthoptera 共Gryllidae and Tettigoniidae兲,” Q. Rev. Biol. 39, 345–355 共1964兲. 5 D. Otte, “The crickets of Hawaii: Origin, systematics and evolution,” Orthopterists’ Society, Philadelphia, pp. 1–396 共1994兲. 6 D. R. Ragge and W. J. Reynolds, The Songs of the Grasshoppers and Crickets of Western Europe 共Harley, Colchester, 1998兲. 7 L. Desutter-Grandcolas 共personal communication兲. 8 D. Otte 共personal communication兲. 9 C. Froehlich and E. Holtzem, “Eine neue Methode zum Auffinden und Bestimmen von Heuschrecken 共Saltatoria兲 im Freiland,” Z. angew. Zool. 74, 501–503 共1987兲. 10 F. Nischk and K. Riede, “Bioacoustics of two cloud forest ecosystems in Ecuador compared to lowland rainforest with special emphasis on singing cricket species,” in Epiphytes and Canopy Fauna of the Otongan Rain Forest (Ecuador). Results of the Bonn-Quito Epiphyte Project, Funded by the Volkswagen Foundation, edited by J. Nieder and W. Barthlott 共2001兲, Vol. 2, pp. 217–242. 11 N. Vaughan, G. Jones, and S. Harris, “Identification of British bat species by multivariate analysis of echolocation call parameters,” Bioacoustics 7, 189–207 共1997兲. 12 S. Parsons and G. Jones, “Acoustic identification of 12 species of echolocating bats by discriminant function analysis and artificial neural networks,” J. Exp. Biol. 203, 2641–2656 共2000兲. 13 S. Parsons, “Identification of New Zealand bats in flight from analysis of echolocation call by artificial neural networks,” J. Zool. 253, 447–456 共2001兲. 14 S. E. Anderson, A. S. Dave, and D. Margoliash, “Template-based automatic recognition of birdsong syllables from continuous recordings,” J. Acoust. Soc. Am. 100, 1209–1219 共1996兲. 15 J. A. Kogan and D. Margoliash, “Automated recognition of bird song elements from continuous recordings using dynamic time warping and hidden Markov models: A comparative study,” J. Acoust. Soc. Am. 103, 2185–2196 共1998兲. 16 A. Taylor, G. Watson, G. Grigg, and H. McCallum, “Monitoring frog communities: An application of machine learning,” in Proceedings of the 8th Innovative Applications of Artificial Intelligence Conference 共1996兲, pp. 1564–1596. 17 E. D. Chesmore, O. P. Femminella, and M. D. Swarbrick, “Automated analysis of insect sounds using time-encoded signals and expert systems-A new method for species identification,” in Information Technology, Plant Pathology and Biodiversity, edited by P. Bridge, P. Jeffries, D. R. Morse, and P. R. Scott 共CAB International, Wallinford, 1998兲, pp. 273–287. 18 E. D. Chesmore, “Application of time domain signal coding and artificial neural networks to passive acoustical identification of animals,” Appl. Acoust. 62, 1359–1374 共2001兲. 19 C. Dietrich, G. Palm, K. Riede, and F. Schwenker, “Classification of bioacoustic time series based on the combination of global and local decisions,” Int. J. Pattern Recognit. Artif. Intell. 37, 2293–2305 共2004兲. 20 C. Xu, N. C. Maddage, and X. Shao, “Automatic music classification and summarization,” IEEE Trans. Speech Audio Process. 13, 441–450 共2005兲. 21 L. R. Rabiner and B. H. Juang, Fundamentals of Speech Recognition 共Prentice-Hall, New Jersey, 1993兲. 22 K. Riede, “Bioacoustic monitoring of insect communities in a Bornean rain forest canopy,” in Canopy Arthropods, edited by N. E. Stork, J. Adis, and R. K. Didham 共Chapman and Hall, London, 1997兲, pp. 442–452. 23 T. S. Brandes, “Acoustic Monitoring Protocol,” Tropical Ecology Assessment and Monitoring 共TEAM兲 Initiative set of biodiversity monitoring protocols, Center for Applied Biodiversity Science, Conservation International 共2005兲, http://www.teaminitiative.org 共navigate to “Protocols”兲 共last visited September 2006兲. 24 T. J. Walker, “Factors responsible for intraspecific variation in the calling songs of crickets,” Evolution 共Lawrence, Kans.兲 16, 407–428 共1962兲. 25 H. C. Gerhardt and F. Huber, Acoustic Communication in Insects and Anurans, Common Problems and Diverse Solutions 共University of Chicago Press, Chicago, 2002兲. 26 E. Diday, “The dynamic clusters method in nonhierarchical clustering,” Int. J. Comput. Inf. Sci. 2, 61–68 共1973兲. 2
Brandes et al.: Detecting narrow-band calls with image processing
2957