(Vanclay 1990a). However, the important issue is to identify the real information .... Natural Resource Monitoring and Assessment: Preparing for the 21st century,.
Preprint of: J.K. Vanclay, 2002. Using information systems to support natural forest management. In: D.B. Gurung and U. Dorji (eds) Silviculture and Sustainable Management of Mixed Broadleaved Forest in the Himalayas. BG-SRDP Project Document No 69, p.1-6.
Using information systems to support natural forest management Jerome K. Vanclay Southern Cross University, PO Box 157, Lismore 2480, Australia
Introduction Too often, forest management information is driven by available data rather than by needs. Books and other resources place lots of emphasis on forest inventory techniques, but little on how to present the resulting information in a meaningful way. Forest agencies generally spend much more time and effort in collecting data than in analyzing these data. This can be misguided, and will probably have to change, if only because the costs of collecting data continue to increase relative to the cost of analysis (Vanclay 1990a). However, the important issue is to identify the real information needs rather than to focus on the data that is easy to collect. Real issues for management The real question that should be asked is “What information is needed to manage the forest better?” The data needed to provide that information should be a secondary consideration. We should establish quite specifically what information we want, and then find a clever way to collect the data to address these needs. The primary question should not be “What can we do with these data?”, or even “What can we conclude from these data?”, but “What information do we need to manage the forest better?” and “What information would make us do things differently?” The latter question is an instructive one, as it is a reminder that when there are other compelling and enduring reasons for a particular management regime (e.g., religious requirements), inventory may be redundant since it may not lead to any change in management. One way to explore these questions is to consider what the forest will look like in the future under the present management regime. This raises two other important issues — What we want our forest to look like in the future, and perhaps more importantly, what are our real objectives of management. Do we want to attain or maintain a particular stand structure; do we want to improve the average form of trees in the stand; or do we want to modify the species composition of the stand? Once we have resolved these questions, in effect our performance criteria, we need to turn our attention to the forest: Is it growing the way we expect? To explore this question, we can compare predictions against observations, or can monitor change in permanent plots. Monitoring should cover all aspects of forest dynamics, including increment, mortality, defect, the amount and composition of recruitment.
Presenting information It is not enough merely to ask the right questions, nor is it sufficient simply to provide the data to answer these questions. The data need to be synthesized into useful information and presented in an appropriate format. Detailed tables may be appropriate for inventory specialists, but busy managers may need simple summaries that can be comprehended quickly. The challenge then, is to present sufficient information in a way that is clear, concise and unambiguous. Asking forest managers to state their information requirements is ineffective, since they may not appreciate what is possible. A better understanding of real information requirements can be obtained by creating a prototype and then iteratively discussing and refining it with intended users. This is the approach that was adopted in developing the Queensland Native Forest Information system, a system that has stood the test of time and received critical acclaim in several independent reviews. This system was designed for maximum flexibility, allowing outputs to be presented in a variety of formats and loaded into spreadsheets and other packages for further processing and final presentation (Vanclay 1990b). Extensive tabular data rarely offer effective communication. Since “a picture tells a thousand words”, diagrams can be a compact way to convey information about a forest. However, care is required to ensure that diagrams convey the desired information reliably, and are objective and repeatable. Pictorial sketches and forest profile diagrams tend to be subjective and while they may be useful to emphasize selected ecological characteristics of the forest, they have limited ability to convey quantitative detail. Graphs and similar diagrams offer more effective ways to illustrate numerical data (e.g., Tufte 1983). Diagnostic and influential information One of the most effective and influential diagrams prepared within the Queensland Forest Service, was a simply photocopy of a forest estate map, hand-coloured to show the area of forest logged within each 5-year period. This provided an efficient indication of the progress of harvesting, and facilitated comparisons with the intended cutting cycle. Provided that reasonable records have been maintained, such maps are quick and easy to prepare, and can be very effective. After the extent of the forest has been documented, the next most influential information relates to stand density. Density can be summarized as stand basal area, and trend lines can show temporal changes. However, this isn’t very informative. It is usually more interesting to draw stand tables for each of a number of strata or time periods. When comparing stand tables in this way, it is usually better to draw line graphs rather than the customary histograms (Figure1). Korsgaard (1992) pointed out that the traditional stand table places disproportionate emphasis on the smallest stems, and that logarithmic scales may be more difficult to interpret. He advocated plotting the stand basal area within each class (Figure 2), and noted that for undisturbed and well-managed dipterocarp forests in Malaysia, there tended to be an equal basal area in each class. Unequal classes were indicative of past disturbance, and a shortfall in the larger size classes was characteristic of recent harvesting (often unauthorized logging).
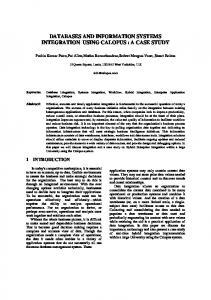
Year 0 Year 50
1000
100
10
1 1000
Yr 0 10 20 30 40 50
100
10
1 0
20
40
60
80
100
Figure 1. Stand tables for Nothofagus forest in New Zealand at year 0 (inventory data) and simulated for year 50. Figure 1a (top) shows two traditional histograms in juxtaposition, as generated by the Excel spreadsheet package. It is not easy to assess the differences. Figure 1b (bottom) shows the same data, plus some intermediate results, presented as a line graph, enabling subtle changes to be discerned. Both figures present the number of stems/hectare in 10 cm dbh size classes.
120
Basal area (sq m/ha)
4
0 1
2
3
4
5
6
7
8
9
10
11
Size class
Figure 2. It is sometimes informative to plot basal area within size classes rather than the number of stems or the logarithm of the number of stems, as this may be easier to interpret. The data presented here are the same as the Year 0 data illustrated in Figure 1. Unlike the dipterocarp forest reported by Korsgaard (1992), this Nothofagus forest does not appear to have equal basal area in each size class.
Forest managers usually try to maintain biodiversity while producing wood and other goods and services. There is some evidence that the vertical structure of a forest is a good indicator of its potential biodiversity, so a figure illustrating changes in vertical structure (e.g., MacArthur and MacArthur 1961) may be a useful way for foresters to monitor their performance in this regard. Commercial considerations warrant similar figures illustrating stand volumes, growth rates, and the ability to meet supply commitments. Figure 3 illustrates one of the most effective items of information that I have ever produced. The full story is told elsewhere (Vanclay 1996a,b); the important message here is that politicians and senior bureaucrats want graphic summaries. Stratification In preparing any of the figures discussed above, it is important to use a suitable stratification. A good stratification system will highlight differences in stand condition, while poorly defined strata will obscure differences. To establish appropriate strata, it is necessary to anticipate potential problems, to recognize emerging issues, and to understand ecological processes. The quality of a stratification scheme can be tested empirically: the within-strata variability should be less than the between-strata variability, at least with respect to the parameters of interest. Precision can be gained by dividing the population into as many blocks as expedient, even though the number of sampling units taken from each may be the minimum of two (Schumacher and Chapman 1954).
Figure 3. Historic and predicted timber yields from north Queensland rainforests (Vanclay 1994).
Conclusion This brief review makes no attempt to be comprehensive, but rather offers some suggestions for better linkages between inventory, silviculture and forest management, and in doing so, seeks to make inventory more efficient and management more effective. Be innovative in thinking up effective ways to portray and communicate information. Try new things, test them on your clients and assess their reactions, and refine your ideas iteratively until you establish approaches that provide information that is both diagnostic and influential. References Korsgaard, S., 1992. An analysis of growth parameters and timber yield prediction based on research plots in the permanent forest estate of Sarawak, Malaysia. Council for Development Research, Copenhagen. MacArthur, R.H. and MacArthur, J.W. 1961. On bird species diversity. Ecology 42, 594598. Schumacher, F.X., and R.A. Chapman, 1954. Sampling methods in forestry and range management. Duke University School of Forestry, Bulletin 7. 222 p.
Tufte, E.R., 1983. The Visual Display of Quantitative Information. Graphics Press, Cheshire CT, 197 pp. Vanclay, J.K., 1990a. Integrated resource monitoring: current trends and future needs. In: H.G. Lund and G. Preto (eds) Global Natural Resource Monitoring and Assessment: Preparing for the 21st century, Proceedings of the international conference and workshop, Sept 24-30, 1989, Venice, Italy. American Society for Photogrammetry and Remote Sensing, Bethesda, USA, p. 650-658. Vanclay, J.K., 1990b. Design and implementation of a state-of-the-art inventory and forecasting system for indigenous forests. In: H.G. Lund and G. Preto (eds) Global Natural Resource Monitoring and Assessment: Preparing for the 21st century, Proceedings of the international conference and workshop, Sept 24-30, 1989, Venice, Italy. American Society for Photogrammetry and Remote Sensing, Bethesda, USA, p. 1072-1078. Vanclay, J.K., 1994. Modelling Forest Growth and Yield: Applications to Mixed Tropical Forests. CAB International, Wallingford, U.K. 312 p. Vanclay, J.K., 1996a. Lessons from the Queensland rainforests: Steps towards sustainability. Journal of Sustainable Forestry 3:1-17. Vanclay, J.K., 1996b. Estimating Sustainable Timber Production from Tropical Forests. CIFOR Working Paper No 11, 25 p.