International Journal of Advanced Science and Technology Vol. 45, August, 2012
Using Instructive Data Mining Methods to Revise the Impact of Virtual Classroom in E-Learning Mohamed Fahad AlAjmi1, Shakir Khan2 and Abu Sarwar Zamani3 1
2
Vice dean for development and quality Prince Sultan College for EMS King Saud University, Riyadh Saudi Arabia
Researcher at King Saud University’ e-Learning Deanship, Riyadh Saudi Arabia 3
Dept. of Computer Science Shaqra University, Kingdom of Saudi Arabia
[email protected],
[email protected],
[email protected] Abstract In the past few years, Saudi universities have boarded to utilize e-learning tools and technologies to expand and look up their educational services. After a few years of carrying out e-learning programs, a discussion took place within the directors, supervisors, executives and managers or decision makers of the e-learning associations regarding which activities are the most impact on the learning development for online students. This research is expected to inspect the impact of a number of e-learning actions on the students’ learning development. The results show that involvement in virtual classroom sessions has the most considerable impact on the students’ final scoring or grade. This paper presents the procedure of applying data mining methods to the web observing records of students’ behaviors in a practical learning environment. The main idea is to rank the learning activities supported on their importance in order to develop students’ performance by focusing on the most important ones. Keywords: e-Learning, Data mining Methods, Virtual Classroom, Teaching
1. Introduction All through the past decades, since the important benefits it conveys for all participants, the utilization of information and communication technologies in the instructive domain has become well-known all around the world. Particularly in Saudi, according to the efficient role of education in the national improvement plan, these types of training depicted more attention from the major and prominent universities. Thus, they started to set up e-learning departments one after another. Due to the deficiencies and shortcomings of the e-learning stages in the early years, there were many unsolved problems which disturbing both students and teachers performance. First of all, lack of teamwork and communication facilities due to which students feeling alone and unsupported. In addition, their educational inclination to instructor led learning provided reason to face new challenges understanding self-paced education materials. These troubles inspired e-learning departments to employ web conferencing and virtual collaboration tools to keep happy the students’ stress. This paper presents the key findings that resulted from studying the e-learning behaviors and their contact on students’ final grades. The structure of the paper is prepared as follows: Section 2 presents a literature review and the associated works. Section 3 outlines a background of the e-learning stage and the students’ learning activities. Section 4 explains the methodology utilized to carry out the
125
International Journal of Advanced Science and Technology Vol. 45, August, 2012
study and analyses the outcomes using a decision tree. Finally, conclusions and future works are represented in Section 5.
2. Associated Work Occasionally the word Virtual Classroom is taken as the complete e-learning process or all the teacher-student communications. However, in this paper the word is utilized for online synchronous effective meetings which are performed by the contribution of the teacher and students applying audio and video conferencing equipments. There is a restricted amount of research focused on the impact of these expertise based upon the learning effectiveness. In dissimilarity, there are a major numbers of studies which have observed the role of other activities in the development of learning via data mining methods. In what follows an analysis on the most important studies is presented. Bower and Richards [3] carried out the study on the impact of virtual classroom laboratories in computer science tutoring. The key idea of this research was to study the educational aspects of these technologies; as a consequence they proved that such virtual laboratories are useful mainly in the area of computer science. Also, another research by Redferm and Naughton [11] discusses and approves the encouraging role of video conferencing technologies in web based education. This study mainly focuses on the creation of brainstorm style-discussions and small group meeting which are basic to many of recent educational techniques. From another viewpoint, some researchers have utilized web usage mining to come across students’ activities in web based learning environments. One of the most important studies carried out by Zaïane and Lou [18], employed these methods to progress the benefits of an e-learning environment. In [16], web usage data of students is used to gather them based on ‘Expectation Maximization’ (EM) algorithm. Each group represents a bunch of students with similar activities. Furthermore, the results are utilized to provide the students appropriate advices with respect to their group. The EM algorithm is also utilized in [15] to remove similar behavioral blueprint of students in a mutual unstructured e-learning environment. Minaei-Bidgoli and Punch [8], used genetic algorithms and a mixture of multiple classifiers to forecast students’ final grades. In [5] and [9], different machine learning and categorization techniques were applied in order to forecast the students’ final score; the significance of each feature is also assessed. This work was extended in [4] and Artificial Neural Networks were used to forecast students’ final grades. Beck and Mostow [2], had a different approach toward studying the students’ performance data. They used a method called ‘Learning Decomposition’ to evaluate students’ success ratio based on the amount of educational support they received. The most important point in all the studies is that predicting students’ final score based on their online activities is the leading approach to examine the effectiveness of e-learning.
3. The Stages The E-Learning Department of King Saud University started its services in 2010 with few students and is currently serving in most of the department by identifying its importance. The instructional planning in this department is intended in a way that the learning materials are primarily developed in the appearance of multimedia courseware and it can be accessed by students ever day bases. Additionally, the teacher can append additional resources to the learning content and assess the process of learning by giving the students with homework and online questions in the way of quizzes. By gaining suitable awareness about the course conception, the students take part in a virtual classroom session so as to talk about the lessons
126
International Journal of Advanced Science and Technology Vol. 45, August, 2012
with the teacher and other students. The instructor can also present corresponding information and gain feedback about the students’ learning development. After few years of using commercial products as virtual learning environment or blackboard, the E-Learning unit of Prince Sultan College for EMS of King Saud University started to build its own e-learning platform named as Prince Educator Gateway based on Moodle, a free of charge open-source Learning Management System (LMS). Moodle is planned to support the learning approach of Social Constructivism, in which the procedure of learning is carried out by a set of exchanges between students, teacher, and learning materials [12]. This approach is not compulsory in Moodle but is what it supports best. There are different kinds of activities which students can carry out in a course such as: viewing courseware, uploading assignments or homework, chatting, posting messages in forums, writing messages to teachers and other students, etc. The system maintains detailed information about the way students interrelate with the systems which have encouraged lots of researchers to utilize these data to be valid knowledge discovery and data mining methods to remove helpful information about the students learning performance [7, 13, and 14]. Although there are lots of activities such as forums, messaging, quizzes and text chat to support interaction of teachers and students, a stylish synchronous teamwork tools in Moodle is still missing. Consequently, the e-learning unit of Prince Sultan College for EMS of KSU introduced a new module to its Moodle based Prince Educator Gateway to perform virtual classrooms. The module was developed supported on Adobe Flash Platform [1] considering its good-looking interface and low bandwidth supplies, making it appropriate for students connecting from their homes or from different location of the country. For each course, instructor can create a session for his student group which is conducted on the specific time defined by instructor during creation of session. During the session, special levels of interaction such as using video, audio, whiteboard, document sharing, and text chat can be utilized depending on the necessities of the lesson. For example, the teachers can distribute a power point slide or just use a virtual whiteboard to represent the content as well as broadcasting their own voice and video. Students mainly use text chat to work together with the teacher and asking questions. It is also promising for teachers to authorize the students sending their voices. To support the “any-time, any-where” assurance of e-learning, all the conferences are recorded and archived for the students for future reference who cannot participate during online sessions. The students who listens the class can also review the parts of old session they don’t need to follow or understand the instructor. In fact, these recorded lectures can be utilized as a stable learning resource and the students can evaluate them as many times they desire.
4. Methodology Stages 4.1. Key Idea Although Moodle presents different reports on the students’ actions, they are not elastic enough to make happy the instructors’ desires for observing their communications with the system [6]. Additionally, there is no approach for learning technologists and education managers to point out the worth of each activity in achievement of students. As it was pointed
127
International Journal of Advanced Science and Technology Vol. 45, August, 2012
out before, this research aspires to rank web based learning activities supported on their impact on the students’ final grades. Because of this, some variables have been classified as key performance indicators (KPIs) of learners. Then the impact of each variable has been assessed based on its weight on the score of students in the finishing exams. Mainly, data mining techniques have been utilized to investigate the web usage logs of the virtual learning environment to conclude some rules about the significance of each activity in the presentation of students. 4.2. Contributors The current study has been carried out on the web usage logs of the system in Fall Semester 2011, when about 1, 30 students were enrolled in 2 courses. However, the research is incomplete to 500 students in 4 courses; the teachers utilized most of the learning activities; and, the final scores of students were also available. In addition, the students were completely remote from the university and had to learn most of the concepts and practices just by using the system via the Internet. In previous studies [8, 13, 14] the e-learning platform was used to facilitate teacher-student interactions and the online activities of students were not assumed as the most essential part of the learning process. 4.3. Process The common procedure of educational data mining contains of four steps: Collecting Data, Preprocessing, Applying data mining and interpreting the results [13]. Here, a similar procedure has been utilized which follows somewhat different techniques in data collection and preprocessing steps. The two steps are incorporated into a single unlimited stage of constructing a data warehouse from the activity logs of students. This comes up to make it promising to monitor and study the knowledge activities of the students and its appropriate trends more in depth. The use of Data Warehouse and On-Line Analytical Processing (OLAP) tools in e-learning is getting reputation among educational institutions and virtual universities [19]. In this section the whole development of applying data mining methods on the students’ usage information is described. 4.3.1. Constitution the Data Warehouse As it was told before, Moodle maintains complete records of students’ activities. The teachers have access to review reports about students like the date of their first and last logins, and the number of pages visited by these students. The detail about each learning activity is also presented with respect to the categories specified by the system, not by the lecturer or instructor. Accordingly, we planned a model and built a data warehouse to observe the students’ activities in accurate detail. The activities are organized into nine categories: resource view, assignment view, assignment upload, virtual classroom participation, archive view, forum post, discussion read, forum read, and discussion post. Additionally, according to our discussions with training managers of e-Learning unit in the college and instructional technologists, a list of data elements and analytical scope along with the students’ KIPs have been identified. Then, consequent information was pulled out from the Moodle database to reply their questions. Anyway, the information’s of the dimensional modeling are away from
128
International Journal of Advanced Science and Technology Vol. 45, August, 2012
the capacity of this paper. For this study a detail model is being used which collects the information about the recognized business requirements in the form of a synopsis table. Table’s each column represents a dimension significant according to our purpose. Table 1 depicts the plan of the summarized table. A brief explanation of each element is also contained. The formation is quite related to the one which was used in [13] but it includes some other elements based on the KPIs extracted. To promote the level of understanding and to facilitate the lack of confusion, the scores are stored in a discrete format. There are four categories of grades: A, if the value is equal or above 16.6; B, if the value is between 13.3 and 16.6; C, if the value is between 10 and 13.3; and F, if the value is less than 10. Table 1. Table of Students Behaviors Name CourseName ResourceView VirtualClassroom ForumPost ForumRead DiscussionRead DiscussionPost ArchiveView AssignmentView AssignmentUpload FinalGrade
Explanation Name of User Number of Courseware and Other Supporting Materials Views Number of Virtual Classroom Participations Number of Forum Posts Number of Forum Reads Number of Discussion Reads Number of Discussion Responses Number of Archive Views Number of Assignments Views Number of Assignment Answer Uploads Final Grade Result
4.3.2. Implementing Data Mining Methods The major group of data mining algorithms used in this work is ‘Feature Selection’. These methods, also branded as ‘Attribute Evaluation’ algorithms, attempt to select the most applicable features with respect to the objective concept. Many quality ranking and attribute selection methods have been projected in the machine learning literature which use dissimilar metrics to remove unrelated features and select the significant ones containing: information increase, increase ratio, balanced uncertainty, relief-F, one-R, and chi-squared. Each metric has its individual bias. For example, the information increase measure is biased in the direction of features with many values. Here, we use increase ratio [10] as the main assessment metric since there are different number of records in the table concerning to each activity. The results of ranking supported on the other methods, are also presented and can be evaluated. In this project, the data mining software package utilized to rank the features is Weka [17]. The reasons are that it is a free open-source application which utilizes several methods for attribute assessment. Table 2 presents the results obtained from applying increase ratio attribute assessment method on the summarized table of students’ activities. As the table demonstrates the virtual classroom contribution plays the most important role in this ranking while the second place fits into the archive views.
129
International Journal of Advanced Science and Technology Vol. 45, August, 2012
Table 2. The Outcomes of Ranking Activities based on Increase Ratio Metric Attributes
Increase Ratio
Virtual Classroom
0.0939
Archive View
0.0794
Forum Read
0.062
Assignment View
0.0617
Assignment Upload
0.0597
Discussion Read
0.0464
Resource View
0.0424
Forum Post
0
Discussion Post
0
To verify the results achieved from this assessment some other methods are applied on the dataset and the aspects are ranked using other metrics. The outcomes are outlined in Table 3. It can be supposed from the table that virtual classroom contribution is the most important feature affecting students’ final scores among all other attribute assessment methods. Table 3. The Outcomes of Ranking Activities based on Another Method Attribute
גּ2
InfoGain
Virtual Classroom
1
1
Archive View
3
Forum Read
One-R
Relief-F
SVM
1
2
2
2
3
2
1
3
7
2
2
3
4
7
1
Assignment View
7
7
6
5
4
6
Assignment Upload
4
4
4
3
5
5
Discussion Read
5
5
5
7
6
4
Resource View
6
6
7
8
1
9
Forum Post
8
8
8
9
9
8
Discussion Post
9
9
9
6
8
3
130
Symmetric Uncertainty
International Journal of Advanced Science and Technology Vol. 45, August, 2012
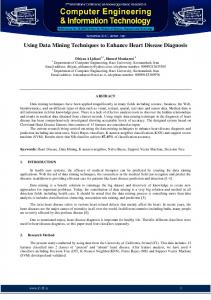
4.3.3. Compiling the Results To demonstrate and clarify the outcomes received from the research, a decision tree was formed based on the C4.5 algorithm [10]. This algorithm uses the increase ratio metric to choose the features and to construct the tree. Figure 1 demonstrates the first two stages of the tree. As described, the number of virtual classroom involvement comes in the first level separating the scholars into two groups. Scholars who have taken part fewer than 11 virtual classroom sessions, will most likely (with the possibility of about %55) fail in their examination. In difference, Scholars with more than 11 participations might (with the possibility of about %42) pass the exam with a C. Additionally, each knot of the tree can be used to take out a rule to predict students’ final scores based on their activities involved. For example, as tinted in the figure, scholars with more than 11 virtual classroom contribution and 17 archive observations would get an A in the ending examination. The reporting of this rule is about %25 and the correctness is almost %41. These set of laws may help the teachers to recognize the most significant activities to focus on in order to get better their teaching style. The system can also be working by training managers and executives to give with helpful information in resource arrangement and decision making.
Figure 1. The First Two Levels of the Decision Tree Model Generated to Predict Students’ Final Grades.
5. Conclusions and Future Work In this work we explained the procedure of applying data mining methods ranking the students activities based on their impact on the presentation of students in final exams. We used a number of ‘Feature Selection’ and ‘Attribute Evaluation’ techniques together with real practice data of students collected from the Moodle LMS to carry out the case study. The results pointed out that involvement in virtual classroom sessions has the most impact on the efficiency of learning in the particular settings of the university’s college e-learning unit. As a result, this actuality motivated the managers and instructors to pay more concentration to virtual classrooms and encourage the students to take part in these sessions. In the near future,
131
International Journal of Advanced Science and Technology Vol. 45, August, 2012
the outcome of virtual classroom will be studied more deeply by keeping some variables in mind other than just the number of involvement and archive views. It is also achievable to analyze the students’ performance in virtual classrooms more extremely considering the behaviors performed by students. Finally, the Teachers’ instructional model in the virtual classroom will be studied to find the most excellent methods that realize students’ demands which might have a great impact on their learning performance.
Acknowledgements The authors gratefully acknowledge the managers, executives, instructors, and officials of the ELearning unit of Prince Sultan College for EMS, King Saud University for their precious ideas and comments and special thanks to Dr. Mohammed F. AlAjmi vice Dean for Quality and Development in the college for his continuous support.
References [1] Adobe Flash Platform, www.adobe.com/flashplatform/, (2010). [2] J. E. Beck and J. Mostow, "How who should practice: Using learning decomposition to evaluate the efficacy of different types of practice for different types of student", in the 9th International Conference on Intelligent Tutoring Systems, (2008), pp. 353- 362. [3] M. Bower and D. Richards, "The Impact of Virtual Classroom Laboratories in Computer Science Education", in Thirty-Sixth SIGCSE Technical Symposium of Computer Science Education, St. Louis, Missouri, USA, (2005), pp. 292-296. [4] A. T. Etchells, A. Nebot, A. Vellido, P. J. Lisboa and F. Mugica, "Learning What is Important: Feature Selection and Rule Extraction in a Virtual Course", in The 14th European Symposium on Artificial Neural Networks, ESANN, Bruges, Belgium, (2006), pp. 401–406. [5] S. B. Kotsiantis, C. J. Pierrakeas and P. E. Pintelas, "Predicting Students’ Performance in Distance Learning Using Machine Learning Techniques", Applied Artificial Intelligence, vol. 18, no. 5, (2004), pp. 411–426. [6] R. Mazza and V. Dimitrova, "CourseVis: A graphical student monitoring tool for supporting instructors in web-based distance courses", International Journal of Human-Computer Studies, vol. 65, no. 2, (2007), pp. 125–139. [7] Merceron and K. Yacef, "Mining student data captured from a web-based tutoring tool: Initial exploration and results", Journal of Interactive Learning Research, vol. 15, no. 4, (2004), pp. 319–346. [8] B. Minaei-Bidgoli and B. Punch, "Using Genetic Algorithms for Data Mining Optimization in an Educational Web-based System", Genetic and Evolutionary Computation, vol. 2, (2003), pp. 2252–2263. [9] A. Nebot, F. Castro, A. Vellido and F. Mugica, "Identification of Fuzzy Models to Predict Students Performance in an e-Learning Environment", in The Fifth IASTED International Conference on Web-Based Education, Puerto Vallarta, Mexico, (2006), pp. 74–79. [10] J. R. Quinlan, “C4.5: Programs for Machine Learning”, Morgan Kaufmann, (1993). [11] S. Redferm and N. Naughton, "Collaborative Virtual Environments to Support Communication and Community in Internet-Based Distance Education", Journal of Information Technology Education, vol. 1, no. 3, (2002), pp. 201-211. [12] W. H. Rice, “Moodle e-learning course development. A complete guide to successful learning using Moodle.”, Packt Publishing, (2006). [13] C. Romero, S. Ventura and E. Garcia, "Data mining in course management systems: Moodle case study and tutorial", Computers & Education, vol. 51, no. 1, (2008), pp. 368– 384. [14] C. Romero, S. Ventura, P. G. Spejo and C. Hervas, "Data Mining Algorithms to Classify Students", in the 1st International Conference on Educational Data Mining, Montral, Canada, (2008), pp. 8-17. [15] L. Talavera and E. Gaudioso, "Mining Student Data to Characterize Similar Behavior Groups in Unstructured Collaboration Spaces", in Workshop in Artificial Intelligence in Computer Supported Collaborative Learning in conjuntion with 16th European Conference on Artificial Intelligence, ECAI’2003., Valencia, Spain, (2004), pp. 17–22. [16] C. Teng, C. Lin, S. Cheng and J. Heh, "Analyzing User Behavior Distribution on e-Learning Platform with Techniques of Clustering", in Society for Information Technology and Teacher Education International Conference, (2004), pp. 3052–3058. [17] Weka, http://www.cs.waikato.ac.nz/~ml/weka/, (2010).
132
International Journal of Advanced Science and Technology Vol. 45, August, 2012
[18] O. Zaïane and J. Luo, "Web usage mining for a better web-based learning environment", in the conference on advanced technology for education, Banff, Alberta, (2001), pp. 60-64. [19] M. E. Zorilla, "Data Warehouse Technology for E-Learning", in Methodologies and Supporting Technologies for Data Analysis. Berlin, Heidelberg: Springer-Verlog, (2009), pp. 1-20.
Authors Dr Mohammed Fahad AlAjmi was born in Kingdom of Saudi Arabia. He did Ph.D in Pharmacy from King Saud University in 2007.He chaired many position in the university and currently working vice dean in Prince Sultan College for EMS affiliated to King Saud University. To date he taught nearly 280 pharmacy students, more than 30 courses. Students' levels varies from primary to undergraduate levels.
Shakir Khan was born on 5th Feb, 1978 at Kallanheri in Saharanpur district UP, India. He is working as a Researcher in College of Electronic Learning in King Saud University, Kingdom of Saudi Arabia. He received his Master of Science in Computer Science from Jamia Hamdard (Hamdard University), New Delhi, India in the year 2005, and PhD computer Science scholar in Manav Bharti University, Solan (HP) India since 2010. He is member of IEEE. He has actively attended many international conferences and published various research papers in National and International conferences as well as journals. His current areas of interests are in Cloud Computing, Software Engineering, Data Mining and E Learning. Apart from that he worked in the field of Software Development in different MNC companies at Noida India. th
Abu Sarwar Zamani was born on 15 Jan 1982 in Bihar, India. He is working as a Lecturer in College of Science in Shaqra University, Kingdom of Saudi Arabia. He has received his Master of Science in Computer Science from Jamia Hamdard (Hamdard University), New Delhi, India in the year 2007, and later he did Master of Philosophy in Computer Science from Vinayak Mission University, Chennai, India in 2010. He is member of International Association of Computer Science and Information Technology- IACSIT. He has actively attended and published various research papers in National as well as International papers. His current area interests are in Cloud Computing, Networking, Artificial Intelligence, and Data Mining. Apart from that
133
International Journal of Advanced Science and Technology Vol. 45, August, 2012
134