International Book Series "Information Science and Computing"
55
THE APPLICATION OF DATA MINING METHODS TO THE CLASSIFICATION OF FINISHED PRODUCTS Monika Piróg-Mazur, Galina Setlak, Wioletta Szajnar, Tomasz Kożak Abstract: In this paper the review of applications of data mining is presented. The algorithm of the induction across decision trees that was proposed for classifying large set of data is described in the part 2 of the paper. A short characteristic of the proposed algorithm is included in the part 3. In the part 4 we present characteristics of R-environment and the implementation of the algorithm. The method of conducting the computational experiments and the obtained results are presented in the part 5. The last part of the paper contains conclusions and further perspectives. Keywords: data mining, classification, critical defects, induction of decision trees formatting rules ACM Classification Keywords: I. Computing Methodologies, I.2 Artificial Intelligence, J. Computer Applications J.6 Computer-aided engineering,
Introduction Data mining is the analysis of observational data sets (often huge sets) in order to find unexpected relations and to sum up data in an original way to make it both comprehensible and useful for its owner. Relationships and summaries which are the result of data mining are called models or prototypes. The examples are linear equations, rules, concentrations, graphs, tree structures and re-entry prototypes in time series. Data mining covers a wide range of topics in the field of computer science and statistics. They have a lot in common but at the same time each of them preserves its distinct character and deals with specific problems and the ways of solving them [Hand, Mannila, Smith, 2005].
The essence of classification One of the oldest and the most important methods of data mining, which is also of great practical importance, is the classification method. The process of classification in data mining was presented in papers [Kennedy, Lee, Van Roy, Reed, Lipman, 1995], [Mehta, Agrawal, Rissanen, Slig, 1996]. This method was introduced by Breiman and others [Breiman, Friedman, Olsen, Stone, 1984] and it combines classification with application in which it works. The most popular in this group are: CART [Breiman, Friedman, Olsen, Stone, 1984], ID3 [Quinlan , 1986], C4.5 [Quinlan 1993]. Classification means finding data mapping in a set of predefined classes. The model (for example: a decision tree, logical rules) is being built on the basis of database contents. The built model is designed for classifying new objects in the database or for deeper understanding of the existing division of objects into predefined classes. The main aim of classification is to build a formal model called a classifier. Input data in the process of classification is a set of tuples (a training set of examples, observations, samples), which is a list of values of description attributes and a selected decision attribute. The result of the classification process is a certain model (a classifier) which assigns each tipple (an example) the value of a decision attribute on the basis of values of other attributes [Wazniak, 2008].
56
No:13 – Intelligent Information and Engineering Systems
A decision tree construction The task of classifying objects on the basis of putting together their features (attributes) is a key task for technologies connected with data mining. It can be generally said that the main task of classification is to find the function which assigns n-set of well-known attributes of a certain object marked as (x1….xn) to y class which this object belongs to. The tasks of this type appear in many domains. The popular ones include: picture recognition, text analysis, economic trends analysis and customers classification [Kasprowski, 2005]. A method based on decision trees enjoys great popularity. The classifier is represented by a binary tree, there are some enquiries about values of a given feature in its nodes and class assessments in its leaves. The basic algorithm of a decision tree structure used while constructing it belongs to the method family called “divide-and-conquer”. There are many variants of the basic algorithm. ID3 and C4.5. are the algorithms that are the most frequently applied. The main difference between these algorithms is the established criterion of division, which is the way of creating new inner nodes in a decision tree, used while constructing the tree. The method of division should maximize the accuracy of constructing the decision tree that is it should minimize the wrong classification of data records [Kasprowski, 2005]. Let’s begin with finding such a division of a training set so as to minimize its entropy that is an unordered set of data, which can be counted by using this formula:
H (d ) = −∑ y p( y ) log p( y ) Where d is a set of data and p(y) is probability that a sample from this set belongs to class y. The probability is counted as the ratio of the number of samples in a set belonging to class y to the total number of samples. The tree generated in the stage of learning is used to classify new samples with the unknown class membership. The database is divided into two sets, where the first one is a training set (it serves to build the model) and the second one is a testing set (it serves to test the model).
Implementation in the R environment The R package is a tool for data analysis (financial, industrial, biological, medical and other data). It allows carrying out a reliable analysis, to visualize the results by creating legible graphs and to generate the reports automatically. Statistical methods and data analysis and visualization have been implemented in the R environment. The R package can be used for many applications, both educational and business applications. R users have the possibility to use CLI (Command Line Interface – writing commands directly into a command line), creating script languages or GUI (Graphical User Interface – ready-made user interfaces). The method of creating decision trees is available in many different functions in the R package. The functions which are commonly used are: tree(tree), rpart(rpart) oraz cpart (party). All mentioned above functions are used in the same way while constructing trees [Biecek, 2008]. To make classification trees visualized the following functions can be used (depending on the function we used to create the tree):
While building a classification tree the criterion of a division should be determined, that is which value is to be minimized while creating the next branches (most often it is the error of classification) and the stopping criterion (how long the tree should be divided). Different variants of trees allow to control different criteria.
International Book Series "Information Science and Computing"
57
Figure 1. The hypothetical session of constructing a decision tree
Computational data analysis The characteristic of a data set. The data set of a real production company, which manufactures ready-made products (glass products – bottles), was used in research. The production company does three-shift work. It is able to produce 200 000 bottles of one type during one shift. There is some data prepared to classify the bottles. The data is prepared in the form of text files including the value set of the selected parameters (classification of critical defects with the division into groups). In the first place preparing data was based on bringing it to the flat structure. Next, all names applied in a source system were removed. During this stage of preparing data incoherent and empty data were rejected. The research was carried out by means of the tool – the R package. Table 1 Hypothetical data from the studied data set Name tag 1 2 3 4 5 6 7 8 9 10 11 12 13 14 15 16 17 18 19 20 21 22 23 24
fault
group
Name tag
Birdcage Spikes Internal Fused glass Flanged finish Overpress finish Internal dirt Broken stones, Open blisters – internal Chipped finish Open blister on sealing surface, burrs Finish dimensions Checks on finish Unfilled, bulged finish Sharp finish seams Chocked finish Flanged bottom Thermal shock Any checks, crizzels, chips Microchecks on finish Offset finish Sharp, thick seams Breaking and open blisters Dimensional defects Sharp crizzels, sharp and open cords Bulged body, cold mould
Group 0 Group 0 Group 0 Group 0 Group 0 Group 0 Group 1 Group 1 Group 1 Group 2 Group 2 Group 2 Group 2 Group 2 Group 2 Group 2 Group 3 Group 3 Group 3 Group 3 Group 3 Group 3 Group 3 Group 3
25 26 27 28 29 30 31 32 33 34 35 36 37
fault
group
Any microchecks Crizzels, washboard, threads, cords, ripples, tears Wavy, rough, hammer, dirty mould Shear mark, dirt outside Unffilled thread, thin finish Fused bottom, baffle mark, wedged bottom Engraving, lettering Solid stones Closed blisters Drag marks, double seams, offset bottom Offset mould Unstable, bulged, push up, thick bottom Faint, no stippling
Group 4 Group 4 Group 4 Group 4 Group 4 Group 4 Group 4 Group 4 Group 5 Group 5 Group 5 Group 5 Group 5
No:13 – Intelligent Information and Engineering Systems
58
For hypothetical data, included in table 1, sets describing this data are presented in table 2 Table 2. Set
Group 0
Birdcage, Spikes, Internal Fused glass, Flanged finish, Overpress finish, Internal dirt
Group 1
Broken stones, Open blisters – internal, Chipped finish, Open blister on sealing surface, burrs
Group 2
Finish dimensions, Checks on finish, Unfilled, bulged finish, Sharp finish seams, Chocked finish, Flanged bottom, Thermal shock
Group 3
Any checks, crizzels, chips, Microchecks on finish, Offset finish, Sharp, thick seams, Breaking and open blisters, Dimensional defects, Sharp crizzels, sharp and open cords, Bulged body, cold mould
Group 4
Any microchecks, Crizzels, washboard, threads, cords, ripples, tears, Wavy, rough, hammer, dirty mould, Shear mark, dirt outside, Unffilled thread, thin finish, Fused bottom, baffle mark, wedged bottom, Engraving, lettering, Solid stones
Group 5
Closed blisters, Drag marks, double seams, offset bottom, Offset mould, Unstable, bulged, push up, thick bottom, Faint, no stippling
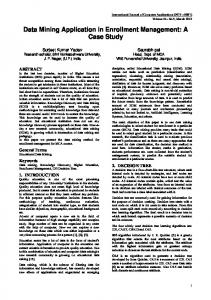
700 600 500 400 300 200 100 0 group Group Group Group Group Group Group Group Group Group Group Group Group 0 0 1 2 2 3 3 3 4 4 4 5
Figure 2. The hypothetical histogram with the division into groups
Decision trees allow data set mining to be done by analyzing values which decide about creating nodes and can be designed for classification of customers or products [Bauer, 2006] [Blundon, 2003] [Shearer, 2004]. The advantage of classification by means of decision trees is the ease of interpretation. The drawn classifier can be evaluated and corrected by experts in different domains.
Conclusion Having a training set including samples with well-known classification it possible to create a classification model (called in other words - a classifier).
at
disposal
makes
It is possible to create different classifiers for the same training set taking into consideration: − which attributes and their combinations are to be considered, − which classification method will be used. Thus the same input data (a training set) can have very different solutions. The selection of the optimum solution is usually made on the basis of tests carried out on the set of samples with the known classification [Kasprowski, 2005].
International Book Series "Information Science and Computing"
59
It is necessary to remember that classification algorithms relying on the same data can easily lead to the phenomenon of overloading. The overloaded classifier provides very good results for the data which was used to create it, but it is much weaker for the new data which has not been used yet [Kasprowski, 2005]. The paper presents the preliminary results of the research concerning the classification of ready-made products of the production company. The achieved results prove the usefulness of the applied method of data mining – decision trees. The results will be verified in collaboration with experts from the control department of the studied company. The aim of further research will be to make a series of detailed analyses within the confines of individual ready-made products. This exemplar is meant to be a model for manuscript format. Please make your manuscript look as much like this exemplar as possible. In the case of serious deviations from the format, the paper will be returned for reformatting.
Bibliography [Bauer, 2006] Bauer K.: The power of metrics: Predictive analytics – addressing the business vicissitudes, DM Review Magazine, 2006 [Biecek, 2008] Biecek P Przewodnik po pakiecie R, Wrocław, 2008 [Biecek, 2008] Biecek P Na przełaj przez Data Mining, Wrocław, 2008 [Breiman, Friedman, Olsen, Stone, 1984] Breiman L., Friedman J.H., Olsen R.A., Stone C.J., Classification and Regression Press, Wadsworth, Belmont CA, 1984. [Blundon, 2003] Blundon W.: Predicting Success: using analytics to drive more profitable customer interactions DM, Direct Newsletter, 2003 [Hand, Mannila, Smith, 2005] Hand D, Mannila H., Smith P Eksploracja danych, WNT, Warszawa, 2005 [Kasprowski, 2005] Kasprowski P, Zastosowanie głosowania klasyfikatorów w przykładowym zadaniu klasyfikacyjnym, Rozdział w monografii Bazy danych: Modele, Technologie, Narzędzia, Kozielski S., Małysiak B., Kasprowski P., Mrozek D., WKŁ, 2005 [Kennedy, Lee, Van Roy, Reed, Lipman, 1995] Kennedy Runy L., Lee Y., Van Roy Benjamin, Reed Ch., Lipman R.P., Solving Data Mining Problems through Pattern recognition, Pearson Education, Upper Saddle River, Nj, 1995. [Mehta, Agrawal, Rissanen, Slig, 1996] Mehta M., Agrawal R., Rissanen J., Slig: A Fast Scalable Classifier for Data Mining, in: Proc. of the Fifth International Conference on Extending Database technology, Avignon, France 1996 [Shearer , 2004] Shearer C.: Anticipating customer behavior with analytics, CRM Today 2004. [Quinlan , 1986] Quinlan J.R., Induction of Decision Trees, Machine Learning, Vol.1, No.1, 1986. [Quinlan 1993] Quinlan J.R., C4.5: Programs for Machine Learning, Morgan Kauffman, 1993. [Wazniak, 2008] http://wazniak.mimuw.edu.pl/index.php
Authors' Information Monika Piróg-Mazur – PhD Student, Editor in chief, Institute of Technical Engineering State School Of Higher Vocational Education, Czarniecki Street 16, 37-500 Jaroslaw, Poland; e-mail:
[email protected] Galina Setlak, D.Sc, Ph.D., Eng., Associate Professor, Rzeszow University of Technology, Department of Computer Science , W. Pola 2 Rzeszow 35-959, Poland, and The State Professional High School, Czarnieckiego 16, 37-500 Jarosław, Poland, e-mail:
[email protected] Wioletta Szajnar – Editor, Institute of Technical Engineering State School Of Higher Vocational Education, Czarniecki Street 16, 37-500 Jaroslaw, Poland; e-mail
[email protected] Tomasz Kożak – Editor, Institute of Technical Engineering State School Of Higher Vocational Education, Czarniecki Street 16, 37-500 Jaroslaw, Poland; e-mail:
[email protected]