1Gogte Institute of Technology, Belgaum, India. 2Gogte Institute ... 3Jain College of Engineering, Belgaum, India ..... Networksâ, A Technical Report submitted to.
IJCSI International Journal of Computer Science Issues, Vol. 9, Issue 2, No 1, March 2012 ISSN (Online): 1694-0814 www.IJCSI.org
324
Using Layer Recurrent Neural Network to Generate Pseudo Random Number Sequences Veena Desai 1, Ravindra Patil2, Dandina Rao3 1
Gogte Institute of Technology, Belgaum, India 2
Gogte Institute of Technology, Belgaum, India
3
Jain College of Engineering, Belgaum, India
Abstract Pseudo Random Number’s (PRN’s) are required for many cryptographic applications. This paper proposes a new method for generating PRN’s using Layer Recurrent Neural Network (LRNN). The proposed technique generates PRN’s from the weight matrix obtained from the layer weights of the LRNN. The LRNN random number generator (RNG) uses a short keyword as a seed and generates a long sequence as a pseudo PRN sequence. The number of bits generated in the PRN sequence depends on the number of neurons in the input layer of the LRNN. The generated PRN sequence changes, with a change in the training function of the LRNN .The sequences generated are a function of the keyword, initial state of network and the training function. In our implementation the PRN sequences have been generated using 3 training functions: 1) Scaled Gradient Descent 2) LevenbergMarquartz (TRAINLM) and 3) TRAINBGF. The generated sequences are tested for randomness using ENT and NIST test suites. The ENT test can be applied for sequences of small size. NIST has 16 tests to test random numbers. The LRNN generated PRN’s pass in 11 tests, show no observations for 4 tests, and fail in 1 test when subjected to NIST .This paper presents the test results for random number sequence ranging from 25 bits to 1000 bits, generated using LRNN.
Keywords: PRNG, Layer Recurrent Network, ENT, NIST
1. Introduction Random number generation plays an important role in cryptography and software testing. Pseudo-random number generators are required for the generation of random numbers to be used for the creation of random data used in these areas of encryption, hashing and watermarking. Pseudo-randomness is fundamental to cryptography and is essential to achieve any cryptographic function such as encryption, authentication and identification. A pseudorandom number generator (PRNG) is a deterministic algorithm that on input of a short random seed outputs a (typically much) longer sequence that is computationally in-distinguishable from a uniformly chosen random sequence.
Many different methods exist for generating pseudorandom numbers. Blum-Blum-Shub [1], Mersenne Twister algorithms [2] etc are widely used random number generators based on in cryptographic applications. A new approach of generating random numbers has also been investigated in [3,4] since neural networks are highly non-linear mathematical systems. The authors of [4] use the dynamics of feed forward neural networks with random orthogonal weight matrices to generate random numbers. Neuronal plasticity is used in [5] to generate pseudo-random numbers. In section 2 of the paper we discuss the structure of recurrent neural network, implementation details and comparison of different training functions. Section 3 provides the implementation details and the algorithm for generating random numbers. In section 4 we present and results for generating the pseudo random number generator and section 5 tabulates the results and analysis. We present our conclusions in section 6.
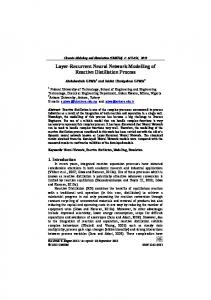
2. Background The dynamic network used for our implementation is the Layer Recurrent Network (LRN). An earlier simplified version of this network was introduced by Elman as in figure 1. The Elman network has only two layers. It uses a tansig transfer function for the hidden layer and a purelin transfer function for the output layer. It is trained using an approximation to the back propagation algorithm. We generated an Elman network using a input keyword and a target vector. To create a Elman network with 10 neurons in the hidden layer the following command is used, where p is the keyword and t is the target.
net = newelm (p,t,10)
Copyright (c) 2012 International Journal of Computer Science Issues. All Rights Reserved.
IJCSI International Journal of Computer Science Issues, Vol. 9, Issue 2, No 1, March 2012 ISSN (Online): 1694-0814 www.IJCSI.org
325
A Layer Recurrent network is generated for the required number of neurons n and p newIWmat =abs(IWmat)-mean(IWmat) PRNG =reshape (newIWmat)
3.1 Training of layer recurrent network
Fig. 1 Elman Network
The training function BTF can be any of the backpropagation training functions such as trainlm, trainbfg, trainscg, trainbr, etc. The learning function BLF can be either of the backpropagation learning functions learngd or learngdm. The performance function can be any of the differentiable performance functions such as mse or msereg.
3.2 Selection of Training function
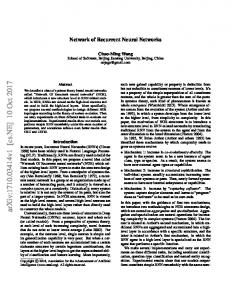
Fig. 2 Layer Recurrent Network
In the LRN network, there is a feedback loop, with a single delay, around each layer of the network except for the last layer. The neweln command generalizes the Elman network to have an arbitrary number of layers and to have arbitrary transfer functions in each layer. The default training function is the gradient-based algorithms. Figure 2 represents the MATLAB model of a two-layer LRN. The recurrent layer can have any number of neurons. However, as the complexity of the problem grows, more neurons are needed in the recurrent layer for the network to do a good job.
3. Implementation The implementation is performed using MATLAB. A keyword is used to generate a unique number sequence p. The target sequence is t=func(p). p=func(key); Pseq=f (t,p); qseq=f(t,q); net=newlrn(n,p,t) The generated layer recurrent network is trained for the input sequence pseq and target sequence qseq trainnetwork (pseq, qseq) The initial weight matrix IWmat for generating the pseudo random number.
The network was initially trained using TRAINBGF function using 5 neurons in the hidden layer and 100 epochs. The network size was gradually increased upto 75 neurons. Beyond this size the network did not converge. Also the time taken to train the network was found to be considerably large. Similar results were observed by training the network using TRAINLM function. Finally the network was trained using TRAINSCG function .The network converged for sizes of up to 2000 neurons in the hidden layer. Table 1a, 1b and 1c help in comparing the time taken for training and performance of the network using the three training functions.
4. Results and plots obtained from the training functions Figures 3a provides the plot of performance and training the LRN using trainscg. Figure 3b shows plots of the bit pattern obtained for 1000 generated bits. Similarly Figures 4a, 4b, 5a, 5b and 6a, 6b provide plots of performance and training with TRAINSCG, TRAINBFG, TRAINLM functions for 75 bits generated. Table 1 compares the epoch, time, performance and gradient for each of the above. Table 1: Comparison of training functions
Number of Neurons Epochs (Max 100) Time Performance Gradient
TRAINSCG 75
TRAINBFG 75
TRAINLM 75
100
51
8
0:00:20 1.33e-05 0.00587
3:25:24 6.64e-07 0.000872
0:01:40 1.02e-30 1.19e-14
Copyright (c) 2012 International Journal of Computer Science Issues. All Rights Reserved.
IJCSI International Journal of Computer Science Issues, Vol. 9, Issue 2, No 1, March 2012 ISSN (Online): 1694-0814 www.IJCSI.org
Fig. 3a Resulting plot of performance and training state of the LRN with 1000 neurons and trainscg function
Fig. 3b 1000 bits generated using trainscg
Fig. 4a Resulting plot of performance and training state of the LRN with 75 neurons and trainscg function
Fig. 4b Response graph after training.
Copyright (c) 2012 International Journal of Computer Science Issues. All Rights Reserved.
326
IJCSI International Journal of Computer Science Issues, Vol. 9, Issue 2, No 1, March 2012 ISSN (Online): 1694-0814 www.IJCSI.org
Fig. 5a Resulting plot of performance and training state of the LRN with 75 neurons and trainbfg function
Fig. 5b Response graph after training.
Fig. 6a Resulting plot of performance and training state of the LRN with 75 neurons and trainlm function
Fig. 6b Response graph after training.
Copyright (c) 2012 International Journal of Computer Science Issues. All Rights Reserved.
327
IJCSI International Journal of Computer Science Issues, Vol. 9, Issue 2, No 1, March 2012 ISSN (Online): 1694-0814 www.IJCSI.org
5. Testing for randomness The randomness of a sequence is tested standard software tests. There are several popular test packages like DIEHARD, NIST test suite, CRYPT X and ENT. They work similar, and usually include common tests such as frequency test, long run test, pattern test, correlation test, and so on. These tests assign a property to the sequence, and then test the sequence, comparing with the properties of a sequence that don't have the assumed property. To test the randomness of data generated in this paper, ENT and NIST test program is used. Additionally the Frequency test is done which gives the count of 1’s generated. There are several well known batteries of statistical tests for random number generators such as the Diehard test suite [4] developed by Marsaglia, John Walker’s ENT[5] and Test01[6] designed by L’Ecuyer and Simard. The most popular is the NIST statistical test suite[1] developed by the National Institute of Standards and Technology (NIST) as a result of a comprehensive theoretical and experimental analysis and may be considered as the state- of-the-art in randomness testing [8] for cryptographic applications. The test suite has become a standard stage in assessing the outcome of random number generators shortly after its publication. The NIST battery of tests is based on statistical hypothesis testing and contains a total of 16 statistical tests specially designed to assess the randomness required for cryptographic applications (out of which two tests are currently disregarded because of some problems found by NIST and other researchers [2]).A hypothesis test is a procedure for determining if a given assertion is true, in this case the provided P-values determine whether or not the tested sequence is random from the perspective of the selected randomness statistic. Each statistical test has a relevant randomness statistic and is formulated to test a null hypothesis (H0). The null hypothesis under test in case of the NIST tests is that the sequence being testesd is random, and the alternative hypothesis (Ha) is that the tested sequence is not random.Mathematical methods determine a reference distribution of the selected statistic under the null hypothesis and a critical value is selected. Each test derives a decision based on the comparison between the critical value and the test statistic value computed on the sequence being tested and according to this decision it accepts (test statistic value < critical value) or rejects (test statistic value > critical value) the null hypothesis and concludes on whether the tested generator is or is not producing random numbers.
5.1 NIST Tests The Frequency (Monobit) Test The frequency test determines whether zero and one bits appear in the tested sequence with approximately the same probability. This simple test can reveal the most obvious deviations from randomness hence further tests depend on this result. Frequency Test within a Block The frequency test within a block is a generalization of the Frequency (Monobit) test, having the purpose of determining the frequency of zeros and ones within M-bit blocks and thus revealing whether zeros and ones are uniformly distributed throughout the tested sequence. Runs Test In order to determine whether transitions between zeroes and ones in the sequence appear as often as expected from a random sequence, the runs test counts the total number of runs of various lengths. A run consists of an uninterrupted sequence of identical bits. Longest Run of Ones in a Block Test In case of the longest run of ones in a block test, the sequence is processed in M bit blocks with the aim of determining whether the length of the longest run of ones in a block is consistent with the length expected from a random sequence. Non-overlapping Template Matching Test The purpose of this test is to detect generators that produce too many occurrences of a given nonperiodic pattern by searching for occurrences of a given m-bit non-periodic pattern. Overlapping Template Matching Test The overlapping template matching test is similar to the non-overlapping template matching test, but it extends the search criteria to overlapping patterns. Linear Complexity Test The purpose of this test is to determine the linear complexity of the LFSR (Linear Feedback Shift Register) that could generate the tested sequence. If the complexity is not sufficiently high, the sequence is non-random. Serial Test In order to verify the uniformity of templates the test counts the occurrences of every possible m-bit overlapping patterns in the sequence. A high level of uniformity–patterns occur with the same probability indicates that the sequence is close to random. Approximate Entropy Test The purpose of the approximate entropy test is to compare the frequency of overlapping patterns of two consecutive lengths, m and m+1, against the expected frequency in a true random sequence.
5.2 ENT and NIST results The neural networks used in this paper are simple, easy to implement and faster than other generators.
Copyright (c) 2012 International Journal of Computer Science Issues. All Rights Reserved.
328
IJCSI International Journal of Computer Science Issues, Vol. 9, Issue 2, No 1, March 2012 ISSN (Online): 1694-0814 www.IJCSI.org
It is well known that all PRNG’s in spite of good performance on statistical test suites possess some weakness. In this regard the neural network used in this paper possesses potential advantages. ENT pseudo-random sequence test program output for a standard generator input (radioactive decay) file is given below. Entropy = 7.980627 bits per character. Optimum compression would reduce the size of this 51768 character file by 0 percent. Chi square distribution for 51768 samples is 1542.26, and randomly would exceed this value less than 0.01 percent of the times. Arithmetic mean value of data bytes is 125.93 (127.5 = random). Monte Carlo value for Pi is 3.169834647 (error 0.90 percent). Serial correlation coefficient is 0.004249 (totally uncorrelated = 0.0).
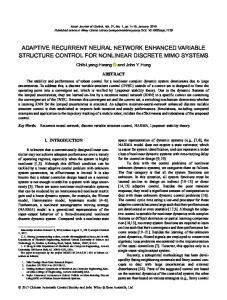
correlation coefficient using the ENT test. Comparison between numbers generated using standard generator and Elman neural network are provided in these plots.The plots from figure 8a to 8g provide the information for various parameters using the NIST test conducted on numbers generated using LRN network. The comparison between SCG and BFG training functions are presented in these plots. Table 2 presents ENT Test results for ELMAN network. Table 3 compares results with varying LRN network size using TRAINSCG function. Table 4 provides comparison of results with varying LRN network size using TRAINBFG function. Table 5 gives the results of non-parameterized and parameterized tests with NIST.
2500
standard neural 2000
Balanced output
We have used ENT [6] and NIST pseudo-random number sequence test program on the generated sequences. For each test, the ENT test suite program generates entropy, chi-square value, arithmetic mean value, Monte Carlo value for Pi and finally Serial Correlation Coefficient.
329
1500
1000
500
NIST SP800-22 [7] has mentioned 16 tests and their significance levels are considered as 1% as well as some of the test need to be adjusting their parameter settings. The NIST test suite also returns p-values for its tests (including multiple iterations of some tests).NIST requires a PRNG pass 16 statistical tests. The tests results are listed below.
0
0
200
400
600
800
1000
1200
1400
1600
1800
2000
Number of neurons
Fig. 7a Plot of balanced output 5 standard neural
4.5
4
Monte Carlo value for Pi
The results of the neural network generator implemented in this paper for a network with 100 neurons are, Entropy = 0.807589 bits per bit. Optimum compression would reduce the size of this 2160 bit file by 19 percent. Chi square distribution for 2160 samples is 550.05, and randomly would exceed this value less than 0.01 percent of the times. Arithmetic mean value of data bits is 0.2477 (0.5 = random). Monte Carlo value for Pi is 4.000000000 (error 27.32 percent). Serial correlation coefficient is -0.058416 (totally uncorrelated = 0.0). Number of 1’s in the sequence of 100 bits is 51 ie balanced output conditions.
3.5
3
2.5
2
1.5
1
0.5
0
0
200
400
600
800
1000
1200
1400
Number of neurons
Fig.7b Plot of Pi value
6. ENT and NIST tests Figures 7a. to 7d. provide plots for balanced output, pi value, arithmetic mean and serial
Copyright (c) 2012 International Journal of Computer Science Issues. All Rights Reserved.
1600
1800
2000
IJCSI International Journal of Computer Science Issues, Vol. 9, Issue 2, No 1, March 2012 ISSN (Online): 1694-0814 www.IJCSI.org
330
1
Chi Square Value 10000 bfg scg
0.9 9000
0.8
7000
0.6 Chi square Value
A rithm etic m ean
8000
standard neural
0.7
0.5 0.4
6000
5000
4000
0.3
3000
0.2
2000
0.1
1000
0
0
0
200
400
600
800
1000
1200
1400
1600
1800
2000
0
500
1000
1500
2000 no of bits
2500
3000
3500
4000
Number of neurons Fig.7c Plot of Arithmetic mean
Fig. 8b Plot of chi-square value
Monte Carlo value for Pi 4 bfg scg
0.15 standard neural
3.5
0.1
Monte Carlo value for Pi
Serial correlation Coefficient
3
0.05
0
2.5
2
1.5
-0.05
1
0.5
-0.1 0
0
200
400
600
800
1000
1200
1400
1600
1800
0
500
1000
1500
2000 no of bits
2500
3000
3500
4000
2000
Number of neurons
Fig. 8c Plot of Monte carlo value of Pi
Fig. 7d Plot of Serial correlation coefficient Arithmetic mean
% optimum compression
0.4
20
bfg scg 0.35
bfg scg
18
16
0.3
14 % optimum compression
Arithmetic mean
0.25
0.2
0.15
12
10
8
6
0.1
4 0.05
2 0
0
500
1000
1500
2000 no of bits
2500
Fig. 8a Plot of arithmetic mean
3000
3500
4000
0
0
500
1000
1500
2000 no of bits
2500
3000
Fig. 8d Plot of % optimum compression
Copyright (c) 2012 International Journal of Computer Science Issues. All Rights Reserved.
3500
4000
IJCSI International Journal of Computer Science Issues, Vol. 9, Issue 2, No 1, March 2012 ISSN (Online): 1694-0814 www.IJCSI.org
331
serial corelation coefficient
Entropy
0
0.9
-0.02
0.8
-0.04
0.7
0.6
-0.06
0.5
-0.08
entropy
serial corelation coefficient
scg bfg
0.4
-0.1
0.3 -0.12
0.2 -0.14
0.1 -0.16
0
500
1000
1500
2000 no ob bits
2500
3000
3500
4000
0
0
500
Fig. 8e Plot of serial correlation coefficient
1000
1500
2000 no of bits
2500
3000
Fig. 8g Entropy plot
frequency test(number of ones) 2500 bfg scg
2000
no o fones
1500
1000
500
0
0
500
1000
1500
2000 no of bits
2500
3000
3500
4000
Fig. 8f Frequency test plot Table 2: ENT Test results for ELMAN network
Network size(neurons)
100
200
500
1000
2000
bits generated
200
400
1000
2000
4000
Entropy
0.86616
0.85183
0.85526
0.86862
0.89051
Frequency test
104
211
477
1112
2254
Optimum compression
13%
15%
14%
13%
10%
Chi-Square value
576.56
1363
3103.3
5650.1
9466.5
Arithmetic mean value
0.2880
0.2694
0.2799
0.2899
0.3707
Monte Carlo value for Pi Serial correlation Coefficient
4.0000
4.0000
4.0000
4.0000
4.0000
0.09901
0.05067
0.078348
0.10464
0.15105
Copyright (c) 2012 International Journal of Computer Science Issues. All Rights Reserved.
3500
4000
IJCSI International Journal of Computer Science Issues, Vol. 9, Issue 2, No 1, March 2012 ISSN (Online): 1694-0814 www.IJCSI.org
332
Table 3: Comparison of Results with varying LRN network size using TRAINSCG function
Network size
100
200
500
1000
1500
2000
Number of bits generate d Frequency test(no of 1's) Entropy
100
200
500
1000
1500
2000
51
101
250
510
744
995
0.807589
0.857678
0.85405
0.858015
0.856824
0.856947
19%
14%
14%
14%
14%
14%
550.05
608.78
1621.33
3043.06
4602.29
6131.78
0.2798
0.2816
0.2778
0.2819
0.2810
0.2811
4.000000
4.000000
4.000000
4.000000
4.000000
4.0000000
-0.058416
-0.082371
-0.079757
-0.083641
-0.081398
-0.081662
Optimum Compression Chi-Square value Arithmetic mean value Monte Carlo value for Pi Serial Correlation Coefficient
Table 4: Comparison of Results with varying LRN network size using TRAINBFG function
Network Size
5
100
200
500
1000
2000
Number of bits generated
10
200
400
1000
2000
4000
Frequency test(no of 1's)
5
104
211
477
1112
2254
Entropy
0.85520
0.86616
0.85183
0.85526
0.86862
0.89051
Optimum Compression
14%
13%
15%
14%
13%
10%
Chi-Square value
32.60
576.56
1363
3103.34
5650.11
9466.56
Arithmetic mean value
0.2798
0.2880
0.2694
0.2799
0.2899
0.37077
Monte Carlo value for Pi
4.00000
4.00000
4.00000
4.00000
4.00000
4.00000
Serial Correlation Coefficient
-0.06347
-0.09901
-0.05067
-0.078348
-0.10464
0.15105
Table 5: Results of non-parameterized and parameterized tests with NIST
Network Size
100
400
Nonparameterized test selection Cumulative Sum
Runs
P-Value
0.115559
0.831359
Result
SUCCESS
SUCCESS
Network Size
1500
500
parameterized test selection Overlapping (Periodic) Template Matching Nonoverlapping (Aperiodic) Template
P-Value
Result
0.886589
SUCCESS
1.000000
SUCCESS
Copyright (c) 2012 International Journal of Computer Science Issues. All Rights Reserved.
IJCSI International Journal of Computer Science Issues, Vol. 9, Issue 2, No 1, March 2012 ISSN (Online): 1694-0814 www.IJCSI.org
333
Matching
P1 = 0.498961 P2 = 0.498531
10000
Longest Run of Ones in a Block
----------
----------
2000
Serial
1500
Rank
0.039105
SUCCESS
200
Block Frequency
100
Discrete Fourier Transform
0.123812
SUCCESS
500
Approximate Entropy
1.000000
SUCCESS
10000
Random Excursions
-----------
500
Linear Complexity
0.985610
SUCCESS
10000
Random Excursions Variant
------------
-----------
38450
Universal
-----------
-------------
100
Lempel-Ziv Complexity
1.000000
SUCCESS
Frequency
0.057780
SUCCESS
100
------------
6. Conclusions The conjugate gradient algorithms, in particular trainscg, seem to perform well over a wide variety of problems, particularly for networks with a large number of weights. The SCG algorithm is almost as fast as the LM algorithm on function approximation problems (faster for large networks). The conjugate gradient algorithms have relatively modest memory requirements. From our experiments we conclude that, the neural networks with moderate sizes of 200 to 500 neurons produce satisfactory results for Optimum compression, Serial Correlation Coefficient and Frequency test. The Monte Carlo value for Pi remains constant at 4.00000 irrespective of the changes in the size of the network. Optimum Compression is consistent for data as large as 2 million bits. The Arithmetic mean value increases with the increase in the size of the network .So the size of the network should be chosen for optimum values of Arithmetic mean and Frequency test. Because of computational limitations increasing the network size beyond 2000 neurons was not possible. TRAINSCG requires less memory for computation compared to TRAINBFG and TRAINLM. After performing the 16 tests of NIST test suite we concluded that, some tests like Random
0.000001
SUCCESS
FAILURE
Excursions, Random Excursions Variant and Universal tests are not successful because they require 2000 bits or more for satisfactory operation and our implementations generate a maximum of 2000 bits.
References [1] Yishai M. Elyada and David Horn: “ Can dynamic neural filters produce pseudo- random sequences?”, Artificial Neural Networks: Biological Inspirations – ICANN 2005. [2] Blum, Blum, and Shub, “A simple unpredictable pseudo random number generator”, SIAM Journal on Computing, 15(2):364–383, 1986. [3] Matsumoto and Nishimura, Mersenne twister: “A 623-dimensionally equidis-tributed uniform pseudorandom number generator”. ACM Transactions on Modeling and Computer Simulation, 8(1):3–30, 1998. [4] James M. Hughes: “Pseudo-random Number Generation Using Binary Recurrent Neural Networks”, A Technical Report submitted to Kalamazoo College 2007. [5] Abdi, “A neural network primer”, Journal of Biological Systems, 1994. [6] J.Walker,ENTTest suite.
http://www.fourmilab.ch/random/, Oct., 1998. [7] Rukhin, Soto, Nechvatal, Smid, Barker, Leigh, Levenson, Vangel, Banks, Heckert,Dray, and Vo. “A statistical test suite for random and pseudorandom number generators for cryptographic applications”, NIST Special Publication 800-22, 2001.
Copyright (c) 2012 International Journal of Computer Science Issues. All Rights Reserved.
IJCSI International Journal of Computer Science Issues, Vol. 9, Issue 2, No 1, March 2012 ISSN (Online): 1694-0814 www.IJCSI.org
334
[8] Oded Goldreich and Leonid A. Levin: “ A hardcore predicate for all one-way functions”, Proceedings of the twenty-first annual ACM symposium on theory of computing, 1989. [9] Pascal Junod: “Cryptographic secure pseudo-random bits generation”, The blum- blum-shub generator. Unpublished, 1999. [10] Pierre L’Ecuyer, “Random number generation in Handbook of Computational Statistics”, 2004.
Ravindra Patil (b. June 06, 1987) received his B.E in Computer Science (2009), M.Tech in Digital Communication and Networking (2011) from Visvesvaraya Technological University, Belgaum.
Veena Desai, received her B.E in Electronics and Communication Engineering form Karnatak University, Dharwad (1991), M.Tech in Computer Network Engineering from Visvesvaraya Technological University, Belgaum. She has published several papers in national and international conferences. She is presently working as Associate Professor at Gogte Institute of Technology. She has research interest in cryptography, network security and neural networks. She is a graduate student member of IEEE, member ISTE, IETE, CSI, ACM and CRSI.
Dr. D.H. Rao has done his Ph.D. in Engineering from University of Saskatchewan, Canada and Ph.D. in Management from University of South Carolina, USA. He has more than 100 research publications in proceedings of international conferences and reputed journals. He has co-authored and edited 3 books. He has traveled extensively across the globe and has chaired and delivered keynote addresses in many international conferences. He has more than 3 decades of academic and research experience. He is presently working as Principal and Director of Jain College of Engineering, Belgaum, India. Prior to joining Jain College of Engineering, he was the Principal of Gogte Institute of Technology, Belgaum, India. His research interests include artificial intelligence, neural networks and contextaware computing. He is a senior member of IEEE and fellow of IETE. He is also a certified NLP (Neuro-Linguistic Programming) Trainer.
Copyright (c) 2012 International Journal of Computer Science Issues. All Rights Reserved.