learning curves, to see if we could predict what changes could be made at ... also be used to analyse groups of objects within a system, or to âmineâ the student.
Using Learning Curves to Mine Student Models Brent Martin and Antonija Mitrovic Intelligent Computer Tutoring Group Department of Computer Science and Software Engineering, University of Canterbury Private Bag 4800, Christchurch, New Zealand {brent,tanja}@cosc.canterbury.ac.nz
Abstract. This paper presents an evaluation study that measures the effect of modifying feedback generality in an Intelligent Tutoring System (ITS) based on Student Models. A taxonomy of the tutor domain was used to group existing knowledge elements into plausible, more general, concepts. Existing student models were then used to measure the validity of these new concepts, demonstrating that at least some of these concepts appear to be more effective at capturing what the students learned than the original knowledge elements. We then trialled an experimental ITS that gave feedback at a higher level. The results suggest that it is feasible to use this approach to determine how feedback might be fine-tuned to better suit student learning, and hence that learning curves are a useful tool for mining student models.
1 Introduction Analysing adaptive educational systems such as Intelligent Tutoring Systems (ITS) is hard because the students’ interaction with the system is but one small facet of their education experience. Pre- and post-test comparisons provide a rigorous means of comparing two systems, but they require large numbers of students and a sufficiently long learning period. The latter confounds the results unless it can be guaranteed that the students do not undertake any relevant learning outside the system being measured. Further, such experiments can only make comparisons at a high level: when fine-tuning parts of an educational system (such as the domain model), a large number of studies may need to be performed. In this research we explored using a more objective measure of domain model performance, namely learning curves, to see if we could predict what changes could be made at the level of individual knowledge elements (concepts), or sets of concepts, to improve student performance. A key to good performance in an ITS is its ability to provide the most effective feedback possible. Feedback in ITS’ is usually very specific. However, in some domains there may be low-level generalisations that can be made where the generalised concept is more likely what the student is learning. For example, Koedinger and Mathan [2] suggest that for their Excel Tutor, one of the cognitive tutors [1], the concept of relative versus fixed indexing is independent of the direction the information is copied; this is a generalisation of two concepts, namely horizontal versus vertical indexing. We hypothesised that this might be the case for
our tutor (SQL-Tutor), which contains of a set of rules (constraints) that represent the concepts of the model. For example, an analysis of the feedback messages found that often they are nearly the same for some groups of rules. Other rules may differ only by the clause of the SQL query in which they occur (for example, the WHERE and HAVING clauses of an SQL query have substantially similar rule sets). Some systems use Bayesian student models to represent students’ knowledge at various levels (e.g. [10]) and so theoretically they can dynamically determine the best level to provide feedback, but this is difficult and potentially error-prone: building Bayesian belief networks requires the large task of specifying the prior and conditional probabilities. We are interested in whether it is possible to infer a set of high-level rules that generally represent concepts being learned while avoiding the difficulty of building a belief network, by analysing past student model data to determine significant subgroups of rules that represent such concepts. One method of analysing rules is to plot learning curves: if the objects being measured relate to the actual concepts being learned, we expect to see a “power law” between the number of times the object is relevant and the proportion of times it is used incorrectly [8]. Learning curves can be plotted for all rules of a system to measure its overall performance. In [2] Koedinger and Mathan used learning curves to argue that differences in learning existed between a specific “six-rule” and a more general “four-rule” model of the Excel domain. Learning curves can also be used to analyse groups of objects within a system, or to “mine” the student models for further information. We used this latter approach to try to determine which groups of domain rules appear to perform well when treated as a single rule. To decide which rules to group, we used a (man-made) taxonomy of the learning domain [3], and grouped rules according to each node of the taxonomy. This enabled us to measure how well the rules, when combined into more general rules of increasing generality, still exhibited power laws, and hence represented a concept that the students were learning. We then used this information as the basis for building a new version of the domain model where feedback was now given when students violated one of a set of rules that describes the new concept, rather than giving feedback specific to each individual rule. We then compared the performance of this system with that of the original SQL-Tutor. In the next section we describe the system we used in the study, and the two different versions of it that utilise the two feedback strategies. In Section 3 we present our hypotheses and discuss how we used the student models to predict the performance of groups of rules. Section 4 presents the results, while the conclusions are given in Section 5.
2 SQL-Tutor The goal of this project is to investigate whether we can predict the effectiveness of different levels of feedback by observing how well the underlying group of rules appears to measure a single concept being learned. We performed an experiment in the context of SQL-Tutor, an intelligent tutoring system that teaches the SQL database language to university-level students. For a detailed discussion of the
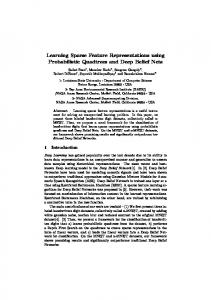
Fig. 1. A screen shot of SQL-Tutor
system, see [4, 5]; here we present only some of its features. SQL-Tutor consists of an interface, a pedagogical module—which determines the timing and content of pedagogical actions—and a student modeller, which analyses student answers. The system contains definitions of several databases and a set of problems and their ideal solutions. To check the correctness of the student’s solution, SQL-Tutor compares it to an example of a correct solution using domain knowledge represented in the form of more than 650 constraints. It uses Constraint-Based Modeling (CBM) [9] for both domain and student models. Fig. 1 shows a screen shot of SQL-Tutor. Like all constraint-based ITS, feedback is attached directly to the rules, or “constraints”, which make up the domain model. An example of a constraint is: (147 "You have used some names in the WHERE clause that are not from this database." ; relevance condition (match SS WHERE (?* (^name ?n) ?*)) ; satisfaction condition (or (test SS (^valid-table (?n ?t)) (test SS (^attribute-p (?n ?a ?t)))) ; Relevant clause "WHERE")
Constraints are used to critique the students’ solutions by checking that the concept they represent is being correctly applied. The relevance condition first tests whether or not this concept is relevant to the problem and current solution attempt. If so, the satisfaction condition is checked to ascertain whether or not the student has applied this concept correctly. If the satisfaction condition is met, no action is taken; if it fails, the feedback message is presented to the student. In this case the relevance condition checks whether the student has used one or more names in the WHERE clause; if so, the satisfaction condition tests that each name found is a valid table or attribute name. The student model consists of the set of constraints, along with information about whether or not it has been successfully applied, for each attempt where it is relevant. Thus the student model is a trace of the performance of each individual constraint over time. Constraints may be grouped together, giving the average performance of the constraint set as a whole over time, for which a learning curve can then be plotted. Fig. 2 shows the learning curve for the control group of this study, for all students and all constraints. This is achieved by considering every constraint, for every student, and calculating the proportion of constraint/student instances for which the constraint was violated for the first problem in which it was relevant, giving the first data point. This process is then repeated for the second problem each constraint was used for, and so on. The curve in Fig. 2 shows an excellent power law fit (R2 = 0.978). Note that learning curves tend to deteriorate as n becomes large, because the number of participating constraints reduces. The experimental version of SQL-Tutor was identical to the control, except feedback was no longer directly supplied by the constraints. Instead, a lookup table was provided that contained definitions of 63 high-level constraints being tested, where each was a tuple of the form (new constraint num, , feedback), where is a list of the constraints this new generalised constraint represents. The generalised constraint set is described in the next section. Learning curve for control 0.09 0.08
y = 0.0786x-0.7831 R2 = 0.9781
0.07 Error
0.06 0.05 0.04 0.03 0.02 0.01 0 1
2
3
4
5
6
7
8
Problem
Fig. 2. Example learning curve for the control group
9
10
Tables Present
All present
FROM
None missing
WHERE
Nesting in Ideal solution
FROM
No nesting in Ideal solution
All referenced
WHERE
Nesting in Ideal solution
No nesting in Ideal solution
Fig. 3. Example subtree from the SQL –Tutor domain taxonomy
3
Experiment Design
We hypothesized that some groupings of constraints would represent the concepts the student was learning better than the (highly specialised) constraints themselves. We then further hypothesised that for such a grouping, learning might be more effective if students were given feedback about the general concept, rather than more specialised feedback about the specific context in which the concept appeared (represented by the original constraint). To evaluate the first hypothesis, we analysed data from a previous study of SQL-Tutor on a similar population, namely second year students from a database course at the University of Canterbury, New Zealand. To decide which constraints to group together, we used a taxonomy of the SQL-Tutor domain model that we had previously defined [3]. This taxonomy is very fine-grained, consisting of 530 nodes to cover the 650 constraints, although many nodes only cover a single constraint. The deepest path in the tree is eight nodes, with most paths being five or six nodes deep. Fig. 3 shows the subtree for the concept “Correct tables present”. Whilst developing such a hierarchy is a non-trivial task, in practice this can actually aid construction of the domain model [6, 7]. We grouped constraints according to each node in the taxonomy, and rebuilt the student models as though these were real constraints that the system had been tracking. For example, if a node N1 in the taxonomy covers constraints 1 and 2, and the student has applied constraint 1 incorrectly, then 2 incorrectly, then 1 incorrectly again, then 2 correctly, the original model would be: (1 FAIL FAIL) (2 FAIL SUCCEED) while the entry for the new constraint is: (N1 FAIL FAIL FAIL SUCCEED) Note that several constraints from N1 might be applied for the same problem. In this case we calculated the proportion of such constraints that were violated. We
performed this operation for all non-trivial nodes in the hierarchy (i.e. those covering more than one constraint) and plotted learning curves for each of the resulting 304 generalised constraints. We then compared each curve to a curve obtained by averaging the results for the participating constraints, based on their individual models. Note that these curves were for the first four problems only: the volume of data in each case is low, so the curves deteriorate relatively quickly after that. Overall the results showed that the more general the grouping is, the worse the learning curve (either a poorer fit or a lower slope), which is what we might expect. However, there were eight cases for which the generalised constraint had superior power law fit and slope compared to the average for the individual constraints, and thus appeared to better represent the concept being learned, and a further eight that were comparable. From this result we tentatively concluded that some of our constraints may be at a lower level than the concept that is actually being learned, because it appears that there is “crossover” between constraints in a group. In the example above, this means that exposure to constraint 1 appears to lead to some learning of constraint 2, and vice versa. This supports our first hypothesis. We then tested our second hypothesis: that providing feedback at the more general level would improve learning for those high-level constraints that exhibited superior learning curves. Based on the original analysis we produced a set of 63 new constraints that were one or two levels up the taxonomy from the individual constraints. This new constraint set covered 468 of the original 650 constraints, with membership of each generalised constraint varying between 2 and 32, and an average of 7 members (SD=6). For each new constraint, we produced a tuple that described its membership, and included the feedback message that would be substituted in the experimental system for that of the original constraint. An example of such an entry is: (N5 "Check that you are using the right operators in numeric comparisons." (462 463 426 46 461 427 444 517 445 518 446 519 447 520 404 521 405 522)) This generalised constraint covers all individual constraints that perform some kind of check for the presence of a particular numeric operator. Students for the experimental group thus received this feedback, while the control group were presented with the more specific feedback from each original constraint concerning the particular operator. To evaluate this second hypothesis we performed an experiment with the students enrolled in an introductory database course at the University of Canterbury. Participation in the experiment was voluntary. Prior to the study, students attended six lectures on SQL and had two laboratories on the Oracle RDBMS. SQL-Tutor was demonstrated to students in a lecture on September 20, 2004. The experiment was performed in scheduled laboratories during the same week. The experiment required the students to sit a pre-test, which was administered online the first time students accessed SQL-Tutor. The pre-test consisted of four multi-choice questions, which required the student to identify correct definitions of concepts in the domain, or to specify whether a given SQL statement is appropriate for the given context.
Experiment versus Control 0.1
Error
0.09 0.08
Control
0.07
Experiment
0.06 0.05 0.04 0.03 0.02 0.01 0 1
2
3
4
5
6
7
8
9
10
Problem Fig. 4. Learning curves for the two groups
The students were randomly allocated to one of the two versions of the system. The course involved a test on SQL on October 14, 2004, which provided additional motivation for students to practise with SQL-Tutor. A post-test was administered at the conclusion of a two-hour session with the tutor, and consisted of four questions of similar nature and complexity as the questions in the pre-test. The maximum mark for the pre/post tests was 4.
4 Results Of the 124 students enrolled in the course, 100 students logged on to SQL-Tutor at least once. However, some students looked at the system only briefly. We therefore excluded the logs of students who did not attempt any problems. The logs of the remaining 78 students (41 in the control, and 37 in the experimental group) were then analysed. The mean score for the pre-test for all students was 2.17 out of 4 (sd=1.01). The students were randomly allocated to one of the two versions of the system. A t-test showed no significant differences between the pre-test scores for the two groups (mean=2.10 and 2.24 for the control and experimental groups respectively, standard deviation for both=1.01, p=0.53). Fig. 4 plots the learning curves for the control and experimental groups. Note that the unit measured for both groups is the original constraints, because this ensures there are no differences in the unit being measured, which might alter the curves and prevent their being directly compared. Only those constraints that belong to one or more generalised constraints were included. The curves in Fig. 4 are comparable over the range of ten problems, and give similar power curves, with the experimental group being slightly worse (control slope = -0.86, R2 = .94; experiment slope = -0.57, R2 = 0.93). However, the experimental group appears to fare better between the first and second problem for which each rule has been relevant, indicating that they have learned more from the first time they receive feedback for a constraint. In fact, the experimental curve appears to follow a smooth power law up to n=4, then abruptly plateaus. We
measured this early learning effect by adjusting the Y asymptote for each group to give the best power law fit over the first four problems, giving a Y asymptote of 0.0 for the control group and 0.02 for the experimental group. Having made this adjustment, the exponential slope for this portion of the graph was –0.75 for the control group (R2 = 0.9686) and –1.17 for the experiment group (R2=0.9915), suggesting that the experimental group learned faster for the first few problems for which each rule was applied, but then failed to learn any more (from each individual feedback message) for several more problems. In contrast, the control group learned more steadily, without this plateau effect. Note that this graph does not indicate how this feedback is spread over the student session: for example, the first four times a particular rule was relevant might span the 1st, 12th, 30th and 35th problems attempted. However, this is still a weak result. Although the generalised constraints used were loosely based on the results of the initial analysis, they also contained generalisations that appeared feasible, but for which we had no evidence that they would necessarily be superior to their individual counterparts. The experimental system might therefore contain a mixture of good and bad generalisations. We measured this by plotting, for the control group, individual learning curves for the generalised constraints and comparing them to the average performance of the member constraints, the same as was performed for the a priori analysis. The cut-off point for these graphs was at n=4, because the volume of data is low and so the curves rapidly degenerate, and because the analysis already performed suggested that differences were only likely to appear early in the constraint histories. Of the 63 generalised constraints, six appeared to clearly be superior to the individual constraints, a further three appeared to be equivalent, and eight appeared to be significantly worse. There was insufficient data about the remaining 46 to draw conclusions. We then plotted curves for two subsets of the constraints: those that were members of the generalised constraints classified as better, same or ‘no data’ (labelled “acceptable”), and those classed as worse or ‘no data’ (labelled “poor”). Fig. 5 shows the curves for these two groups. For the “acceptable” generalised constraints, the experimental group appears "poor" generalised constraints
0.08
0.08
0.07
0.07
0.06
0.06
0.05
0.05
Error
Error
"Acceptable" generalised constraints
0.04
0.04 0.03
0.03
0.02
0.02
0.01
0.01
0 1
0 1
2
3
4
5
6
7
8
Problem Control Experiment
9
10
2
3
4
5
6
7
Problem Control Experiment
Fig. 5. Power curves based on predictions of goodness
8
9
10
to perform considerably better for the first three problems, but then plateaus; for the “poor” generalised constraints the experimental group performs better for the first two problems only. In other words, for the “acceptable” generalisations the feedback is more helpful than the standard feedback during the solving of the first two problems in which it is encountered (and so students do better on the second and third one) but is less helpful after that; for the “poor” group this is true for the first problem only. We tested the significance of this result by computing the error reduction between n=1 and n=3 for each student and comparing the means. The experimental group had a mean error reduction of 0.058 (SD=0.027), compared to 0.035 (SD=0.030) for the control group. The difference was significant at p=0.01. In contrast, there was no significant difference in the means of error reduction for the “poor” group (experimental mean=0.050 (SD=0.035), control mean=0.041 (SD=0.028), p>0.3). This result again suggests that the individual learning curves do indeed predict to some extent whether generalised feedback at this level will be effective.
5 Conclusions In this experiment we explored whether learning curves could be used to analyse past student model data for predicting the behaviour of feedback that is based on generalised domain concepts. We analysed an existing set of student models by plotting learning curves for various groups of constraints (based on a taxonomy of the domain) and showed that some of these groupings appeared to perform better as a generalised concept than the underlying constraints. Such generalisations tended to be moderate, with very general concepts exhibiting poor performance. We then hypothesised that feedback applied at the level of these general concepts would be more effective than more specific feedback from the highly specific constraints currently in the domain model. We developed a feedback set that mapped to a set of moderately general concepts, and found that for some of these learning performance did appear to improve, although only for the first two or three problems, after which learning performance deteriorated. For other generalisations, performance was better only for the very first problem, and worse afterwards. We also showed that we could predict to some extent which generalised constraints would produce better performance by analysing their apparent performance in the control group. There are several tentative conclusions we can infer from these results. First, generalised feedback (when the generalisation is valid) appears to be more effective in the early stages of learning a new concept, but then becomes worse. This suggests a dynamic approach may work best. A conservative approach might be to use generalised feedback only for the first problem (for a given concept), and then revert to more specialised feedback. Alternatively, we might measure the performance of each generalisation: when it appears to be losing its effectiveness, the system could switch to specific feedback. However, the small amount of data available makes this a difficult task. More general feedback may also increase the generality of what is learned, thus leading to better knowledge transfer for different types of problems.
Despite the small amount of data and poor quality of the curves, the learning curves for individual generalised concepts did appear to be predictive. This suggests a system might be able to tailor feedback on-the-fly if it considers all of the student models when making decisions, rather than individual models. This holds promise for increased adaptability in Intelligent Tutoring Systems, and may allow a system to quickly tailor its feedback responses to the current student population. However, the data volume may be too small to individually tailor feedback in this way, so other measures may need to be employed. Students’ models contain a wealth of information about their behaviour when using an adaptive system. Learning curves are one way of measuring learning performance, and they can be applied at various levels to whole student populations or individual students, and to groups of rules versus entire domain models. The results of this study suggest that learning curves are a useful tool for mining student models for further insight.
References 1.
Anderson, J.R., Corbett, A.T., Koedinger, K.R., Pelletier, R.: Cognitive Tutors: Lessons Learned. Journal of the Learning Sciences 4(2) (1995) 167-207 2. Koedinger, K.R., Mathan, S.: Distinguishing qualitatively different kinds of learning using log files and learning curves. ITS 2004 Log Analysis Workshop Maceio, Brazil (2004) 39-46 3. Martin, B.: Constraint-Based Modelling: Representing Student Knowledge. New Zealand Journal of Computing 7(2) (1999) 30-38 4. Mitrovic, A.: An Intelligent SQL Tutor on the Web. Artificial Intelligence in Education 13(2-4) (2003) 173-197 5. Mitrovic, A., Martin, B., Mayo, M.: Using evaluation to shape ITS design: Results and experiences with SQL-Tutor. User Modelling and User Adapted Interaction 12(2-3) (2002) 243-279 6. Mitrovic, A., Suraweera, P., Martin, B.: The role of domain ontology in knowledge acquisition for ITS. Seventh international conference on Intelligent Tutoring Systems, Maceio, Brazil (2004) 207-216 7. Mizoguchi, R., Bourdeau, J.: Using Ontological Engineering to Overcome Common AI-ED Problems. International Journal of Artificial Intelligence in Education 11 (2000) 107-121 8. Newell, A., Rosenbloom, P.S.: Mechanisms of skill acquisition and the law of practice. Cognitive skills and their acquisition, J.R. Anderson, Editor. Lawrence Erlbaum Associates, Hillsdale, NJ (1981) 1-56 9. Ohlsson, S.: Constraint-Based Student Modeling. Student Modeling: The Key to Individualized Knowledge-Based Instruction, J. Greer and G. McCalla, Editors, Springer-Verlag, New York (1994) 167-189 10. Zapata-Rivera, J.D., Greer, J.E.: Interacting with Inspectable Bayesian Student Models. Artificial Intelligence in Education 14(2) (2004) 127-163