Journal of Algorithms and Optimization
Oct. 2014, Vol. 2 Iss. 4, PP. 110-128
Using Meta Heuristic Algorithms to Improve Traffic Simulation Baker Kh. Abdalhaq*1, Maher I. Abu Baker 2 College of Engineering and Information Technology, An-Najah University, P.O.Box 7, Nablus, Palestine *1
[email protected];
[email protected] Abstract-Simulation today is one of the most used tools in science and engineering. Traffic engineering is no exception. Simulators to be usable passes through processes of verification, validation and calibration. All simulators are based on assumptions and parameters that need to be calibrated so as to be practical in real world applications. Some parameters change from site to site. Therefore, the calibration process is often needed. Calibration can be seen as an optimization process that seeks to minimize the difference between observed and simulated measures. The question of which optimization technique suits more for this particular problem remains open. In this paper the convergence velocity of main heuristic optimization techniques, namely Genetic Algorithm (GA), Tabu Search (TS), Particle Swarm Optimization (PS) and Simultaneous Perturbation for Stochastic Approximation algorithm (SPSA) were used to calibrate a traffic simulation model called SUMO. The results of the calibration of the mentioned optimization techniques were compared. Classical optimization techniques, namely Neldear-Mead and COBYLA were used as a baseline comparison. Each technique has its own parameters that affect convergence velocity. Therefore, optimization techniques themselves need to be calibrated. However, TS and PS are not widely used to calibrate traffic simulators. They perform well in this particular problem. PS is highly parallel compared to the TS and SPSA. The paper shows that classical optimization techniques are not suitable for this particular problem, PS and TS appear to be better than GA and SPSA. PS seems to be a promising optimization technique. Keywords- Traffic Simulation Calibration; Genetic Algorithm; Participle Swarm Optimization; Tabu Search
I.
INTRODUCTION
Computer simulation is used in many different scientific problems that cannot be tested in practice through field experimenting environments. Traffic network is one of these problems. The processing power of modern computers offers the possibility to simulate scientific problems and give results at a rate much faster than any real environment [1]. Traffic simulation is classified according to the level of detail of the simulation. Traffic simulation classes are macroscopic, microscopic, mesoscopic, and sub-microscopic simulation models. In this research, the microscopic simulation model was used, it simulates the movement of every single vehicle on the street. This model assumes that the behavior of the vehicle depends on both, the vehicle's physical abilities to move and the driver's controlling behavior [2]. Microscopic traffic simulation models have been used extensively by transportation engineers in planning purposes of transportation engineering and in cases where field experimentation is impossible or/and costly to conduct [3]. Many microscopic simulation models are used in transportation engineering such as VISSIM, CORSIM, SUMO and others. These models use independent parameters that describe traffic flow characteristics such as driver behavior and traffic control operations. These parameters have default values provided by the models or best-guessed values that can be changed by users to represent the traffic conditions of the case under study [4]. Therefore, traffic simulation models need to be calibrated and validated. Traffic simulation model calibration is a process of adjusting model parameters and fine-tuning certain simulation inputs, such as signal control plans and Origin-Destination demand tables, such that local traffic conditions as measured by traffic flow, travel speed and/or time, can be matched closely by simulation outputs [3, 5]. Calibration and validation of traffic simulation models are necessary in assessing their value in transportation management see [3, 4]. Without validation of the traffic simulation models such as testing whether the car-following, lane-changing, gap acceptance, and route choice logic represent the real traffic behavior, the calibration of traffic simulation models will be infeasible [5]. Traffic simulation model calibration can be seen as an optimization problem with a huge search space and often a highly nonlinear and complex one. The optimization problem has often no gradient information to assist the search for an optimum. Therefore, computing techniques were applied such as Genetic Algorithm, Simulated Annealing, Complex Algorithm, Simultaneous Perturbation Stochastic Approximation Algorithm, see [5, 6, 8-11]. The most widely used among all this was Genetic Algorithm because of its easy implementation [5], but Particle Swarm and Tabu Search optimization techniques have not yet been addressed in the current microscopic traffic simulation models calibration literature that we have reviewed. The objective of this paper is to use, evaluate and compare four procedures for calibration of microscopic simulation models based on a widely used probabilistic optimization methods, namely Genetic Algorithms (GA), Particle Swarm (PS), Tabu Search (TS) and Simultaneous Perturbation for Stochastic Approximation algorithm (SPSA) which were used in many engineering and scientific applications. The results and validity of the four calibration procedures were evaluated, compared and demonstrated by using two real case studies with a real signalized road segment (simple and complex traffic network).
- 110 -
Journal of Algorithms and Optimization
Oct. 2014, Vol. 2 Iss. 4, PP. 110-128
SUMO (“Simulation of Urban MObility” ver. 0.12.1) is adopted as a widely used microscopic simulator. It is distributed as an open source, so everyone may modify it, extend it and/or use it [1]. The remainder of this paper consists of the following parts: (1) review of previous calibration studies, (2) a brief background of the real test sites, (3) the simulation model SUMO, (4) the methodology of the used procedures, (5) analysis, evaluation and comparison of the procedures used, (6) and finally, the conclusions and the recommendations. II.
REVIEW OF PREVIOUS CALIBRATION STUDIES
Many studies about calibration of traffic simulation models have been published. Table 1 shows a summary of calibration research literature, see [3, 7, 11-25, 47]. The source of this research paper is the online e-journals such as EBSCO Academic Search Premier and ScienceDirect in addition to the Internet. These studies adopted different simulation models and model parameters and various optimization methodologies for calibration. A look at the mentioned calibration studies reveals that GA and SPSA were widely used. The relevant literature lacks the use of PS and TS optimization in traffic simulation calibration. Both the computational time and the quality of the solution can be improved by means of proper techniques and by using all the available information concerning the phenomenon [36]. This study uses PS and TS in addition to the GA and SPSA in order to compare the performance of these methodologies on traffic simulation calibration. According to Punzo the search for an effective solution to the calibration problem cannot be exhausted by the choice of the most efficient algorithm [36]. In 1997 Wolpert and Macready derived “No free lunch theorems for optimization.” They state that “the expected performance of any pair of optimization algorithms across all possible problems is identical.” [49]. In 2014 Punzo derived “No Free Lunch” Theorems Applied to the Calibration of Traffic Simulation Models. He states that “there is a clear dependence between the performance of a calibration procedure and the case study under analysis and ascertain the need for global solutions in simulation optimization with traffic models.” [48]. TABLE 1 SUMMARY OF OPTIMIZATION METHODS
Study
Optimization Method
Simulation Tool
Objective Function
Network Type
Flow, Density
Freeway
Speed, Volume
Freeway
Occupancy, Flow
Freeway
Traffic Count
Roadway
Free Flow, Minimum Speed
Network
Volume
Freeway
Driver behavior parameters, vehicle performance parameters Parameters of the driving behavior models and rout choice model, O-D flow, habitual travel times
Volume, Travel time
Freeway
Travel time
Urban network
Calibration Parameters Mean Target Headway, Mean Reaction Time Mean Target Headway, Mean Reaction Time Mean Target Headway, Mean Reaction Time Mean Target Headway, Mean Reaction Time, Feedback, perturbation, familiarity
[11]
SPSA
PARAMICS
[12]
N/A
PARAMICS
[7]
GA
PARAMICS
[13]
GA
PARAMICS
[14]
Box Complex, SPSA
DYNAMIT-P
Speed-Density relationship, Capacity Car following factors, Driver‟s aggressiveness factor, O-D matrix, PT1 parameters
[15]
Simplex Algorithm
CORSIM, TRANSIMS
[16]
GA
CORSIM
[17]
Iterative approach
MITSIMLab
[18]
SPSA algorithm
MITSIMLab
Driver behavior model parameters
Traffic counts
MITSIMLab
O-D flow, behavioral parameters
Speed, Density Volume Average travel time
Freeway, Parkway Freeway and arterial Freeway
[20]
Complex algorithm Trial and error
AIMSUN
Global, Local parameters
[3]
GA
VISSIM
Eight parameters
[21]
SPSA algorithm
Microscopic simulation
Global parameters (Mean target head, mean reaction time etc) Local parameters (link headway factor, link reaction factor, etc)
Capacity
Freeway
Microscopic simulation
Various microscopic simulation parameters in VISSIM
Distribution
Freeway
[19]
Intersection
GA with Nonparametric statistical test MSA equilibration algorithm Transfer function model
EMME/2
Local parameters, global parameters
Travel time, Counts
Network
DYNASMA RT-X
N/A
Speed
Network
[25]
GA
VISSIM
Microscopic simulation parameters
错误!未
Neural Networks
VISSIM
8 microscopic simulation parameters in VISSIM
[22]
[23] [24]
- 111 -
CPI (Crash potential Index ) Travelling time, queue parameters
Intersection Urban Area (roundabout)
Journal of Algorithms and Optimization
Oct. 2014, Vol. 2 Iss. 4, PP. 110-128
找到引用 源。 III. METHODOLOGY A. Calibration as an Optimization Problem Calibration of traffic simulation model is the phase of transportation system modeling aimed at defining the values of the model‟s parameters in order to have the minimum possible distance between the traffic measurements observable in reality and those predicted by the model. This can be formulated in the following optimization framework: Min f Mobs , MSim β,γ
Subject to l ≤ βi ≤ u i = 1 … m and βi ≤ βj i ≠ j
β,i
(1)
β,i
Where β i the vectors of continuous decision variables (i.e. The model parameters to calibrate), potentially belonging to m different classes of simulation subjects (e.g. Different vehicles classes, different road types, etc.); f . Is the objective function (or fitness or loss function), measuring the distance between the observed and simulated traffic measurements M obs and Msim; lβ,i, uβ,i are model parameter lower and upper bounds. Msim = S( β1 , … , βm ), in which S( . ) is the micro-simulation model. The previous calibration studies focused on minimizing the sum of the relative error between the observed data during a certain period of time in a typical day and the simulation output for the same time period. The identification of model parameters or calibration is therefore a crucial issue [36]. Moreover, in traffic-flow microsimulation, each single evaluation of the objective function is very costly, depending on the size of the network and on the number of vehicles simulated. Computational complexity, in addition to the cost of single information regarding the objective function, has therefore steered calibration studies toward the use of heuristic optimization techniques [36]. B. Classical Optimization Methods One way to classify optimization techniques is local and global. Global optimization algorithms are defined as optimization algorithms that employ measures which prevent convergence to local optima and increase the probability of finding a global optimum. Another way to classify optimization techniques is deterministic and stochastic techniques. Stochastic techniques use some random number to generate solutions. Unlike Simplex and Gradient Descent local optimization methodologies, which are deterministic algorithms, stochastic global optimization algorithms do not get trapped in local optima. Another way to classify optimization technique is gradient based and non-gradient based techniques. Gradient based uses gradient to find its way to the local optimum. Non-gradient based tries to substitute the gradient by other means (some time heuristic). 1) Nelder-Mead Simplex Method (downhill simplex) (NM): NM simplex method is one of the classical optimization techniques that are still in use. It was introduced in 1965 by Nelder and Mead [1]. It is a deterministic simplex method for finding a local minimum of a function of several variables. For a function of n parameters, the algorithm maintains a set of n+1 function values evaluated at n+ 1 point in parameter space. This set of points defines a simplex in n dimensions. For two variables, a simplex is a triangle, and the method is a pattern search that compares function values at the three vertices of a triangle. The worst vertex, where f(x, y) is the largest, is rejected and replaced with a new vertex. A new triangle is formed and the search is continued. The process generates a sequence of triangles (which might have different shapes), for which the function values at the vertices get smaller and smaller. The size of the triangles is reduced and the coordinates of the minimum point are found. The simplex then moves toward optimum by reflecting the point with the worst function value through the centroid (average) of the remaining n points, see [40, 41]. NelderMead can‟t be used as it is for multimodal functions due to its local search nature. Converting it to global optimization method is relatively easy by repeating the method starting from randomly chosen points. This technique will add stochastic properties of the original deterministic method. For more details and options for globalization of the method, see [42]. The implementation that is developed by 'scipy' [43] community was used. Scipy is an open source library of algorithms. 2) Constrained Optimization BY Linear Approximation (COBYLA) Method: COBYLA developed by Powell in 1994 [44] is a sequential trust-region algorithm, it is based on linear approximations to the objective function and each constraint. Like NM for a function of n parameters, the algorithm maintains a set of n+1 function values evaluated at n+1 points in parameter space an approximate solution xi, and a radius ρi. Approximations to the objective function and constraint functions such that their values agree with the linear approximation on the n+1 points. This gives a linear program to solve (where the linear approximations of the constraint functions are constrained to be non-negative). However the linear approximations are likely only good approximations near the current simplex, so the linear program is given the further requirement that the solution, which will become xi+1, must be within ρi from xi. ρi only decreases, never increases. For more details, see [45, 46]. Like NM COBYLA can‟t be used as it is for multimodal functions due to its local
- 112 -
Journal of Algorithms and Optimization
Oct. 2014, Vol. 2 Iss. 4, PP. 110-128
search nature. Converting it to global optimization method is relatively easy by repeating the method starting from randomly chosen points. This technique will add stochastic properties of the original deterministic method. The implementation that is developed by „scipy‟[43] community was used also. C. Meta-heuristic Optimization Methods Meta-Heuristic-based methods use both exploration and exploitation of search space. The balance between exploration and exploitation permits the identification of local minima, at the same time it encourages the discovery of a global optimal solution. Among these, GA, PS, TS are algorithms represent currently popular methods which have found a wide range of applications in different scientific fields (see Table 1). GA, PS, and TS are population based; each iteration examines several solutions unlike SPSA that examines only two solutions in each iteration. So GA, PS and TS can be easily parallelized, but SPSA needs more efforts to be parallelized, which will be left to further future work. 1) Genetic Algorithm (GA): The GA (see Appendix A, Algorithm I) is a search technique, inspired by the concept of biological evolution, where its population is evolved by the repeated application of three major operators, namely selection, crossover and mutation operators. The algorithm starts from random population, candidate solutions are evaluated, and selection process is applied so that better solutions have more probabilities to be used in producing new population. Crossover and mutation are applied to introduce new solutions. Performing the loop once is called a generation, and this is then repeated until stop criteria is met. The balance between exploitation and exploration of the search space is controlled by adjusting selection pressure and mutation probability. Many variations of GA are found in the literature, for example [26]. The one described in [27] is used. GA has several parameters which need to be tuned, Mutation Probability (MP), generation size and type of crossover. GA operators are defined as follows: Crossover operator: in real number gene representations- as used in this study- there are many possible kinds of crossover, (for a comprehensive list see [28]). In the following, two widely used variations are presented: a)
Simple Crossover: Select random crossover point, all the parameters from the first gene to the crossover point comes from the first parent, all the parameter from the point to the end comes from the second parent. pi1 , pi2 , … , pix , pjx +1 , … , pjn
(2)
pi :parameter form the first individual i pj :parameter form the second individual j n: number of parameters. x: crossover point. b) Average Crossover: Take the average value of the parameters from all the participating individuals to generate offspring. It can have several forms depending on the number of participants (two participants or more). pi1 + pj1 pi2 + pj2 pin + pjn , ,…, 2 2 2
(3)
Pi :parameter form the first individual i pj :parameter form the second individual j n: number of parameters. Selection: Select randomly two individuals, the ones that have better fitness will survive and participate in a crossover. Mutation: Randomly change one of the parameters to randomly selected value from its feasible range. 2) Particle Swarm (PS): Inspired by social behavior of birds, fish and other living intelligence, PS is a global optimization method developed by Kennedy, Eberhart and Shi [29] (see Appendix A, Algorithm II), it works by maintaining a swarm of particles that explores the search-space influenced by the improvements discovered by the other particles. In PS the candidate solutions are the particles. They initially start from random positions and move in randomly defined directions. The direction of a particle is then gradually changed to move in the direction of the best found positions of itself and its peers, searching in their vicinity and potentially discovering better positions. Small changes in the PS implementation can cause dramatic changes in the behavioral parameters that cause good optimization performance [30]. Pederson in [30] has defined good parameters (w, cp, cg) of PS passed on comprehensive empirical experiments. For 1,000 fitness function evaluations and problem dimension of 5
- 113 -
Journal of Algorithms and Optimization
Oct. 2014, Vol. 2 Iss. 4, PP. 110-128
parameters they found that best convergence velocity will be if we set the number of particles in the swarm to 47, w to -0.1832 cp to 0.5287 and gc to 3.1913. See [30]. 3) Tabu Search (TS): TS was first proposed by Glover 1986 [31] (see Appendix A, Algorithm III) and since then it has become increasingly used in many applications. It has been successfully applied to obtain optimal or sub-optimal solutions to such problems as scheduling, timetabling, traveling salesperson and layout optimization. For example ([32, 33]). TS memorizes a list of tabu candidate solutions that are not repeated in the subsequent iterations and that is updated at each iterative step. The Tabu algorithm uses a neighborhood search procedure to iteratively move from a candidate solution to a selected one in its neighborhood, until some stopping criterion has been satisfied. The new candidate solution is accepted if it has not previously been memorized as tabu, or bad candidate solution [32]. TS is a deterministic algorithm unless some randomness in creating neighborhood is introduced. Therefore, a random neighborhood was introduced. The TS result depends on a starting solution, so a random set of solutions was used to be starting solutions that differ each time and consequently, introduce another factor of randomness. The advantage of TS is in its incorporation of adaptive memory and responsive exploration. It explores local minima and at the same time it has a strategy to explore new areas of solution space. TS is originally used for discrete optimization. However, this paper proposes an implementation of continuous domain problems. In the implementation of the above mentioned algorithm which is similar to what is described in [34]. The move can be defined either in a deterministic or stochastic way. For each parameter we have two moves, the first move is adding a small amount, and the second one is subtracting a small amount (εi) and (εai). (εi) and (εai) were called move distance and anti-move distance respectively. By this definition the neighborhood size will be twice the number of parameters. The negative sign move was called an anti-move since it actually cancels the effect of the move. Move and neighborhood definition N(θ): Move distance implementation as deterministic is defined as: εi = 0.05 ∗ (Maxi − Mini )
(4)
εai = −0.04 ∗ (Maxi − Mini )
(5)
and
Where Maxi: maximum feasible value of parameter i Mini: minimum feasible value of parameter i The move is 5% of the parameter range and the anti-move is 4% of the range. These numbers have been obtained after preliminary investigation. Smaller values will explore the neighborhood of each solution more extensively. This could make the convergence slower and larger values of many local (potentially good) solutions will be skipped. Different percentages for move and anti-move (5% and 4%, respectively) have been chosen to introduce diversity to the solutions and to help Tabu memory in avoiding repeating the same solutions and enter in cycles. If we make the move and then make the anti-move at the same dimension in a row we will be 1% distance from the original point. On the other hand, when we use the same distance for a move and anti-move we will return to the same point, when we use a move and an anti-move at the same dimension in a row. This setting helps in exploring the search space in more details (see Fig. 1).
Neighbour Solution
Move distance (ε)
Fig. 1 Tabu search move definition
Stochastic move‟s distance can be defined in many ways. In this research equation (6) was used because it gives a good exploratory factor of search to the algorithm; with this method, every number in the range of each parameter could be selected to keep solutions more divers than the deterministic of the algorithm mentioned in equations (4) and (5).
- 114 -
Journal of Algorithms and Optimization
Oct. 2014, Vol. 2 Iss. 4, PP. 110-128 𝑟𝜀𝑖 = 𝑅𝑎𝑛𝑑𝑜𝑚 ∗ (𝑀𝑎𝑥𝑖 − 𝑀𝑖𝑛𝑖 )
(6)
Where Random: is a random number between 0.0 and 1.0 that could be uniformly or any other distribution. The exponential distribution is a good candidate because it gives more emphasis on small numbers. Another important aspect of Tabu algorithm is Tabu set T(θ). To define T(θ) two types of memory - short and long were used. The latter is simply adding each selected solution to a set where all its members are considered as tabu. This will avoid moving in long cycle in the solution space. The second (short memory) is maintained by a table of tabu moves. The move is marked as tabu when its anti-move is selected as the next solution. The move is marked for (τ) number of iterations. τ is selected usually so that no more than half of the moves are marked as tabu. 4 parameters and 8 neighbors and τ equals to 2 were used as a first guess. Aspiration A(θ): is simply ignoring tabu when we have a solution that is better than all the solutions examined so far. 4) Simultaneous Perturbation for Stochastic Approximation Algorithm (SPSA): SPSA is based on gradient approximation (see Appendix A Algorithm IV), it can be used when it is difficult or impossible to directly find the gradient of the objective function. Gradient approximation is based on two measures of the objective function in each iteration. SPSA was introduced by Spall in 1987 [38]. SPSA starts for an initial guess of θ. It assumes that f(θ) is a differentiable function of θ and the optimal point of θ* correspond to zero point of the gradient. 𝑔 𝜃∗ =
𝜕𝑓 𝜃 𝜕𝜃
=0
(7)
𝜃=𝜃 ∗
The gradient is zero when for global optima in addition to all local optima, therefore the algorithm uses some stochastic vector to determine the direction of choosing values to calculate the gradient. The SPSA algorithm (Algorithm IV) described in [39] was used. D. Test Site and Simulation Model 1) Test Site 1: A real signalized segment was modelled in SUMO to test the proposed procedures for simulation model calibration. The segment is located in a vital city center see Fig. 2. It presents a real signalized segment for arterial streets that penetrate the city. The streets and the junctions have very heavy traffic at the peak hours. The traffic flows west from the main street by the hospital, which mostly witnesses traffic jam at the traffic signal in front of it. The flow from west to east also has a traffic jam because this road merges with another road that joins from the Square in the city center. At peak hours there is always traffic jam, especially, in front of the municipality with two traffic signals in only fifty meters distance which lead to a turn to the left and joins the other side of the main street.
Fig. 2 Test site 1
2) Test Site 2: Test site 2 is another real segment, which is an expansion of the test site 1 to the west. Test site 2 shows all the joints and junctions from and to city center. This expansion has the same heavy and jammed traffic characteristics. It contains more joints which may give more complicated interaction between cars see Fig-3. The topographic characteristic of test site 2 is described as flat streets up to three lanes without any downhill, but more turns and joints. The arrows inside the Fig. 3 present the direction of traffic.
- 115 -
Journal of Algorithms and Optimization
Oct. 2014, Vol. 2 Iss. 4, PP. 110-128
Fig. 3 Test site 2
3) Simulation Model: SUMO (“Simulation of Urban MObility”) is a highly portable, microscopic road traffic simulation package designed to handle large road networks. It is mainly developed by employees of the Institute of Transportation Systems at the German Aerospace Centre (DLR). SUMO is open source, licensed under the GPL. The major reason for the development of an open source, microscopic road traffic simulation was to support the traffic research community with a tool into which own algorithms can be implemented and evaluated by, without the need to regard all the artifacts needed to obtain a complete traffic simulation, such as implementing and/or setting up methods for dealing with road networks, demand, and traffic controls. By supplying such a tool, the DLR wanted to i) make the implemented algorithms more comparable, as a common architecture and model base is used, and ii) gain additional help from other contributors. Since 2001, with the first running version, SUMO has been used within a large number of projects done within the DLR. The main features of SUMO are summarized in Table 2 [35]. TABLE 2 SUMO FEATURES
Category
Simulation
Network Routing High portability
Features Complete workflow (network and routes import, DUA, simulation) Simulation Collision free vehicle movement Different vehicle types Multi-lane streets with lane changing Junction-based right-of-way rules Hierarchy of junction types A fast openGL graphical user interface Manages networks with several 10.000 edges (streets) Fast execution speed (up to 100.000 vehicle updates/s on a 1GHz machine) Interoperability with other application on run time using TraCI Network-wide, edge-based, vehicle-based, and detector-based outputs Many network formats (VISUM, Vissim, Shapefiles, OSM, Tiger, RoboCup, XML-Descriptions) may be imported Missing values are determined via heuristics Microscopic routes - each vehicle has an own one Dynamic User Assignment Only standard c++ and portable libraries are used Packages for Windows main Linux distributions exist High interoperability through usage of XML-data only
E. Selecting Optimization Parameters Like any other simulator SUMO uses physical quantities to simulate car behaviors. SUMO uses the notation of vehicle types. Each type has basic properties such as length (of the care and the distance from the heading car), acceleration, deceleration and maximum speed. Furthermore, it needs a so-called sigma parameter which introduces some random behavior that is needed by following the model used in the simulator (driver imperfection). Setting sigma to 0 makes the simulated cars behave in a deterministic way. Not all of simulator parameters have the same effect on its outcomes. Before simulation calibration, an analysis of parameters‟ sensitivity was conducted to find the relative importance of simulator parameters. Sensitivity analysis was used to find how sensitive simulator outcomes (or in our case the error) to simulator inputs (or parameters) and to have more insight on the behavior of the relationship between inputs of the simulator and the error it has. Firstly, the relative importance of each parameter and its effect on the simulation (see Table 3) was obtained by calculating the effect of changing the parameter from its minimum feasible value to its maximum feasible value while the other parameters
- 116 -
Journal of Algorithms and Optimization
Oct. 2014, Vol. 2 Iss. 4, PP. 110-128
remain constant. Max speed can be excluded from the optimization process to accelerate the convergence of optimization algorithms. Secondly, the Montecarlo based approach was used. TABLE 3 PERCENTAGE OF CHANGE IN MEAN TRAVEL TIME WHEN CHANGING EACH PARAMETER
Parameter
Max
Min
unit
Sigma
1
0.0
-
Change in travel time 54%
Acceleration
0.3*
2.9*
m/s^2
43%
Deceleration Length
0.5* 2
4.9* 10
m/s^2 m
30% 43%
Max speed
120
10
km/h
13%
The parameters that have more effects on objective function can be considered as more important. Parameters that have more effects on the error need to be calibrated to reach accurate simulation runs. Finding of the slope, which is the division of the change in the dependent variable over the independent variable, is one way to determine the relative importance of the parameters. The slope changes all over the range of the variable (the objective function is nonlinear). The slope is directed; it is negative when the direction of change in the dependent variable is as opposite to the independent variable. For the purpose of this research we want to know the effect of the independent parameters on the dependent parameters regardless of its direction, the importance of each parameter depends on the magnitude output increase or decrease not on its sign (for example, suppose we have two parameters with the same slope magnitude, the first one with negative slope and the second one with positive slope, we can say that they have the same importance regardless of the direction), so absolute values of the slopes were used. To reduce the effect of the parameters' ranges the parameters were normalized as in formula (8). 𝑋𝑛𝑜𝑟𝑚𝑖 =
𝑥 𝑖 −𝑀𝑖𝑛 𝑖
(8)
𝑀𝑎𝑥 𝑖 −𝑀𝑖𝑛 𝑖
5,000 different values uniformly distributed over the feasible ranges of the parameters were obtained. The importance index is calculated as follows: First sort the data according to the parameter J, then calculate importance index as in formula (9) 𝑒 𝑖+1 − 𝑒 𝑖 𝑛 −1 𝑖=0 𝑋𝑛 𝑜𝑟𝑚 𝑖+1 −𝑋𝑛𝑜𝑟𝑚 𝑖
(9)
𝑛
Table 4 shows the effect of changing the range in Table 3 (column 5 Change in Travel Time) and the Correlation which is an indication of linearity (Table 4 column 2 Correlation). Table 4 (column 3 the Parameter Importance Index) shows the index of importance that directions have no effect of the range and do not measure linearity. All the measures rank maximum speed as least important. We will discard maximum speed from our calibration process (see Table 3 and Table 4 ). TABLE 4 THE EFFECT OF CHANGING THE RANGE OF TRAVEL TIME , CORRELATION AND PARAMETER IMPORTANCE INDEX
Parameter Length (+ leading distance) Deceleration Sigma Acceleration Max speed
Correlation (5'000 random runs)
Parameter Importance index (PII) (formula 9) (5'000 random runs)
-0.06
0.95
-0.11 0.15 -0.23 -0.02
0.86 0.84 0.7 0.63
F. Observed Data and Error Measurement The observed data were obtained by measuring travel times in the experiment sites. The measurement was conducted in the rush hour between 7:00AM and 8:00AM by the research team (see Table 5). TABLE 5 OBSERVED VS SIMULATED TRAVEL TIMES WHEN USING DEFAULT VALUES OF SUMO
Observed travel time (s)
Simulated travel time (s)
Difference
Difference / Observed
22.9
26.5
3.6
0.157
42.4
71.9
29.5
0.695
61.1
182.5
121.4
1.987
66.4
207.1
140.7
2.118
- 117 -
Journal of Algorithms and Optimization
Oct. 2014, Vol. 2 Iss. 4, PP. 110-128
118.3
162.8
44.5
0.376
93.3
179.3
86.0
0.922
206.7
258.2
51.5
0.249
191.6
522.9
331.3
1.729
380
389.8
9.8
0.026
74.1
210.0
135.9
1.834
227
445.4
218.4
0.962
148.9
255.0
106.1
0.713
227.5
175.0
52.5
0.231
26
54.0
28.0
1.077
62.9
90.5
27.6
0.438
111.7
198.0
86.3
0.773
154
365.8
211.8
1.375
222.2
555.3
333.1
1.499
122.2
354.4
232.2
1.900
245.4
410.7
165.3
0.673
209.6
507.0
297.4
1.419
337.8
308.5
29.3
0.087
352.9
632.3
279.4
0.792
437
509.0
72.0
0.165
191.5
147.3
44.2
0.231
805
507.0
298.0
0.370
624
502.0
122.0
0.196
79.9
59.0
20.9
0.262
869
788.0
81.0
0.093
22
25.6
3.6
0.166
221.4
428.6
207.2
0.936
In table 5 each row represents the average travelling time from one source to one destination on the network. Observed values were obtained by measuring the travel time of some real vehicles travelling on the network. Several cars travelled through the network from their sources to their destinations, measuring time while travelling. Cars flow data were counted at the test sites during the same rush hours, this was conducted daily for one week (see Table 6). TABLE 6 SAMPLE OF OBSERVED CAR FLOW
INTERSECTION NAME: Al- Saqeiah Street With Omar Almokhtar Street Time ( AM ) 7:00-7:15 7:15-7:30 7:30-7:45 7:45-8:00 8:00-8:15 8:15-8:30 8:30-8:45 8:45-9:00
South Bound TH 49 104 125 119 133 93 79 77
East Bound L 18 23 30 21 17 20 22 19
R 6 15 33 29 22 28 31 29
TH 367 475 438 500 379 436 372 388
The fitness of the parameters was measured by calculating the average error (e) between simulated and observed travel times of all possible trips in the network described above as in formula (10).
- 118 -
Journal of Algorithms and Optimization
Oct. 2014, Vol. 2 Iss. 4, PP. 110-128
𝑒=
𝑛 𝑠𝑖𝑚 𝑖 −𝑜𝑏𝑠𝑒𝑟𝑣𝑒𝑑 𝑖 𝑖=1 𝑜𝑏𝑠𝑒𝑟𝑣𝑒𝑑 𝑖
(10)
𝑛
Where: sim : simulated travel time observed: observed travel time n: number of observed and simulated trips SUMO is provided with default parameters. Usually engineers use for their simulations to start with. Four model parameters in the SUMO were used: Deceleration, Acceleration, Sigma (driver imperfection) and Car length with leading distance, their default values 0.8 m/s2, 4.5 m/s2, 0.5 and 5m respectively. The error equals to 35% when default values for vehicle type were used. The four parameters were calibrated. The calibration yields the following values: Deceleration 4.11 m/s2, Acceleration 1.33 m/s2, sigma 0.59 and Car length 4.27m with error equals to 7%. This result reflects the real cases under study and could be further interpreted by specialized transportation engineering studies. IV. EXPERIMENTAL RESULTS AND DISCUSSION GA, TS, PS and SPSA were implemented using Python programming language. Fitness function was calculated after running the simulator, which is implemented in C programming language. Different outputs can be obtained after running the algorithms, which in turns running the simulator. Travel times were taken to calculate the error described above. The used optimization techniques treating the fitness function as a black-box with parameters in the real domain and output in the same domain, taking into consideration minimum and maximum feasible values of each parameter. To speed up the running time the master slave parallel computing paradigm was used. Where the master implements the optimization algorithm and slaves implements the fitness function. We used Parallel Python (PP) library to manage the parallel processes. This worked well and have reserved a lot of time, except for SPSA. A. Tuning optimization techniques Each optimization technique has its own parameters that affect its convergence to optimal solutions, and how to avoid local optima. The performance of each optimization technique depends on these parameters. To have a faire comparison, there is a need to find the values of the parameters that make the technique perform well. All used algorithms have stochastic aspects. Therefore, the experiments were repeated 10 times, then the average of repetitions was used for comparison purposes. Fitness function consists of a simulation run, which is time consuming. The total number of fitness function evaluations was kept to be 1000. 1) Tuning GA: Mutation, crossover and selection are three main components of any GA algorithms. Crossover combines solutions to create new ones. Mutation introduces new solution randomly; it is the source of perturbation. Selections eliminate bad solutions in favor of better ones, it makes pressure on solutions to force it to evolve to better solutions. High mutation rates make the algorithm behaves like random search. Low mutation rates make the algorithm behave more like local optimization technique. Likewise, very restrict selection (selection that picks only the best solutions in each iteration) also makes the algorithm behave more like local optimization technique. A combination of these operators and parameters determines the behavior of the algorithm. A proper combination that explores solution space and finds good optima is required. Literature, for example [37] uses low mutation probabilities. The result of tuning mutation probability of GA1 that uses one-point classical crossover is shown in Table 7. TABLE 7 GENETIC ALGORITHM 1 (GA1) PERFORMANCE CHANGING MUTATION
Mutation probability
Average fitness
Minimum
Maximum
% of min max difference
0.4 → 0.05
0.088
0.74
0.11
20%
0.5 →0.0625
0.086
0.079
0.10
21%
0.6 → 0.075
0.087
0.076
0.096
25%
0.7→ 0.0875
0.087
0.081
0.093
13%
- 119 -
Journal of Algorithms and Optimization
Oct. 2014, Vol. 2 Iss. 4, PP. 110-128
Table 7 shows the effect of changing mutation probability on the convergence of the algorithm after 50 iterations or 1250 loss function evaluations. Dramatic difference can‟t be seen between these values, but the optimal value seems to occur when a mutation probability is 50% for each individual (the probability that a solution is changed by changing one parameter in its vector) that is equivalent to 6.25% for each parameter. Table 8 shows the effect of changing mutation when average crossover was used. Good mutation probabilities are different from what was in GA1. Mutation introduces new solution and at the same time average crossover also introduces new values for the parameters. This may explain why less mutation probability was needed when using average crossover. GA2 (using average crossover) shows better convergence values than in GA1, which implies that average crossover has better performance than classical crossover (see Table 7 and Table 8). TABLE 8 GENETIC ALGORITHM 2 (GA2) PERFORMANCE CHANGING MUTATION
Mutation probability
Average fitness
Minimum
Maximum
0.1→0.0125
0.88
0.071
0.098
0.2→0.025
0.090
0.071
0.105
0.3→0.0375
0.083
0.074
0.088
0.4→0.05
0.85
0.070
0.099
2) Tuning Tabu: In each iteration Tabu technique searches the neighborhood of a solution and chooses the best solution to be the next candidate point. Two mechanisms prevent TS from being trapped in local optima, long term and short term memory. Long term memory is simply keeping track of all solutions used during the iterations, therefore no parameter is needed to control the memory. Our implementation of the short memory has two parameters tau for the move and cTau for the contra-move that needs to be calibrated, as described above. We have two implementations to neighborhood selection one deterministic and the other is stochastic as described above. The results of tuning these algorithms are summarized in Tables 9 and 10. TABLE 9 PERFORMANCE OF DETERMINISTIC TABU SEARCH CHANGING TAU AND CTAU
Tau
0
1
2
cTau 0 1 2
0.094 0.082 0.091
0.089 0.079 0.084
0.093 0.092 0.086
TABLE 10 PERFORMANCE OF STOCHASTIC TABU SEARCH CHANGING TAU AND CTAU
Tau
0
1
2
cTau 0 1
0.088 0.088
0.095 0.083
0.089 0.086
2
0.089
0.083
0.088
Table 9 shows tuning deterministic one, best results were obtained when tau=1 and cTau=1 as expected from the literature. Again best results are when tau=1 and cTau=1 or 2. The results are similar to the theory mentioned above that says no more than the half of moves are marked as tabu. It is clear that deterministic TS is better than the stochastic implementation (see Table 9 and Table 10). 3) Tuning PS: PS has 3 main parameters that need to be determined namely (w, cg, cp) all of them are real numbers. w represents the inertia, cg represents the contribution of global best individual, cp represents a local best solution contribution. One of the attempts to determine the optimal values for these three parameters is stated in [30]. The paper describes a process of finding optimal values for algorithm parameters (w, cp, cg). It uses a benchmark of multimodal functions and uses an optimization technique to find PS optimal parameters. The result of using these values is shown in the first row in Table 11. Using recommended parameters from [30] did not perform as expected. Using different values gave us better solutions as shown in Table 12 and Table 13. The parameters‟ values that gave better solutions was (w=0.5 cp=1.0 cg=0.5) that means an emphasis on locally found solutions more than global leader will give good results (see Tables 11, 12 and 13).
- 120 -
Journal of Algorithms and Optimization
Oct. 2014, Vol. 2 Iss. 4, PP. 110-128
TABLE 11 PS PERFORMANCE USING VALUES RECOMMENDED BY LETRETURE
Algorithm parameters
Average fitness 0.085
W=-0.1832 cp=0.5287 cg=3.1913
Minimum
Maximum
0.074
0.098
TABLE 12 TABU PERFORMANCE CHANGING CP,CG WITH W=0.5
cg cp 0.5 1.0 2.0 3.0
0.25
0.5
1.0
2.0
3.0
4.0
5.0
0.081 0.086 0.092 0.083
0.085 0.076 0.081 0.088
0.083 0.086 0.079 0.083
0.080 0.087 0.082 0.090
0.085 0.093 0.091 0.090
0.091 0.096 0.100 0.101
0.097 0.103 0.100 0.102
TABLE 13 TABU PERFORMANCE CHANGING CP,CG WITH W=0.25
cg
0.25
0.5
1.0
cp 0.084 0.089 0.084 0.086 0.085
1.0 2.0 3.0 4.0 5.0
0.087 0.078 0.077 0.080 0.087
0.089 0.082 0.084 0.083 0.085
4) Tuning SPSA: As mentioned in [39] SPSA is like other stochastic optimization algorithms which has some parameters that need to be tuned for each specific problem. There are no one-fit-all values for these parameters. The main part that influences the algorithm convergence is the two sequences 𝑎𝑘 = 𝑎/(𝐴 + 𝑘 + 1)𝛼 𝑐𝑘 = 𝑐/(𝑘 + 1)
(11)
𝛾
(12)
These sequences are controlled by parameters (a , α) and (c, γ). (a) and (c) are the step sizes that influence the changes in the solution and the gradient. While (α, γ) influence the speed of change in the sequences. The literature recommends to start with, α =0.601 and γ=0.101. We started by some preliminary tuning process, we chose a to be 1 and A =0 and c is 0.4 from the valid range of the parameter. Table 14 shows the process of fine tuning (α, γ). TABLE 14 SPSA PERFORMANCE CHANGING ALPHA AND GAMA
α (right) γ (down) 0.1 0.2 0.3 0.4 0.5 0.6
0.401
0.501
0.601
0.701
0.103 0.093 0.081 0.075 0.075 0.081
0.091 0.088 0.082 0.073 0.079 0.080
0.090 0.085 0.086 0.083 0.079 0.089
0.096 0.084 0.095 0.078 0.078 0.091
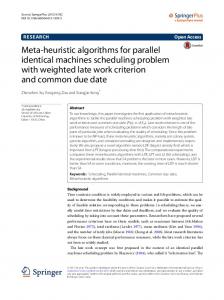
B. Comparing Optimization Techniques on Site 1 Fig. 4 summarizes the results of our experiment. Each line represents the average of ten runs of optimization algorithms. The y-axis represents the error (e) and the x-axis represents the number of executions of the fitness function. To be able to fairly compare algorithms, x-axis does not represent the number of iterations because each algorithm consumes a different number of fitness function executions in each iteration (GA1 uses 25, PS uses 47 and TS uses 8, SPSA uses 3). Fig. 4 shows the convergence of optimization algorithms, the vertical axis represents error and the horizontal axis represents the number of loss function evaluations. In terms of error reduction SPSA outperforms other algorithms within the number of loss function evaluations. SPSA is efficient and smart in using loss function values. Optimization algorithms can be ordered according to convergence velocity (by velocity, we mean error over number of loss function executions) from faster to slower as follows (see Table 15): SPSA, TS, PS and GA. Compared this order with the number of loss function values used in each iteration (SPSA 3, TS 8, GA1 25 and PS 47), it is seen that they are in the same order, except for the GA and PS. This is the same as comparing the number of iterations. Therefore, the more iterations used, the better solutions there would be. SPSA uses the biggest number of iterations, followed by TS, GA and PS. From this analysis, a conclusion can be drawn that our implementation of PS is better than our implementation of GA.
- 121 -
Journal of Algorithms and Optimization
Oct. 2014, Vol. 2 Iss. 4, PP. 110-128
0.18
error
0.16 0.14
GA1
0.12
PSO
0.1
dTS
0.08 0.06 0
200
400
600
800
1000
1200
1400
SPSA
number of loss function evalutions Fig. 4 Algorithms Performance Comparison Test Site 1 TABLE 15 ALGORITHM PERFORMANCE COMPARISON TEST SITE 1
Algorithm
Average fitness
Number of Fitness function executions
GA1 GA2
0.087 0.090
1250 1250
PS Dts sTS
0.076 0.079 0.083
1034 1000 1000
SPSA
0.073
1000
NM(Globalized)
0.104
1240
COBYLA(Globalized)
0.104
1220
One of the main advantages of TS over other optimization techniques studied in this research is the low number of parameters that need to be tuned. GA is sensitive to mutation and crossover probabilities, generation size and type of the operations (mutation and crossover). PS is very sensitive to its three parameters (w, cp, gc), while TS has only one parameter (τ). This advantage is especially important when having a computationally heavy fitness function that consumes a great amount of time and computational power that makes the task of tuning optimization technique a time consuming task. C. The Results Using Site 2 The experiment of using the optimization techniques of the calibration of simulation model SUMO has been conducted again on test site 2. Table 16 shows the effect of mutation on the result of optimization using GA1. The behavior of the algorithm of test site 2 is like the behavior of the algorithm in site 1 see Table 7. A dramatic difference can't be seen between the results of a mutation probability of 0.6 and 0.5, they are almost the same. From this a conclusion can be drawn that GA1 behaves almost the same in both experiments despite the change of the test sites. TABLE 16 GENETIC ALGORITHM 1 (GA1) PERFORMANCE CHANGING MUTATION ON TEST SITE 2
Mutation probability 0.4 0.5 0.6 0.7
Average fitness
Minimum
0.161 0.167 0.154 0.162
Maximum
0.132 0.156 0.130 0.144
0.186 0.178 0.175 0.184
Table 17 shows the effect of mutation probability on GA2 results. Even the results of site 2 are similar to the results of site1, slight shift can be seen towards more mutation probability in site 2 than in site 1. This can give an indication that site 2 needs more diversity in each generation to reach good results. Therefore, the complexity of site 2 traffic network affects the complexity of response surface of the optimized function and makes it more complex. This complexity puts more pressure on the optimization technique. Functions with smoother surfaces can be optimized easily by traditional and greedy algorithms, but real life problems are so complex that need more sophisticated techniques. TABLE 17 GENETIC ALGORITHM 2 (GA2) PERFORMANCE CHANGING MUTATION ON TEST SITE 2
Mutation probability 0.3 0.4 0.5 0.6
Average fitness
Minimum
Maximum
0.149 0.146 0.146 0.155
0.130 0.118 0.103 0.135
0.174 0.168 0.184 0.181
- 122 -
Journal of Algorithms and Optimization
Oct. 2014, Vol. 2 Iss. 4, PP. 110-128
Table 18 shows the effect of changing short memory parameters on the deterministic Tabu search. Tau equals to two moves showed clear better results than tau equals to one. Once again the result was expected. The same observation that has been mentioned above while discussing GA1 and GA2 also can be derived from Tabu search. Because test site 2 is more complex than test site1, algorithms need to explore more space and to avoid more local minima to reach good results. Algorithms that do not have strong mechanisms to avoid local minima are not practical in real problems. TABLE 18 PERFORMANCE OF DETERMINISTIC TABU SEARCH CHANGING TAU AND CTAU ON TEST SITE
Tau cTau 0 1 2
0
1
2
0.169 0.170 0.166
0.162 0.166 0.168
0.176 0.157 0.161
Table 19 shows the effect of Tau on stochastic Tabu search. From Table 19, it can be seen opposite results compared with deterministic Tabu search (Table 18). It seems that what drives the algorithm to explore the search space and to avoid local minima is the stochastic nature of its move. In stochastic Tabu search memory, has miner effect on the algorithm. When using deterministic move, memory forces the algorithm to avoid repeating the search in the same region of the search space, but when using stochastic move the random nature of the move explores new solution randomly. This can be seen from Tables 9, 10, 18, 19 that stochastic Tabu search performs better than deterministic version in more complex site. Again the same conclusion can be driven as in GA algorithms, which is that complex site 2 needs more randomness than site 1. TABLE 19 PERFORMANCE OF STOCHASTIC TABU SEARCH CHANGING TAU AND CTAU ON TEST SITE 2
Tau cTau 0 1 2
0
1
2
0.162 0.153 0.158
0.170 0.163 0.159
0.162 0.167 0.154
Table 20 shows the results of SPSA changing its parameters. It did not perform well in optimizing the error on test site 2, compared to other optimization algorithms used in this study. TABLE 20 SPSA PERFORMANCE CHANGING ALPHA AND GAMA ON TEST SITE 2
α (right) γ (down) 0.3 0.4 0.5 0.6
0.301
0.401
0.501
0.601
0.169 0.165 0.164 0.164
0.175 0.164 0.165 0.165
0.172 0.167 0.164 0.170
0.186 0.178 0.173 0.172
Table 21 shows the performance of PS using values recommended by literature. Once again, it did not perform well as in the experiments conducted for test site 1. TABLE 21 PS PERFORMANCE USING VALUES RECOMMENDED BY THE LITERATURE ON TEST SITE 2
Algorithm parameters W=-0.1832 cp=0.5287 cg=3.1913
Average fitness 0.160
Minimum
Maximum
0.147
0.172
Table 22 shows the effect of changing cp and cg on PS while w equals to 0.5. The best result was obtained when cg equals to 1 and cp equals to 2. The same conclusion as in site 1 can be derived in site 2 using PS. Emphasis on locally found solutions more than global leader, will give good results. The ratio between cp and cg remains the same, but the magnitude of both is doubled. Once again the same observation as with other algorithms can be seen with PS. The complex test site 2 needs more exploration forces than site 1. Exploration forces are expressed by accelerating particles more to make them explore more spaces and avoid local minima. TABLE 22 PS PERFORMANCE CHANGING CP,CG WITH W =0.5 ON TEST SITE 2
Cg Cp 0.5 1.0 1.5
0.5
1.0
1.5
2.0
0.161 0.152 0.155
0.158 0.146 0.156
0.161 0.152 0.148
0.159 0.155 0.151
- 123 -
Journal of Algorithms and Optimization
Oct. 2014, Vol. 2 Iss. 4, PP. 110-128
0.144 0.157
2.0 2.5
0.140 0.153
0.151 0.156
0.161 0.159
Table 23 shows that PS is the best algorithm to tackle this particular problem. The next one was GA2. GA1, sTS and dTS have similar results with some difference and SPSA was the worst excluding classical approaches (NM and COBYLA). TABLE 23 ALGORITHM PERFORMANCE COMPARISON ON TEST SITE 2
Algorithm
Average fitness
Number of Fitness function executions
GA1 GA2 PS dTS
0.154 0.146 0.140 0.157
1250 1250 1034 1000
sTS
0.154
1000
SPSA
0.164
1000
NM(Globalized)
0.187
1239
COBYLA(Globalized)
0.172
1297
Table 24 shows the final comparison of the performance of all used algorithms in both test sites. First clear conclusion is that classical approaches are not to be used in such problems. The other conclusion is that PS is a promising technique for complex problems; it performed better on the site 1 and was the best on site 2 and it can be easily parallelized. SPSA was very good in site 1 but it did not scale at the same rate as other algorithms on site 2. Still GA algorithm performs well and scales well toward more complex problems. TABLE 24 ALGORITHM PERFORMANCE SUMMARY ON TEST SITE 1 AND TEST SITE 2
Algorithm
Average fitness Site 1
Average fitness Site 2
Number of Fitness function executions
0.087 0.090 0.076 0.079
0.154 0.146 0.140 0.157
1250 1250 1034 1000
0.083
0.154
1000
SPSA
0.073
0.164
1000
NM(Globalized)
0.104
0.187
1239
COBYLA(Globalized)
0.104
0.172
1297
GA1 GA2 PS dTS sTS
V.
CONCLUSION AND FURTHER WORK
Four instances of global optimization techniques, namely GA, TS, PS and SPSA were used to calibrate microscopic traffic simulator in two real case studies (Test site 1 and Test site 2). The result shows that classical approaches are not recommended in calibrating traffic simulation models. Particle Swarm optimization technique (PS) is a promising technique for calibrating microscopic traffic simulation models and it can be easily parallelized. Simultaneous Perturbation for Stochastic Approximation algorithm (SPSA) was inconsistent on both sites. Therefore, it did not scale at the same rate as other algorithms on site 2. Genetic Algorithm (GA) performs and scales well toward more complex problems. The literature heavily depends on GA algorithms. This work shows that there are other algorithms that can be used for calibration and could give better results. Optimization techniques are sensitive to some internal parameters that affect convergence speed dramatically. These parameters need to be guessed and /or calibrated. This process is time and resource consuming. Tabu Search was found to have fewer parameters to be calibrated and was not sensitively affected by them. Potential further work has been planned to explore the same set of algorithms in other types of problems and fitness functions to test the capability of generalizing this result. On the other hand, further researches have been planned to explore the potential uses of global optimization techniques in traffic simulation other than calibration. The use of optimization as a tool to automate traffic management planning and street design is an example.
- 124 -
Journal of Algorithms and Optimization
Oct. 2014, Vol. 2 Iss. 4, PP. 110-128
REFERENCES
[1] Kotusevski and K. A. Hawick, “A Review of Traffic Simulation Software” Technical Report CSTN-095 Computer Science, Institute of Information and Mathematical Sciences, Messay University, New Zealand, July 2009. [2] D. Chowdhury, L. Santen, and A. Schadschneider, “Statistical physics of vehicular traffic and some related systems”, Physics Reports, vol. 329, iss. 4-6, May 2000, pp. 199-329, ISSN 0370-1573. [3] B. Park and H. Qi, “Development and Evaluation of a Procedure for the Calibration of Simulation Models”, Transportation Research Record: Journal of Transportation Research Board, No. 1934, pp. 208-217, 2005. [4] B. Park and J. D. Schneeberger, “Microscopic Simulation Model Calibration and Validation: A Case Study of VISSIM for a Coordinated Actuated Signal System,” In Transportation Research Record: Journal of the Transportation Research Board, no. 1856, Transportation Research Board of the National Academies, Washington, D.C., pp. 185-192, 2003. [5] M. Zhang, J. Ma, and H. Dong, “Developing Calibration Tools for Microscopic Traffic Simulation Final Report Part II: Calibration Framework and Calibration of Local/Global Driving Behavior and Departure/Route Choice Model Parameters”, University of California, Davis, California PATH Research Report, UCB-ITS-PRR-2008-7, June 2008. [6] R. L. Cheu, X. Jin, K. C. Ng, Y. L. Ng, and D. Srinivasan, “Calibration of FRESIM for Singapore Expressway Using Genetic Algorithm”, Journal of Transportation Engineering, vol. 124, no. 6, pp.526-535, 1998. [7] D. H. Lee, X. Yang, and P. Chandrasekar, “Parameter Calibration for PARAMICS Using Genetic Algorithm”, Paper presented at the 80st Transportation Research Board Meeting, 2001. [8] K. O. Kim, L. R. R., “A genetic algorithm based approach to traffic microsimulation calibration using ITS data,” 80th Transportation Research Board Annual Meeting, Washington D.C., Transportation Research Board, 2004. [9] M. Fellendorf and P. Vortisch, “Validation of the microscopic traffic flow model VISSIM in different real-world situations,” 80th Transportation Research Board, Annual Meeting, Washington D.C., 2001. [10] M. Ben-Akiva, D. Darda, M. Jha, H. Koutsiapoulos, and T. Toledo, “Calibration of microscopic traffic simulation models with aggregate data,” 83rd Transportation Research Board Annual Meeting, Washington D. C., 2004. [11] L. Ding, “Evaluation of ITS Technologies In South Jersey Priority Corridor Project”, Master Thesis, Rutgers, The State University of New Jersey, 2003. [12] Y. Gardes, A. D May, J. Dahlgren, and A. Skabardonis, “Freeway Calibration and Application of the PARAMICS Model”, Paper Presented at the 81st Transportation Research Board Meeting, 2002. [13] T. Ma and B. Abdulhai, “Genetic Algorithm-Based Optimization Approach and Generic Tool for Calibrating Traffic Microscopic Simulation Parameters,” Transportation Research Record: Journal of Transportation Research Board, no.1800, pp. 6-15, 2002. [14] K. K. Kundé, “Calibration of Mesoscopic Traffic Simulation Models for Dynamic Traffic Assignment”, Master Thesis, Massachusetts Institute of Technology, 2002. [15] K. O. Kim, and L. R. Rilett, “Simplex-based Calibration of Traffic Micro-Simulation Models with Intelligent Transportation Systems Data”, Transportation Research Record: Journal of Transportation Research Board, no. 1855, pp. 80-89, 2003 [16] G. G. Schultz and L. R Rilett., “Analysis of Distribution and Calibration of Car-Following Sensitivity Parameters in Microscopic Traffic Simulation Models”, Transportation Research Record: Journal of Transportation Research Board, no. 1876, pp. 41-51, 2004. [17] M. Jha, G. Gopalan, A. Garms, B. P. Mahanti, T. Toledo, and M. E. Ben-Akiva, “Development and Calibration of a Large-Scale Microscopic Traffic Simulation Model”, Transportation Research Record: Journal of Transportation Research Board, no. 1876, pp.121131, 2004. [18] R. Balakrishna, C. Antoniou, M. Ben-Akiva, H. N. Koutsopoulos, and Y. Wen, “Calibration of Microscopic Traffic Simulation Models: Methods and Application”, Transportation Research Record: Journal of Transportation Research Board, no.1999, pp. 198-207, 2007. [19] T. Toledo, M. E. Ben-Akiva, D. Darda, M. Jha, and H. N. Koutsopoulos, “Calibration of Microscopic Traffic Simulation Models with Aggregate Data”, Transportation Research Record: Journal of Transportation Research Board, no. 1876, pp. 10-19, 2004. [20] J. Hourdakis, P. G. Michalopoulos, and J. Kottommannil, “A Practical Procedure for Calibrating Microscopic Traffic Simulation Models”, Transportation Research Record: Journal of Transportation Research Board, no. 1852, pp. 130-139, 2003. [21] J. Ma, H. Dong, and H. M. Zhang, “Calibration of Microsimulation with Heuristic Optimization Methods”, Transportation Research Record: Journal of Transportation Research Board, no. 1999, pp. 208-217, 2007. [22] S. J. Kim, W. Kim, and L. Rilett, “Calibration of Microsimulation Models using Non-Parametric Statistical Techniques”, Transportation Research Record: Journal of Transportation Research Board, no. 1935, pp. 111-119, 2005. [23] M. Mahut, M. Florian, N. Tremblay, M. Campbell, D. Patman, and Z. K. McDaniel, “Calibration and Application of a SimulationBased Dynamic Traffic Assignment Model”, Transportation Research Record: Journal of Transportation Research Board, no. 1876, pp. 101-111, 2004. [24] X. Qin and H. S. Mahmassani, “Adaptive Calibration of Dynamic Speed-Density Relations for Online Network Traffic Estimation and Prediction Applications”, Transportation Research Record: Journal of Transportation Research Board, no. 1876, pp.82-89, 2004. [25] F. Cunto and F. F. Saccomanno, “Calibration and validation of simulated vehicle safety performance at signalized intersections,” Accident Analysis and Prevention, vol. 40, pp. 1171-1179, 2008. [26] F. Herrera, M. Lozano, and A. M. Sánchez, “A taxonomy for the crossover operator for real-coded genetic algorithms: An experimental study”, International Journal of Intelligent Systems, vol.18, issue 3, pp. 309-338, March 2003. [27] B. Abdalhaq, G. Bianchini, A. Cortés, T. Margalef, and E. Luque, “Between Classical and Ideal: Enhancing Wildland Fire Prediction Using Cluster Computing,” Cluster Computing (2006) ,vol. 9, no. 3, pp. 9329-343, July, 2006. [28] F. Herrera, M. Lozano, and J. L. Verdegay ,“Tackling Real-Coded Genetic Algorithms: Operators and Tools for Behavioural Analysis”,
- 125 -
Journal of Algorithms and Optimization
Oct. 2014, Vol. 2 Iss. 4, PP. 110-128
Artificial Intelligence Review, vol. 12, no. 4, pp. 265-319, 1998. [29] J. Kennedy, R. C. Eberhart, and Y. Shi, Swarm Intelligence, San Francisco: Morgan Kaufmann Publishers, 2001. [30] M. E. Pederson, Good Parameters for Particle Swarm Optimization, Technical Report, Hvass Laboratories, 2010. [31] F. Glover, “Future paths for integer programming and links to artificial intelligence,” Computers and Operations Research, vol. 13, pp. 533-54, 1986. [32] F. Glover and M. Laguna, Tabu search, in: Modern Heuristic Techniques for Combinatorial Problems, C. Reeves, ed., Blackwell Scientific Publishing, Oxford, pp. 70-150, 1993. [33] F. Glover and M. Laguna, Tabu Search, Kluwer Academic Publishers, Boston, 1997. [34] B. Abdalhaq, “A Methodology to Enhance the Prediction of Forest Fire Propagation”, ISBN B-37666-2004 / 84-688-7781-6, Doctoral Thesis, 2004. [35] SUMO, Microscopic Road Traffic Simulation Package, Institute of Transportation Systems at the German Aerospace Center.[online]. Available: http://sumo.sourceforge.net [36] B. Ciuffo, V. Punzo, and V. Torrieri, “Comparison of Simulation-Based and Model-Based Calibrations of Traffic-Flow Microsimulation Models”, Transportation Research Record:Journal of the Transportation Research Board, no. 2088, Transportation Research Board of the National Academies, Washington, D.C., pp. 36-44. DOI:10.3141/2088-05, 2008. [37] M. M. Ali and A. Törn, “Population set based global optimization algorithms : some modifications and numerical studies”, Computers and Operations Research, vol. 31, no. 10, pp. 1703-1725, 2004. [38] J. C. Spall “A stochastic approximation technique for generating maximum likelihood parameter estimation,” proceedings for American control conference, pp. 1161-1167, 1987. [39] J. C. Spall “Implementation of the Simultaneous Perturbation Algorithm for Stochastic Optimization” IEEE, Transactions on aerospace and electronic systems, vol. 34, no. 3, July 1998 [40] J. A. Nelder, and R. Mead, “A simplex method for function minimization,” The Computer Journal, vol. 7, pp. 308-313, 1965. [41] M. H. Wright, “Direct Search Methods: Once Scorned, Now Respectable,,” in Numerical Analysis 1995, Proceedings of the 1995 Dundee Biennial Conference in Numerical Analysis, D.F. Griffiths and G.A. Watson (Eds.), Addison Wesley Longman, Harlow, UK, pp. 191-208, 1996. [42] M. A. Luersen and R. L. Riche, “Globalized Nelder–Mead method for engineering optimization”, Computer & structures Computational Structures Technology, vol. 82, iss. 23-26, pp. 2251-2260, September-October 2004. [43] E. Jones, T. Oliphant, P. Peterson, and others, (2001) “SciPy: Open Source Scientific Tools for Python. [online]. Available: http://docs.scipy.org/doc/scipy/reference/tutorial/optimize.html [44] M. J. D. Powell, “A direct search optimization method that models the objective and constraint functions by linear interpolation,” in Advances in Optimization and Numerical Analysis, eds. S. Gomez and J-P Hennart, Kluwer Academic (Dordrecht), pp. 51-67, 1994. [45] M. J. D. Powell, “Direct search algorithms for optimization calculations,” Acta Numerica 7, pp. 287-336, 1998. [46] M. J. D. Powell, “A view of algorithms for optimization without derivatives,” Cambridge University Technical Report DAMTP 2007/NA03, 2007. [47] Otkovic, et al, “Calibration of microscopic traffic model using neural network approach,” Expert systems with applications, vol. 40, pp. 5965-5974, 2013. [48] B. Ciuffo and V. Punzo, “No Free Lunch” Theorems Applied to the Calibration of Traffic Simulation Models,” Intelligent Transportation Systems, INSPEC Accession Number:14210749, Digital Object Identifier :10.1109/TITS.2013.2287720, vol. 15, no. 2, pp. 553-562, 2014. [49] D. H. Wolpert and W. G. Macready, “No Free Lunch Theorems for Optimization,” IEEE TRANSACTIONS ON EVOLUTIONARY COMPUTATION, vol. 1, no. 1, April 1997. Baker K. Abdalhaq received both his first degree from PSUT in Jordan and his PhD in Computer Science from the Universitat Autonoma de Barcelona (UAB), Spain, in 1994 and 2004, respectively. Baker is currently an assistant professor of Computer Science at the AnNajah National University, Nablus, Palestine. He is a member of the faculty of Engineering and Information Technology, and the head of Computer Information Systems Department for 7 years. He was the dean of faculty of Information Technology. His current research interests are Computational Science, Heuristic optimization techniques and Simulation.
Maher I. Abu Baker received his first degree (B.Sc.) from Al-Quds University, College of Science & Technology in Jerusalem, Palestine in 1992 in Computer Science and MBA from An-Najah N. University in Nablus, Palestine in 2001. At present he is a faculty member at An-Najah National University, Faculty of Engineering and Information Technology, Management Information System Department. He was the Head of Management Information Systems Department, An-Najah N. University, Faculty of Engineering and Information Technology [2004-2010]. His research interests are developing business information systems (DSS), computational sciences and computer simulation.
- 126 -
Journal of Algorithms and Optimization
Oct. 2014, Vol. 2 Iss. 4, PP. 110-128
APPENDIX A ALGORITHM I GENETIC ALGORITHM
1.
Randomly generate the first population of individuals potential solutions
2.
Evaluate the fitness function for each population member
3.
While not ( number of iteration reached) : obtain a new generation by repeat 1.
Selection of two individuals
2.
Crossover of selected individuals
3.
According the mutation probability, randomly mute the output of previous step.
4.
Until a new population has been completed.
end while
ALGORITHM II PARTICLE SWARM OPTIMIZATION
1.
𝑖𝑛𝑖𝑡𝑖𝑎𝑙𝑖𝑧𝑒(𝜃) // initial swarm usually random
2.
for each particle 𝑥 ∈ 𝜃: for each dimension i 𝑥𝑣𝑖 = 𝑤 ∗ 𝑥𝑣𝑖 + 𝑐𝑝 ∗ 𝑟𝑎𝑛𝑑𝑜𝑚 ∗ (𝑝𝑏𝑒𝑠𝑡𝑖 − 𝑥𝑖 ) + 𝑐𝑔 ∗ 𝑟𝑎𝑛𝑑𝑜𝑚 ∗ (𝑔𝑏𝑒𝑠𝑡𝑖 − 𝑥𝑖 ) // calculate velocity 𝑥𝑖 = 𝑥𝑖 + 𝑥𝑣𝑖 // update particle position
3.
While stop criteria not reached, Go to step 02
Where: xvi : dimension i velocity component xi : dimension i of particle position (parameter i of the solution) random : uniformly distributed random variable in the interval [0,1] gbesti : global best value found so far of dimension i pbesti : particle best value found so far of dimension i w,cp,cg :tunable method parameters that affect the convergence velocity. The parameters simply define the contribution of each term.
- 127 -
Journal of Algorithms and Optimization
Oct. 2014, Vol. 2 Iss. 4, PP. 110-128
ALGORITHM III TABU SEARCH
Generate initial solution θ While not finished identify N(θ) (Neighborhood set) by applying moves identify T(θ) (tabu set) identify A(θ) (aspiration set) choose θ' in N(θ)-T(θ) U A(θ), for which f(θ') is optimal change θ by θ' End wile
ALGORITHM IV SIMULTANEOUS PERTURBATION FOR STOCHASTIC APPROXIMATION ALGORITHM ( SPSA )
Step 1: Initialization Set k=0 Pick initial guess of 𝜃0 and nonnegative coefficients (a,c,A,α and 𝛾) 𝑎𝑘 = 𝑎/(𝐴 + 𝑘 + 1)𝛼 𝑐𝑘 = 𝑐/(𝑘 + 1)𝛾 Step 2: Generation of Simultaneous Perturbation Vector 1 Generate ∆𝑘 which is a Bernoulli ±1 distribution with probability of 2 for each ±1outcome Step 3: Loss Function Evaluations Obtain two measures of the function: 𝑦+ = 𝑓(𝜃𝑘 + 𝑐𝑘 ∆𝑘 ) and 𝑦− = 𝑓(𝜃𝑘 − 𝑐𝑘 ∆𝑘 ) Step 4: Gradient Approximation 𝑔𝑘 (𝜃𝑘 ) = Step 5: Update 𝜃 estimate
𝑦+ − 𝑦− 2𝑐𝑘
∆−1 𝑘1 ∆−1 𝑘2 ⋮ ∆−1 𝑘𝑝
𝜃𝑘+1 = 𝜃𝑘 − 𝑎𝑘 𝑔𝑘 (𝜃𝑘 ) Step 6: iteration or termination If termination condition not met, return to step 2 with k+1 replacing k.
- 128 -