Page 1 ... use linear least squares optimization to determine the values of the coefficients, ci ... ing a PLUS operator, the optimisation algorithm adjusts the coeffi-.
Using Multiobjective Genetic Programming to Infer Logistic Polynomial Regression Models Dr. Andrew Hunter1 Abstract. In designing non-linear classifiers, there are important trade-offs to be made between predictive accuracy and model comprehensibility or complexity. We introduce the use of Genetic Programming to generate logistic polynomial models, a relatively comprehensible non-linear parametric model; describe an efficient twostage algorithm consisting of GP structure design and Quasi-Newton coefficient setting; demonstrate that Niched Pareto Multiobjective Genetic Programming can be used to discover a range of classifiers with different complexity versus “performance” trade-offs; introduce a technique to integrate a new “ROC (Receiver Operating Characteristic) dominance” concept into the multiobjective setting; and suggest some modifications to the Niched Pareto GA for use in Genetic Programming. The technique successfully generates classifiers with diverse complexity and performance characteristics.
1
INTRODUCTION
A variety of powerful non-linear classifiers are now in use, including neural networks, support vector machines, and fuzzy logic. These techniques trade off various desirable properties, including: the ability to specify prior knowledge and to constrain the functional form; the performance of the classifier; the comprehensibility of the inferred model; the complexity of the model. Optimizing the coefficients in a model of fixed architecture is non-trivial, but well understood; however, methods to automatically select the “model architecture” are not as well developed. In this paper we describe how to infer logistic polynomial classifiers, which are concise and relatively comprehensible models compared with popular non-linear alternatives. The technique is suitable for multivariate problems with moderate numbers of variables. We use multiobjective genetic programming to infer the polynomial (number and structure of terms), and to sample a range of models that trade-off two important performance measures: model complexity and classification performance as measured by ROC curves. We also define a specialised initialisation operator to sample the Pareto front efficiently, and introduce the concept of ROC dominance as a key criterion in multi-objective optimization.
2
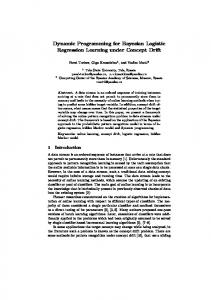
p(x) = c1 x1 x22 + c2 x1 x2 + c3 .
(1)
MULT x2
PLUS MULT x1
x
1
x2
Figure 1. A simple polynomial Genetic Program
POLYNOMIAL MODELLING WITH GENETIC PROGRAMMING
2.1
Polynomial Regression
Many modelling techniques distinguish between the structure of the model, which is often fixed by the model designer, and coefficients that are adjusted by a learning algorithm. In general, procedures for 1
adjusting coefficients are more efficient than those for searching alternative structures. For example, in polynomial regression, we specify that the predictor has the form given for p(x) in equation 2, then use linear least squares optimization to determine the values of the coefficients, ci (although the model is non-linear in the input variables, xi , it is linear in the coefficients). For problems with a single input variable, or a very small number, P N , it is possible to include all terms up to some order P (there N! are P j=1 (N −j)! of order P ), to optimise the coefficients, then to remove terms with near-zero coefficients. However, for multivariate problems with even moderate numbers of input variables the number of terms is prohibitive, and multivariate polynomials are seldom used. Genetic Programming [10] evolves tree-based S-expressions; in the context of predictive modelling it is known as symbolic regression. GP is an effective constructive mechanism for inferring expressions, although the ability to determine numeric coefficients is poor. The standard technique is to include constants as a special terminal symbol, the ephemeral constant [10]. If we restrict the operator set to {PLUS,MULT}, and the terminal set to the input variables, {xi }, then the GP S-expression may be interpreted as the polynomial form [12]. The coefficients of the polynomial are inserted, together with a constant term, and optimized by standard least-squares. For example, the GP shown in figure 1, which is expressed in Polish notation as (∗(+(∗x1 x2 )x1 ) x2 ), translates to the polynomial:
University of Durham, Co. Durham, DH1 3LE, UK
This algorithm neatly divides the model-building task into two parts: structure inference, for which GP is well-suited; and coefficient optimisation, at which GP is poor and standard optimisation techniques are extremely good. The two stages complement one another; for example, the GP may discover two small polynomials each of which individually performs a successful regression. If crossover combines both polynomials into the same S-expression us-
ing a PLUS operator, the optimisation algorithm adjusts the coefficients to weight the contributions. In contrast, if ephemeral constants are used crossover is usually disruptive.
2.2
Logistic Polynomial Regression
In this paper we extend the GP polynomial regression approach [12] to classification, albeit at the expense of a more complex optimisation procedure. We consider a polynomial logistic model of the form: f (x) =
X Y ti,j 1 where p(x) = ci xj , ti,j ∈ N+ −p(x) (1 + e ) i j
(2) – that is, the model consists of a logistic function applied to a polynomial. The logistic function, which has the output range (0, 1), is appropriate for probability estimation. With a first-order polynomial the model reduces to the standard logistic regression technique, which is the most appropriate predictive model given normal class distributions with equal mean and covariance matrices; quadratic or higher order polynomials are appropriate when the distributions do not follow this form (e.g. if the classes follow two normal distributions with unequal covariance matrices, the iso-probability contours are known to be quadratic). The technique can combine variable selection (by excluding variables from all terms) and model selection, using a sparse representation of quadratic and higher order equations. The use of the logistic function makes least-squares optimisation impossible. To optimize the coefficients by maximum likelihood, we instead minimize the cross-entropy error function (the derivation in the context of neural networks is given in [2]): E=−
X
tn log yn + (1 − tn ) log(1 − yn )
(3)
n
where tn is the nth observed output, and yn the nth prediction. We can determine the partial differentials of this error function with respect to the coefficients, ci , by applying the chain rule. ∂(f (x)) ∂(p(x)) ∂E ∂E = . . ∂ci ∂(f (x)) ∂(p(x)) ∂(ci ) The first and second terms differentiate to: � � ∂E yn − tn = . (yn (1 − yn )) = yn − tn . ∂(p(x)) yn (1 − yn )
(4)
(5)
As p(x) is linear in the coefficients, the remaining term also reduces simply, so that: Y ti,j ∂E = (y n − tn ) xi ∂ci j
(6)
Exploiting the error function and partial differentials, we can deploy any of the known techniques in standard non-linear optimization to determine the coefficients. We used Quasi-Newton (BFGS) [11], a very fast iterative technique. Compared with other non-linear classifiers, such as neural networks, the logistic polynomial model is parsimonious, and (if there are not too many terms) relatively comprehensible. This is critical in some problem domains, such as medical data analysis, where a “black box” model cannot be deployed.
3
MULTIOBJECTIVE OPTIMISATION
3.1
Performance and Complexity
Maximum likelihood may be used to optimise the coefficients against the error function. However, we often desire to optimise a number of aspects of the model, including: model performance (which may be best measured by an objective function other than the cross entropy, such as performance in ROC curve analysis); model efficiency (time requirements for execution and/or optimisation and memory requirements); and comprehensibility. Efficiency and comprehensibility are often rolled up together into complexity, where a lower complexity model is sought. Lower complexity models also tend to generalize better, which addresses performance. Multiobjective optimisation attempts to find models that maximize a number of objective function measures, M = {m1 , m2 , ..., mk }, without combining them into a single objective. They are inherently population based, in that they establish a number of solutions representing different trade-offs between objectives. The decision about acceptable trade-offs between objectives may then be made a posteriori, after inference, rather than a priori. The key concept in Multiobjective optimization is the Pareto optimal set [1]. Given two models, A and B, we say that A Â B (A dominates B) if A has at least one objective value strictly greater than B, and all objective values at least equal to B: A Â B ⇐⇒ ∀i, mi (A) >= mi (B); ∃i, mi (A) > mi (B) (7) The Pareto-optimal set consists of all non-dominated solutions (i.e. those that are not dominated by any other solution). Multiobjective algorithms search across a Pareto front — the non-dominated subset of the models found during the search.
3.2
ROC Dominance
Most forms of classifier produce a confidence measure or probability estimate, then make a decision by comparing this with a decision threshold, θ: cases above the threshold are assigned to the positive class, and cases below to the negative class. The decision threshold may be set to minimize the overall error rate, to equalize error rates on the two classes, or with respect to a loss matrix [2] expressing the relative costs of false positive and false negative misclassification (sensitivity and specificity). In some applications (e.g. medical analysis) we may adjust the threshold to trade-off sensitivity against specificity; consequently, classifiers that perform well at a variety of thresholds are desired. The usual method to characterize classifier performance across the threshold value, θ, is the Receiver Operating Characteristic (ROC) curve [13]. This plots sensitivity against 1−specificity, as θ is adjusted; for example, in figure 2, model C is inferior to models A and B at any threshold, whereas models A and B are better at different points on the curve. This implies that each fits the conditional probability function more accurately along certain iso-probability contours than the other. If we are forced to commit to a single model, we may specify the threshold first, or select the one with the highest area under the ROC curve – this area summarizes the performance of the classifier across the threshold range. Emmanouilidis [5] recently suggested integrating sensitivity and specificity as objectives in multiobjective optimisation, using a fixed threshold. In this paper we introduce an alternative approach, treating a model as dominating another only if it does so along the entire ROC curve. We define the concept of ROC domination as follows.
measure of complexity, as this is related to polynomial complexity, and acts to prevent bloating[3]. Arguably direct measures of polynomial complexity could also be included, but our main interest in this paper is the effect of ROC dominance, not complexity control.
1
Sensitivity
0.8
0.6
0.4
4 0.2
0
Model A Model B Model C 0
0.2
0.4 0.6 1−−specificity
0.8
1
Figure 2. Receiver Operating Characteristic (ROC) Curve
Let Sθ (A) and Qθ (A) be the sensitivity and specificity respectively of model A at decision threshold θ. Then we define A ÂR B as follows: Let Q(s, A) = max{Qθ (A) | Sθ (A) ≥ s} θ
� A ÂR B ⇐⇒
∀s, Q(s, A) ≥ Q(s, B) , ∃s, Q(s, A) > Q(s, B)
(8) (9)
– the specificity of A is at least that of B at all sensitivity levels, and is strictly greater in at least one place. This ROC dominance concept may be used in any multiobjective optimization procedure concerned with classifier performance. ROC dominance may be determined algorithmically as follows. For each classifier, construct a decision table, Di , which has a row for each training case, and columns for the model’s confidence estimates, yi and the corresponding observed class, ti . Sort the table in descending order of confidence. Next, construct look-up tables, Si , that give the best True Negative (TN) rate achievable at each True Positive (TP) rate (these figures are proportional to specificity and sensitivity respectively). To construct this table, initialise TN=N , where N is the number of negative cases in the training set, and TP=0. This corresponds to the decision taken if θ > maxi {yi }. As θ is lowered, cases are transferred out of the TN count, if the case is actually a negative, or into the TP count, if the case is actually a positive. Several TN values may be encountered for a given TP – the first found is the best achievable. Once the TN look-up tables are available, checking for ROC dominance follows trivially from equation 9. sort( D1, 1 ); % sort by confidence level tn := no_negatives; i := 0; for j = 1 to N if D1(j,2) = 1 % -ve case tn := tn-1; else % +ve case i := i+1; S(i) := tn; end end In practice, two similar classifiers may have marginally overlapping ROC curves, in which case we may wish to allow one to dominate the other if it is better in other objectives. We therefore modify the ROC dominance condition so that classifiers are considered ROC equal if the overlap is below a threshold proportion (we use 0.05). ROC dominance may be combined with other objectives in a multi-objective setting. We use the tree size (number of nodes) as a single, simple
MUTIOBJECTIVE GENETIC PROGRAMMING
Recently, Emmanouilidis [6] [7] has extensively investigated the use of Multiobjective Genetic Algorithms to select for both performance and model complexity objectives, in the context of feature selection for non-linear models, including neural networks and fuzzy logic systems. His work is based mainly on the use of the niched Pareto GA [9]. Polynomial inference is closely related to feature selection (it can be posed as such if we introduce all interaction terms up to some order as new variables, although in practice the number of variables rapidly spirals out of control). There has also been recent interest in using MOGAs to control bloat in Genetic Programming [3] [4]. Rodr´ıguez-V´azquez [12] used the MOGA designed by Fonseca and Fleming [8] to optimise a number of performance and complexity measures in GP, and also demonstrated the division of effort between GP structure design and coefficient optimisation by least squares in the context of polynomial modelling. In this paper we consider the use of the niched Pareto GA in Genetic Programming. The niched Pareto GA [9] maintains a population, and a separate non-dominated set, which contains copies of all solutions found on the Pareto front (if this set reaches a maximum size, it is pruned by niching). Selection is implemented by generating a separate mating set; once generated, the mating set is subjected to crossover, mutation or cloning to generate the new population, and the non-dominated set is updated. A specialised form of tournament selection is used. The tournament members are selected from the union of the population and the non-dominated set, introducing an elitist element to the algorithm. Rather than competing with each other they are compared with a larger dominance set randomly selected from the current population. If there exists a single tournament member non-dominated by all members of the dominance set, it is copied to the mating pool. If two or more tournaments members are non-dominated, or if all are dominated, a niching strategy is used to decide which should be placed in the mating pool. Each is compared against existing members of the mating pool, and the one with the best niche score, Ni , is chosen. The niche score reflects similarity to the existing members of the mating pool, and may be phenotypic or genotypic.
4.1
Unbiased initialisation
To apply the niched Pareto GA to Genetic Programming, a number of adjustments need to be made. Emmanouilidis [6] demonstrated the importance of establishing and maintaining a population that samples the Pareto front widely, and defined special initialisation and mutation operators to achieve this in the context of feature selection. In GA feature selection, standard crossover tends to average the number of features selected between parents, necessitating a specialized crossover operator. However, in GP crossover does not have this effect – complexity levels may converge or diverge, but tend to stay approximately the same. In contrast to mutation, standard GP initialisation (where the Sexpression is formed by randomly assigning either a terminal or operator with a fixed probability, and recursively continuing until a maximum depth is reached or all terminals have been generated) is biased,
with different probability levels for different sizes of tree. We define a uniform size initialisation algorithm as follows:
Table 1. GA Settings
1. Choose the number of terminals, T , using a uniform random selection in the range [1 − M ]; 2. Create a tree consisting a single terminal; 3. Iterate until the tree has T or more terminals:
Population Non-dominated set size Tournament size Dominance group size Generations Crossover rate Mutation rate
(a) Select an existing terminal by uniform random selection.
100 25 2 10 100 0.3 0.3
(b) Convert it into a randomly-selected operator, and add operand terminals. The algorithm may generate slightly more than T terminals if the last operator injected has too many operands, but is unbiased.
4.2
K Nearest Neighbor Niching
To perform niching, we require a distance metric between models. We define the distance between two polynomials, pi and pj , as the sum of the orders of the distinct terms (coefficients are ignored): D(pi , pj ) = C(pi − pj ), where C(p) =
XX i
ti,j .
(10)
j
Rather than calculating a niche count as recommended in Horn [9], we use a K-nearest neighbor algorithm, setting the niche score to the mean of the distance to the K nearest members of the mating pool (the neighborhood, K) – see equation 11. This has the benefit that we do not need to set an arbitrary niche radius. The tournament member with the best score is selected. Ties are broken arbitrarily. P K D(pi , pk ) Ni = . (11) K
5
EMPIRICAL STUDY
There are some difficulties in empirically evaluating the proposed algorithm. First, we are not aware of any comparable algorithm that attempts to induce a ROC-diverse set of models. A comparative study is therefore not possible. Instead, we present some qualitative results regarding the diversity of the induced solutions, and briefly analyze the consistency of the algorithm in sampling the Pareto front. We also compare the classifiers’ performance with two alternative approaches: a logistic regression model, which is equivalent to a first order logistic polynomial and therefore acts as a “vanilla” baseline; and an RBF neural network, a non-linear model which performs well on this data set. In both cases, the comparison is again qualitative as we are interested in relative performance across the ROC curve. We have experimented with a number of data sets, but for the sake of brevity here we present results on only one – the standard Ionosphere data set (additional results are presented at http://www.durham.ac.uk/andrew1.hunter/LogPoly/). The ionosphere data set has a strongly non-linear relationship between variables. For computational tractability (and bearing in mind the need for repeated experiments) we experiment with just the first 10 input variables. The data was randomly shuffled, with 200 cases assigned to training and 151 to test. Again, for reasons of computational complexity we did not attempt a more sophisticated evaluation utilizing resampling (which affects the accuracy of the performance estimates rather than the behavior of the induction algorithm). All runs use the parameters shown in table 1.
5.1
Performance
In this section we compare the performance of the logistic polynomial classifiers with a standard baseline technique, logistic regression, and a Radial Basis Function neural network. The former is equivalent to a logistic polynomial that contains all variables as firstorder terms, and no quadratic or higher order terms, and is a standard statistical technique in widespread use. The RBF network is a relatively sophisticated non-linear method with good performance. We would not expect any technique to perform significantly better, and so it acts as an informal “gold standard” for our algorithm. A typical run generated a full complement of 25 non-dominated solutions (the maximum we permitted in the non-dominated set), with tree sizes varying from 1–35 nodes, number of terms from 2– 38, order from first to fifth. Figure 3 shows the ROC curves for the two benchmark algorithms and three of the best logistic polynomial classifiers found. The first classifier shown is an 18 term cubic that uses six of the variables. Performance is slightly inferior to that of the neural network. However, the fact that standard statistical approaches (as used for logistic regression) to validate models may be used, and that some users such as clinicians demand an explicit model, makes it a very useful alternative. Illustrated on the same graph is a 13 term quadratic that also uses 6 variables – the relative simplicity comes at the cost of some decrease in performance. The third classifer shown is a three term quadratic, that uses only three variables (p(x) = 2.97x1 x7 − 3.48x24 − 0.21). This is a substantially more compact classifier than logistic regression, with excellent comparative performance. 1
1
0.8
0.8
0.6
0.6
0.4
0.4 Log. Regression RBF Cubic Quadratic
0.2
0
0
0.2
0.4
0.6
0.8
Log. Regression RBF Quadratic (3 term)
0.2
1
0
0
0.2
0.4
0.6
Figure 3. ROC Comparison against benchmark models.
0.8
1
5.2
Consistency
6
To characterize consistency, we conducted ten runs of the algorithm, and computed the full non-dominated front across all classifiers tested. For this comparison we use the strict definition of nondominance, where any overlap in the ROC curves implies mutual non-domination. There were a total of 51 such non-dominated classifiers, over 14 distinct complexity levels, reflecting the fact that classifiers with marginally overlapping ROC curves are not uncommon. Rather than testing individual runs to see if they locate all the overlapping non-dominated solutions at each complexity level, we check whether a run has found at least one non-dominated solution at each complexity level (a run may find several overlapping solutions per complexity level). Figure 4 shows the proportion of runs that discover a non-dominated solution against complexity level (only odd-valued complexity levels are available, as binary trees have an odd number of nodes). The consistency drops quite rapidly, indicating that the algorithm has trouble sampling the admittedly large Pareto front for the more complex models (there are 265 quadratics alone). 0.9
Proportion front found per run
0.8 0.7 0.6 0.5 0.4 0.3 0.2 0.1 0
0
10 20 30 Number of Tree Nodes
40
Figure 4. Consistency between Runs
Figure 5 shows the generation on which the algorithms first discovered a member of the overall non-dominated set. The approximately linear relationship implies that running the algorithm for a longer period might well yield better, and more consistent, results. The computational costs of the algorithm make this difficult to justify – the algorithm took approximately 24 hours on a P800 per run.
Proportion of non−dominated front found
1
0.8
0.6
0.4
0.2
0
0
20
40 60 80 Generation of first discovery
100
Figure 5. Discovery of new non-dominated solutions
CONCLUSION
We have described an approach to use logistic polynomial models in conjunction with Multiobjective Genetic Programming to infer nonlinear classifiers from data. We have shown how to optimise the coefficients of these models in the maximum likelihood paradigm using Quasi-Newton. We have introduced the concept of ROC dominance, and shown how it can contribute to the exploratory capabilities of multiobjective algorithms with classifier performance as one general objective. We have also introduced the use of a uniform complexity initialisation operator for Genetic Programming, and the use of K nearest neighbour in niche scoring. We have demonstrated that this technique may be used to infer parsimonious and comprehensible non-linear classifiers, and that a diverse range of such models (trading off parsimony versus performance) may be generated. Performance is inferior to a neural network on the data set we used, but better than logistic regression while maintaining the relatively high analytic tractability of the latter.
REFERENCES [1] A. Ben-Tal, ‘Characterization of pareto and lexicographic optimal solutions’, in Multiple Criteria Decision Making Theory and Application, eds., Fandel and Gal, 1–11, Springer-Verlag, (1979). [2] Christopher M. Bishop, Neural Networks for Pattern Recognition, Clarendon Press, Oxford, 1995. [3] Stefan Bleuler, Martin Brack, Lothar Thiele, and Eckart Zitzler, ‘Multiobjective genetic programming: Reducing bloat by using SPEA2’, in Proceedings of the Congress on Evolutionary Computation, CEC-2001, eds., L. Spector, E. Goodman, A. Wu, W.B. Langdon, H.-M. Voigt, M. Gen, S. Sen, M. Dorigo, S. Pezeshk, M. Garzon, and E. Burke, pp. 536–543, IEEE Press, (2001). Piscataway, NJ. [4] Edwin D. De Jong, Richard A. Watson, and Jordan B. Pollack, ‘Reducing bloat and promoting diversity using multi-objective methods’, in Proceedings of the Genetic and Evolutionary Computation Conference, GECCO-2001, eds., L. Spector, E. Goodman, A. Wu, W.B. Langdon, H.-M. Voigt, M. Gen, S. Sen, M. Dorigo, S. Pezeshk, M. Garzon, and E. Burke, pp. 11–18, San Francisco, CA, (2001). Morgan Kaufmann Publishers. [5] Christos Emmanouilidis, ‘Evolutionary multiobjective feature selection and roc analysis with application to industrial machinery fault diagnosis’, in Evolutionary Methods for Design Optimisation and Control, eds., K. Giannakoglou, D. Tsahalis, J. Periaux, K. Papailiou, and T. Fogarty, Athens, Greece, (2001). [6] Christos Emmanouilidis and Andrew Hunter, ‘A comparison of crossover operators in neural network feature selection with multiobjective evolutionary algorithms’, in Proc. of the GECCO-2000 Workshop on Evolutionary Computation in the Development of Artificial Neural Networks, pp. 58–60, Las Vegas, Nevada, USA, (2000). [7] Christos Emmanouilidis, Andrew Hunter, and John MacIntyre, ‘A multiobjective evolutionary setting for feature selection and a commonality-based crossover operator’, in Proc. of the 2000 Congress on Evolutionary Computation, pp. 309–316, Piscataway, NJ, (2000). IEEE Service Center. [8] C. Fonseca and P. Fleming, ‘An overview of evolutionary algorithms in multiobjective optimization’, Evolutionary Computation, 3(1), 1–16, (1995). [9] Jeffrey Horn and Nicholas Nafpliotis, ‘Multiobjective optimization using the niched pareto genetic algorithm’, Technical Report IllIGAL 93005, University of Illinois, Urbana, IL, (1993). [10] J.R. Koza, Genetic Programming, MIT Press, Cambridge, MA., 1992. [11] William H. Press, Brian P. Flannery, Saul A. Teukolsky, and William T. Vetterling, Numerical Recipes: The Art of Scientific Computing, Cambridge University Press, Cambridge, UK, 1986. [12] Katya Rodr´ıguez-V´azquez, Carlos M. Fonseca, and Peter J. Fleming, ‘Multiobjective Genetic Programming : A Nonlinear System Identification Application’, in Late Breaking Papers at the Genetic Programming 1997 Conference, ed., John R. Koza, pp. 207–212, Stanford University, California, (1997). Stanford Bookstore. [13] M. Zweig and G. Cambell, ‘ROC plots: A fundamental evaluation tool in clinical medicine’, Clinical Chemistry, 39(4), 551–577, (1993).