BMC Bioinformatics
BioMed Central
Open Access
Research article
Using neural networks and evolutionary information in decoy discrimination for protein tertiary structure prediction Ching-Wai Tan and David T Jones* Address: Department of Computer Science, University College London, London, UK Email: Ching-Wai Tan -
[email protected]; David T Jones* -
[email protected] * Corresponding author
Published: 11 February 2008 BMC Bioinformatics 2008, 9:94
doi:10.1186/1471-2105-9-94
Received: 1 September 2007 Accepted: 11 February 2008
This article is available from: http://www.biomedcentral.com/1471-2105/9/94 © 2008 Tan and Jones; licensee BioMed Central Ltd. This is an Open Access article distributed under the terms of the Creative Commons Attribution License (http://creativecommons.org/licenses/by/2.0), which permits unrestricted use, distribution, and reproduction in any medium, provided the original work is properly cited.
Abstract Background: We present a novel method of protein fold decoy discrimination using machine learning, more specifically using neural networks. Here, decoy discrimination is represented as a machine learning problem, where neural networks are used to learn the native-like features of protein structures using a set of positive and negative training examples. A set of native protein structures provides the positive training examples, while negative training examples are simulated decoy structures obtained by reversing the sequences of native structures. Various features are extracted from the training dataset of positive and negative examples and used as inputs to the neural networks. Results: Results have shown that the best performing neural network is the one that uses input information comprising of PSI-BLAST [1] profiles of residue pairs, pairwise distance and the relative solvent accessibilities of the residues. This neural network is the best among all methods tested in discriminating the native structure from a set of decoys for all decoy datasets tested. Conclusion: This method is demonstrated to be viable, and furthermore evolutionary information is successfully used in the neural networks to improve decoy discrimination.
Background In recent years, a rise in the number of genome sequencing projects around the world has led to an increase in the number of protein sequences with unknown structures. Protein structure prediction aims to bridge the gap between the number of such sequences and the number of sequences with experimentally determined structures. One advantage of computational protein structure prediction is that accurate in silico protein modelling can help guide the more expensive experimental efforts in protein structure determination. Ultimately, the goal is to understand protein function through its 3D structure and sequence and to further increase our biological insights of
the behaviour and interactions of these macromolecules in ways that would be beneficial to mankind. Since 1994, the CASP experiments [2] have provided a useful platform for structure prediction groups to apply their methods to a common set of target sequences, thereby providing the means of direct comparison between these methods. If a target sequence has templates in the structure databases, comparative modelling and fold recognition methods are used to select the templates. In the event of a sequence having an unknown fold, in the case of the Template Free category, fragment assembly methods such as FRAGFOLD [3] and Rosetta [4] are used to build plausible models. Typically, large numbers of Page 1 of 23 (page number not for citation purposes)
BMC Bioinformatics 2008, 9:94
candidate models, also known as decoys, are built in order to sample as large a 3D conformational space as possible. The subsequent challenge is to select the lowest RMSD structure among these decoys to represent as the prediction. This is referred to as the decoy discrimination problem. Common approaches to decoy discrimination include the use of statistical potentials [5,6], structural clustering of decoy structures [7,8], as well as the application of Model Quality Assessment Programs (MQAPs) such as MODCHECK [9] and Victor/FRST [10]. In this work, we present a novel method of decoy discrimination using machine learning, more specifically using neural networks. Decoy discrimination is represented as a machine learning problem, where neural networks are used to learn the native-like features of protein structures using a set of positive and negative training examples. A set of native protein structures forms the positive training examples, while a set of simulated decoy structures makes up the negative training examples. Various features are extracted from the training dataset of positive and negative examples and used as inputs to the neural networks. For the purpose of providing negative training examples, the method of generating a decoy structure (as a negative example) by retaining the physical structure and changing only the sequence ensures that we are using good structural features, as opposed to having overly compact generated structures with steric clashes or non-compact generated structures with obvious non-protein like features. Each of these generated structures with reversed sequences retains native-like structural features, such as native shape and packing density but sequence-related features such as the distributions of pairwise distances of particular residue pairs would be different. For example, the distribution of Alanine-Alanine pairs in native structures 6 residues apart would have a peak at about 11Å typical of helices, but no such peak exists in the distribution in generated structures with reversed sequences. It is hoped that neural network training can be used to capture the differences in these distributions of pairwise distances among the 400 possible residue pair types, and that the final neural network can be used to judge or discriminate decoys with near-native features from poorer quality decoys. It is also an option to generate near-native decoy structures from native structures and then use the generated structures as negative training examples. In this case, structural features such as the pairwise distances would be different, and the distributions of pairwise distances from such decoy structures would be dissimilar to those of native structures too. In this paper, we have decided to leave this method for future work, and concentrate solely on the sequence reversal method for the generation of
http://www.biomedcentral.com/1471-2105/9/94
negative training examples, and test this sequence reversal method to see if it is effective in the context of neural networks. The other main alternative would be to use decoy datasets as negative training examples, but that would render the decoy datasets unavailable for testing, and most publicly available decoy sets are very limited e.g. in terms of protein sizes or types. Although machine learning has been used for model quality assessment before [11-13], it has generally used to optimally combine component features such as solvation energy and secondary structure similarity into a single model quality score. In this case we use machine learning to learn features which are the equivalent of basic pairwise and solvation potential terms to discriminate native folds from decoys. The intended advantage of this approach is that a wide range of input features can be directly incorporated into a single scoring function and combined implicitly. For example, close interactions between positively charged and negatively charged amino acid side chains are rare when the side chains are buried. Nevertheless such salt-bridge interactions do occur, and these can be highly discriminatory features when present in the native structure. The rarity of these features, however, makes it hard for traditional statistical pair potential functions to correctly recognize them. If the evolutionary conservation of the charged amino acids is taken into account, then it is straightforward to identify the rare occasions on which a salt-bridge should be considered, as buried salt-bridges are generally seen to be highly conserved across a family of related proteins. In this work we start out by using neural networks to replace standard pair and solvation potentials. This novel paradigm of using neural networks to perform decoy discrimination is then extended to include evolutionary information. The benefits of using PSI-BLAST [1] profiles with neural networks has previously been demonstrated for secondary structure prediction (e.g. in PSIPRED [14]) and here we demonstrate the use of such information for tertiary structure prediction. Dong and co-workers [15] have also tried to use profile information to develop a better mean force potential for discriminating native structures from sets of decoys, but in their case they simply threshold the sequence profile scores to render a binary decision as to whether a residue is conserved or not conserved. In this paper, we demonstrate that by using neural networks to represent the scoring function, evolutionary information can be encoded as continuous input features to improve the decoy discrimination process. Our intention is to demonstrate the promise of using neural networks with evolutionary information to perform effective coarse decoy discrimination as an initial step, and to provide a platform for future higher resolution decoy discrimination. To provide a rigorous test of these neural network
Page 2 of 23 (page number not for citation purposes)
BMC Bioinformatics 2008, 9:94
http://www.biomedcentral.com/1471-2105/9/94
methods, high resolution decoy datasets such as the Baker dataset [16], as well as lower resolution decoy datasets, are used for the comparison of results to that obtained from existing in-house pairwise potential methods [17].
Results A set of 475 protein domains are selected from the SCOP database [18] (see Methods, Dataset of Protein domains for more details) and divided into training, validation and preliminary test datasets, of size 60%, 20% and 20% respectively. The number of protein domains in each dataset and the percentages of secondary structure content are shown in Table 1. The training and validation datasets are used for neural network training. The preliminary test dataset is used as a basic test for the neural networks in their ability to distinguish native structures from random decoys. Random decoys are generated by randomizing the sequence of each structure in the preliminary test dataset. While random decoys provide a basic test, ultimately the neural networks need to be tested on the discrimination of near-native decoys in real decoy datasets. Several decoy datasets are used, and these are shown in Table 2. In the discussion of results, the Baker dataset [16] is discussed in greater detail because it has the highest quality of decoys, compared to other datasets (see Methods, Decoy datasets for testing for more details). Several input features of the training datasets are extracted and used for neural network training (see Methods, Neural network input features for more details). The various types of neural networks and their input features are shown in Table 3 (non-evolutionary features). For example, the NN-dist method trains neural networks that code for residue pair identities and pairwise distances, as well as having one neural network for each sequence separation k. Due to the large size of training data, each discrete value of the sequence separation k has to be represented as one neural network. Such a representation means that the various sequence separations k have to be combined in meaningful ways. In this work, for the sake of comparison with the in-house pairwise potentials method [17] which has proven competitive in recent CASP experiments, 3 methods of combinations of results are Table 1: Number of proteins in the training, validation and preliminary test datasets.
Dataset
Training Validation Preliminary Test
Number of proteins All
α-only
β-only
αβ
285 95 95
58 (20.4%) 18 (19.0%) 22 (23.2%)
59 (20.7%) 25 (26.3%) 17 (17.9%)
168 (58.9%) 52 (54.7%) 56 (58.9%)
Table 2: Decoy datasets used for testing
Decoy Dataset Baker (Tsai) decoy 4state_reduced lattice_ssfit fisa fisa_casp3 lmds lmds_v2 semfold
Number of proteins 22 6 8 4 4 10 10 6
attempted. These are the short-range (S) combination which sums up the average scores from the k = 4 to k = 10 networks; the short-and-medium (SM) combination which sums up the average scores from the k = 4 to k = 22 networks; the short-medium-long (SML) combination which sums up the average scores from the k = 4 to k = 22, as well as k > 22, networks (See Methods, Interpretation of network output for more details). Besides using the in-house pairwise potentials method [17] as a basis for effective comparison, the K Nearest Neighbours method, a basic machine learning method, is also used for comparison to the various types of neural networks. The measures used for evaluating the different methods are the Z-score and the enrichment score [16]. The Z score measures the extent to which a method can select the native structure from among the decoys; the enrichment score [16] is an indication of the degree to which the method succeeds in identifying the lowest RMSD near-native structures. The ability of any two decoy discrimination methods can be compared by looking at the difference in the quality of the top-ranked models produced by each method [9]. Here, 3 structural similarity measures for assessing the quality of a decoy model are used, namely TM-score [19], GDT-TS [20] and MaxSub [21]. The one-tailed Wilcoxon sign-rank test is used to test, at a 5% significance level, the differences between any two methods. The null hypothesis is the zero median of the distribution of differences in a given structural similarity score, e.g. TM-score [19], of the respective top-ranked models. Similarly, apart from looking only at the top-ranked model, the ability of any two methods to effectively rank the decoys from highest to lowest quality are also assessed in the form of the Spearman rank correlation coefficient. Here another one-tailed Wilcoxon sign-rank test is used to test the difference between any two methods in their ability to rank the decoys from highest to lowest quality. The null hypothesis is the zero median of the distribution of differences in Spearman correlation coefficients produced by the two methods.
Page 3 of 23 (page number not for citation purposes)
BMC Bioinformatics 2008, 9:94
http://www.biomedcentral.com/1471-2105/9/94
Table 3: Summary of neural network training paradigms
Name
Input Features
NN-dist NN-solvpair NN-solvpairndist
Residue pair identities, and pairwise distance Residue pair identities, and relative solvent accessibilities Residue pair identities, pairwise distance and relative solvent accessibilities
Results produced from neural networks which use evolutionary features extracted from the training datasets are also discussed. Table 4 shows the various types of neural networks that use evolutionary features. A complete description of each method can be found in the section Methods, Inclusion of evolutionary information. Preliminary test dataset For each of the 95 proteins in the preliminary test dataset in Table 5, 50 random decoy structures are generated by shuffling the sequence in the native structure.
It is important to point out here that the randomization of sequences in native structures is done only to provide sets of 50 random decoys each for the first-level test, while the reversal of sequences is done on native structures in the training dataset to provide the neural networks with a number of native-like negative training examples equal in size and number to the native structures, which are the positive training examples. It is previously mentioned in the case of generated structures of reversed sequences that structural features such as pairwise distances are retained, and sequence-related features such as the distance distributions of pairwise residues have been altered. The same applies to generated structures with randomized sequences, except that the distributions of pairwise distances of such structures would be more different to those of native structures. This is because in the case of generated structures with reversed sequences, information regarding the proximity between certain residues along the sequence is retained. For example, an Alanine pair of 6 residues apart which can be found in a helix in the native structure would still be 6 residues apart in the reversed structure but they may be part of a beta strand or loop. This type of information would be lost in the randomized structures.
No. of networks
Network input size
20 20 20
41 42 43
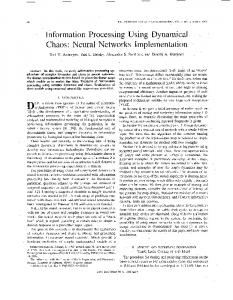
The purpose of preliminary testing is to test the viability of the idea of using neural networks in the current context for decoy discrimination, which includes the paradigm of using structures with reversed sequences as negative training examples, and the separation of native from random decoy structures as a quick first-level test. Using the NNdist method and the S combination of network results, 91 out of 95 native structures are correctly ranked with the highest network scores. This means that for the 95 native structures in the preliminary test dataset and the 50 corresponding random decoys for each native structure, the S combination of the NN-dist method is able to assign the highest network score to the native structure for 91 cases. The average Z score of these 95 proteins is 3.851. The remaining 4 cases have their native structures ranked 2nd, 3rd, 8th and 23rd out of 51 structures (native+50 random structures). Apart from the worst performing native structure, 1vps:A, the native structures of the other 3 cases have comparatively high ranks, even though they do not have the highest rank. The protein domain 1vps:A has 4 other similar domains, and forms part of a beta sandwich architecture, and the poor Z score of its native structure could be due to the fact that 22 generated structures with randomized sequences have, due to pure chance, distributions of pairwise distances similar to that of native distributions. Results of methods with no evolutionary information Results of different combinations of scores Figure 1 shows the different Z scores obtained by the NNdist, NN-solvpair and NN-solvpairndist methods on the Baker dataset [16]. The single k = 4 mean score is compared with the S, SM and SML combinations of network scores.
It can be seen from Figure 1 that there is little difference between the different combinations of network scores for
Table 4: Summary of methods used for inclusion of evolutionary information
Variant Type Homologue Threading Homologue Threading Homologue Threading Sequence Profile Sequence Profile Sequence Profile
Previous network used NN-dist NN-solvpair NN-solvpairndist None None None
No. of input neurons 41 42 43 41 42 43
Name for this variant HT-NN-dist HT-NN-solvpair HT-NN-solvpairndist SP-NN-dist SP-NN-solvpair SP-NN-solvpairndist
Training required No No No Yes Yes Yes
Page 4 of 23 (page number not for citation purposes)
BMC Bioinformatics 2008, 9:94
http://www.biomedcentral.com/1471-2105/9/94
Table 5: Preliminary test dataset of 95 proteins
Preliminary Test Dataset : Protein {:Chain}{:Domain Boundaries} 1eye:A 1fcy:A 1fkm:A:249–442 1g8e:A 1gci 1gk8:A:150–475 1gwu:A 1h8e:A:380–510 1hdh:A 1hxn 1i1q:A 1j98:A 1jbe:A 1jfb:A 1jg1:A 1jhd:A:1–173 1jz7:A:220–333 1k20:A 1k5n:A:182–276 1k92:A:189–444 1kg2:A 1kgs:A:124–225 1ko7:A:1–129 1kr4:A
1ks2:A:127–198 1lm5:A 1lpl:A 1ls1:A:1–88 1m5w:A 1m9x:C 1mmg:34–79 1moq 1mwp:A 1n08:A 1n63:C:178–287 1nox 1nz0:A 1o7j:A 1obd:A 1pin:A:6–39 1qjb:A 1slu:A 1uaq:A 1uca:A 1uxy:201–342 2sic:I 1a9x:A:403–555 1axn
the NN-solvpair method. For the NN-solvpairndist method, the k = 4 single mean score is better than the other combinations. For the NN-dist method, there is
1bm8 1d3v:A 1dk8:A 1dmg:A 1doz:A 1fma:E 1fpo:A:1–76 1g87:A:457–614 1gte:A:2–183 1gxj:A 1h2w:A:1–430 1h7m:A 1hty:A:412–522 1hzt:A 1io0:A 1iv3:A 1iw0:A 1j96:A 1j9j:A 1jf8:A 1jl0:A 1k3w:A:1–124 1k5c:A 1kid
1kjq:A:319–392 1kwn:A 1l0i:A 1l3l:A:2–169 1luc:A 1lyv:A 1m22:A 1m4j:A 1mky:A:359–439 1mro:A:270–549 1mzg:A 1o7n:A:155–448 1oac:A:5–90 1osp:O 1qdd:A 1qhd:A:1–148 1vhh 1vps:A 1wer 2bop:A 2nac:A:1–147 3lzt 3seb:122–238
more variability between the different combinations, with the SM and SML combinations yielding negative Z scores. Figure 1 also shows that the NN-solvpairndist method
Figure across Z scores the 1produced different by k =the 4, S, NN-solvpairndist, SM and SML combinations NN-solvpair and NN-dist methods on all the proteins in the Baker decoy dataset Z scores produced by the NN-solvpairndist, NN-solvpair and NN-dist methods on all the proteins in the Baker decoy dataset across the different k = 4, S, SM and SML combinations.
Page 5 of 23 (page number not for citation purposes)
BMC Bioinformatics 2008, 9:94
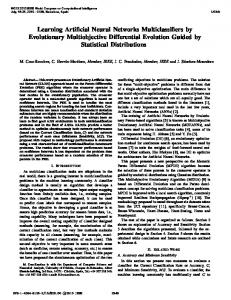
performs better than the other two methods across all different combinations of scores. Due to the fact that the NN-dist method does well for the S combination, and the rest of the methods perform rather consistently across the different combinations, the S combination is used for benchmarking for all decoy datasets in the remaining results presented in this work. Although the k = 4 single mean score yields the highest Z score for the NN-solvpairndist and NN-dist methods on the Baker dataset [16], it is poorer than the S combination in most of the other decoy datasets (data not shown). Results on Baker dataset Because the Baker dataset [16] has 22 proteins, it is possible to see how the various methods, including the pairwise potentials [17] and the K Nearest Neighbours method, perform on different secondary structural classes of proteins. Figure 2 shows the Z scores produced by the S combination of the various neural network and K Nearest Neighbours methods on the different secondary structural classes of proteins in the Baker dataset [16].
It can be seen from Figure 2 that for the S combination, the NN-solvpairndist and NN-solvpair methods do not perform well for α-only proteins in the Baker decoy dataset [16], compared to the rest of the methods. The reverse is true for αβ proteins where the NN-solvpairndist and NN-solvpair methods have higher Z scores than the NN-
http://www.biomedcentral.com/1471-2105/9/94
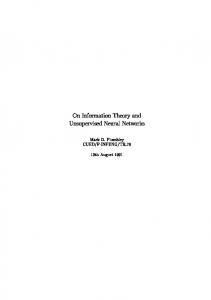
dist method and the K Nearest Neighbours methods. In all cases, the pairwise potentials method [17] has the highest Z score and it is interesting to note that the NN-solvpairndist method has a Z score which is only marginally lower than that of the pairwise potentials method [17] for αβ proteins. The NN-dist method and the K Nearest Neighbours methods (K = 10, 100) perform well for α-only and β-only proteins, but has low Z scores for αβ proteins. The K = 10 method performs slightly better than the K = 100 method for all classes. On average, across all proteins, the pairwise potentials method [17] has the highest Z score. The NN-solvpairndist method performs slightly better than the NN-dist method, while the K Nearest Neighbours method (K = 10) has an overall Z score which is slightly higher than the NN-solvpairndist method. Results on all datasets Figure 3 shows the Z scores obtained on all decoy datasets with the NN methods (with no evolutionary information), the pairwise potentials method [17] and the K Nearest Neighbours methods. For the combination of all datasets, the pairwise potentials method [17] has the highest Z score, while the NN-solvpairndist method has the second highest Z score.
Z methods Figure dataset scores2(K produced = 10, K by = 100) the Sand combination the pairwise of potentials the NN-solvpairndist, method on the NN-solvpair, different secondary NN-dist methods, structuralthe classes K Nearest of the Baker Neighbours decoy Z scores produced by the S combination of the NN-solvpairndist, NN-solvpair, NN-dist methods, the K Nearest Neighbours methods (K = 10, K = 100) and the pairwise potentials method on the different secondary structural classes of the Baker decoy dataset.
Page 6 of 23 (page number not for citation purposes)
BMC Bioinformatics 2008, 9:94
http://www.biomedcentral.com/1471-2105/9/94
Figure Z nation methods scores of3(K produced all the = 10, individual Kby = 100) the datasets S and combination the pairwise of the potentials NN-solvpairndist, method onNN-solvpair, the different NN-dist individualmethods, decoy datasets, the K Nearest includingNeighbours the combiZ scores produced by the S combination of the NN-solvpairndist, NN-solvpair, NN-dist methods, the K Nearest Neighbours methods (K = 10, K = 100) and the pairwise potentials method on the different individual decoy datasets, including the combination of all the individual datasets.
In general, although the pairwise potentials method [17] has the highest overall Z score, it does not have the highest Z score for each individual dataset. For the fisa [4], lmds [22] and semfold [23] datasets, the NN-solvpairndist method has the highest Z score instead. The NNsolvpairndist method also has the second highest Z score after the pairwise potentials method [17] in the 4state_reduced [24], lattice_ssfit [25] and fisa_casp3 [4] datasets. This suggests that the NN-solvpairndist method shows some promise in matching the performance of the pairwise potentials method [17], if it can be further augmented with additional information. In all but one case (lmds_v2 [22]), the NN-solvpairndist method has a higher Z score than the NN-dist method. For all but 2 decoy datasets (Baker [16] and lmds_v2 [22]), the 2 K-NN methods have lower Z scores than the NN-solvpairndist method, although they are comparable to the NN-dist method in terms of Z score. The NNsolvpair method also performs better than the NN-dist method in all but two cases, namely the Baker decoy dataset [16] and lmds_v2 [22]. The NN-solvpairndist method always has higher Z scores than the NN-solvpair method, which suggests that the additional distance information of the NN-solvpairndist method contributes to the discrimination of native structures.
Figure 4 shows the enrichment scores [16] of the S combination across all decoy datasets for the different methods. For the combined datasets, the pairwise potentials method [17] has the highest enrichment score [16], while the NN-solvpairndist method is comparable to the rest of the other methods. For most of the decoy datasets, there is no clear outstanding method which produces a distinctly high enrichment score [16], apart from the pairwise potentials method [17] in the Baker [16], 4state_reduced [24] and fisa_casp3 [4] datasets. It also seems that there is no significant improvement of the enrichment score [16] for the NN-solvpairndist method over the NN-dist method. Results of methods using evolutionary information In this section, the results of the sequence profile methods and homologue threading methods are presented. Because the semfold [23] dataset has about 11000 decoys per protein, and there is a lack of computational resources during the application of the homologue threading methods for the threading of such a large number of decoy structures, the semfold [23] dataset is left out in this section. The K Nearest Neighbours methods are also left out to increase the clarity of the graphs.
Page 7 of 23 (page number not for citation purposes)
BMC Bioinformatics 2008, 9:94
http://www.biomedcentral.com/1471-2105/9/94
sets, K Enrichment Figure Nearest including 4 Neighbours scores the combination (15%methods × 15%)ofproduced (Kall=the 10,individual Kby = the 100)Sdatasets and combination the pairwise of the potentials NN-solvpairndist, method onNN-solvpair, the different NN-dist individualmethods, decoy datathe Enrichment scores (15% × 15%) produced by the S combination of the NN-solvpairndist, NN-solvpair, NN-dist methods, the K Nearest Neighbours methods (K = 10, K = 100) and the pairwise potentials method on the different individual decoy datasets, including the combination of all the individual datasets.
Figure 5 shows the Z scores produced by the S combination of the sequence profile (SP) methods, the homologue threading (HT) methods, the basic NN-solvpairndist, NNsolvpair and NN-dist methods, as well as the pairwise potentials method [17], on the different secondary structural classes of proteins from the Baker dataset [16]. It can be seen that the SP-NN-solvpairndist and SP-NN-solvpair methods experience a significant increase in Z score over their non-evolutionary counterparts. For the α-only proteins, the pairwise potentials method [17] is still the best, but overall, the SP-NN-solvpairndist method has the highest Z score.
tials method [17] is the best for the fisa_casp3 [4] dataset, but the SP-NN-solvpairndist and SP-NN-solvpair methods clearly outperform it, as shown in Figure 6. Among these two methods, the SP-NN-solvpairndist method has a slightly higher Z score than the SP-NN-solvpair method in all datasets.
It can also be observed that the homologue threading methods has higher Z scores than the non evolutionary counterparts across all classes, except β-only, of proteins. This suggests that there is a small but noticeable reduction in noise in the discrimination of native structures when the averaging of network output scores of sequence homologues is used.
In Figure 6, for the HT-NN-dist, HT-NN-solvpair and HTNN-solvpairndist methods, apart from the 4state_reduced [24] dataset, it can be seen that the averaging of sequence homologues do yield a slight increase of Z score for each HT-NN method over its corresponding basic NN counterpart method. This suggests that a modest increase in the performance of the discrimination of native structures can be achieved using averaging the scores of sequence homologues that are threaded to each structure in the decoy dataset. Table 6 shows the number of homologous sequences produced by PSI-BLAST [1] for the native proteins in the various decoy datasets.
Figure 6 shows the key result of this paper, where the SPNN-solvpairndist and SP-NN-solvpair methods clearly outperform all other methods in the discrimination of native structures for all decoy datasets apart from the lattice_ssfit [25] dataset. In Figure 3, the pairwise poten-
In Figure 7, for the SP-NN-solvpairndist method, the performance on the enrichment score [16] for the S combination is less pronounced than that of the Z score. The SPNN-solvpairndist method ranks best in the Baker decoy dataset [16], 4state_reduced [24], and fisa [4] datasets.
Page 8 of 23 (page number not for citation purposes)
BMC Bioinformatics 2008, 9:94
http://www.biomedcentral.com/1471-2105/9/94
Z basic tural Figure scores classes NN-solvpairndist, 5produced of the Baker by the NN-solvpair, decoy S combination dataset NN-dist of themethods, sequenceand profile the pairwise (SP) methods, potentials the homologue method on threading the different (HT) secondary methods,structhe Z scores produced by the S combination of the sequence profile (SP) methods, the homologue threading (HT) methods, the basic NN-solvpairndist, NN-solvpair, NN-dist methods, and the pairwise potentials method on the different secondary structural classes of the Baker decoy dataset.
Z basic datasets, Figure scores NN-solvpairndist, 6including producedthe by combination the NN-solvpair, S combination ofNN-dist all the of the individual methods, sequence datasets and profile the pairwise (SP) methods, potentials the homologue method on threading the different (HT) individual methods, decoy the Z scores produced by the S combination of the sequence profile (SP) methods, the homologue threading (HT) methods, the basic NN-solvpairndist, NN-solvpair, NN-dist methods, and the pairwise potentials method on the different individual decoy datasets, including the combination of all the individual datasets.
Page 9 of 23 (page number not for citation purposes)
BMC Bioinformatics 2008, 9:94
http://www.biomedcentral.com/1471-2105/9/94
Figure ferent ing Enrichment (HT) individual 7methods, scores decoy the (15% basic datasets, × 15%) NN-solvpairndist, including producedthe by combination the NN-solvpair, S combination ofNN-dist all the of the individual methods, sequence datasets and profile the pairwise (SP) methods, potentials the method homologue on the threaddifEnrichment scores (15% × 15%) produced by the S combination of the sequence profile (SP) methods, the homologue threading (HT) methods, the basic NN-solvpairndist, NN-solvpair, NN-dist methods, and the pairwise potentials method on the different individual decoy datasets, including the combination of all the individual datasets.
For the enrichment score [16], the HT-NN methods show little improvement over the basic counterpart methods. All the 3 homologue threading methods show improvements over the basic NN methods in only 3 datasets, namely the Baker dataset [16], 4state_reduced [24] and the lattice_ssfit [25] datasets. One conclusion that can be drawn is that the SP-NNsolvpairndist method, which uses profile information in conjunction with pairwise distance and relative solvent accessibility information of residue pairs, has the best performance in terms of the discrimination of native structures for all decoy datasets (Z score) among the various neural network methods and the pairwise potentials method [17]. In terms of selecting the low RMSD decoys
(enrichment score [16]), it slightly outperforms the rest of the methods for a number of decoy datasets. Results of statistical tests This section discusses the results of two statistical tests, the first of which evaluates the difference between two decoy discrimination methods in the ability to select the top ranked model of highest quality. The assessment of the quality of the top ranked model itself is done using different structural similarity measures, namely TM-score [19], GDT-TS [20] and MaxSub [21]. The one-tailed Wilcoxon sign-rank test is used here to test, at a 5% significance level, the null hypothesis of zero median in the distribution of differences in structural similarity scores of the
Table 6: Number of homologues for the proteins in the decoy datasets for the homologue threading methods
Decoy Dataset
Baker 4state_reduced lattice_ssfit fisa fisa_casp3 lmds lmds_v2
Number of proteins Total
with no homologues
with > = 10 homologues
With