Available online at www.sciencedirect.com
Procedia - Procedia Social and Behavioral Sciences 32 (2012) 148000–000 – 152 - Social and Behavioral Sciences 00 (2010)
Procedia Social and Behavioral Sciences
www.elsevier.com/locate/procedia
4th International Conference of Cognitive Science (ICCS 2011)
Using non-linear features of EEG for ADHD/normal participants’ classification Farnaz Ghassemia,∗, Mohammad HassanMoradib, Mehdi Tehrani-Doosta,c, Vahid Abootalebid b
a Institute for Cognitive Science Studies (ICSS), Tehran, Iran Department of Biomedical Engineering, Amirkabir University of Technology, Tehran, Iran c Department of Psychiatry, Tehran University of Medical Science, Tehran, Iran d Department of Electrical and Computer Engineering, Yazd University, Yazd, Iran
Abstract This study investigates the non-linear features of electroencephalogram signals regarding ADHD and normal adult participants while performing Continuous Performance Test. Three non-linear features were extracted from the EEG signals. ADHD and age-matched normal groups were investigated separately which revealed that there is a significant relation between clinical presentation of the participants and some non-linear features. The accuracy of 88% and 96% were achieved in classification of clinical and non-clinical participants using one and two features respectively. The best classification result was obtained with a combination of two features in Wavelet-Entropy group.
© 2011Published Published by Elsevier Ltd. Selection and/or peer-review under responsibility of the 4th International © 2011 by Elsevier Ltd. Conference of Cognitive Science
Keywords: Attention-Deficit Hyperactivity Disorder (ADHD); K-nearest neighbors classifier; Continuous Performance Test (CPT); electroencephalogram; feature extraction; sustained attention
1. Introduction Attention-Deficit Hyperactivity Disorder (ADHD) is characterized as having inattentiveness, hyperactivity, and impulsivity. This disorder was primarily thought to be a problem limited to youth. However researchers have found that ADHD is often a chronic condition which persists into adulthood in 30% - 70% of the patients (Conners, Erhardt, & Sparrow, 1999; Searight, & Hermann, 2010). Although ADHD in children and adolescents is more common in boys, adult ADHD appears to be more equally balanced between men and women (Simon, Czobor, Balint, Mészáros, & Bitter, 2009) and it appears to decrease with age (Searight, & Hermann, 2010)."Sustained Attention" which is one of the main deficits in ADHD, is defined as the ability to maintain a consistent behavioral response during continuous and repetitive processing of stimuli whose non-arousing qualities would otherwise lead to habituation and distraction to other stimuli (Kandel, Schwartz, & Jessell, 2000; Robertson, Manly, Andrade, Badeley, & Yiend, 1997). Another recent study (Lenz, Krauel, Flechtner, Schadow, & Hinrichs, 2010) suggests that deficits of selective and sustained attention could cause impaired early automatic stimulus classification in ADHD patients. Electroencephalography is among the most informative and dynamic means for noninvasively monitoring the brain functions. Therefore evaluation of EEG is considered in clinical neuroscience studies such as schizophrenia (Todd et al., 2008), dementia (Golob, Irimajiri, & Starr, 2007) and Attention-Deficit Hyperactivity Disorder (ADHD) (Conners et al., 1999; Searight, & Hermann, 2010; Arns, Ridder, Strehl, Breteler, & Coenen, 2009; Barry, Clarke, McCarthy, Selikowitz, & Brown, 2006). A recent research (Williams et al., 2010) suggests that brain-based cognitive measures can support clinical decisions in ADHD and improve sensitivity and specificity of the decisions.
* Corresponding author. Tel.: +98-0912-3260661; Fax: +98-21-66420672 E-mail address:
[email protected]
1877-0428 © 2011 Published by Elsevier Ltd. Selection and/or peer-review under responsibility of the 4th International Conference of Cognitive Science doi:10.1016/j.sbspro.2012.01.024
Farnaz Ghassemi et al. / Procedia - Social and Behavioral Sciences 32 (2012) 148 – 152 Farnaz Ghassemi/ Procedia – Social and Behavioral Sciences 00 (2011) 000–000
While a variety of studies have been done on EEG signals in ADHD children, a few researches have investigated ADHD in adults. A recent published study has examined the role of frontal and parietal cortices in the control of bottom-up and top-down attention in fourteen normal adults (Li, Gratton, Yao, & Knight, 2010). They have used the event related potentials (ERPs) and time-frequency analysis together to compare pop-out and search conditions. Their results provide evidence that the control of bottom-up and top-down attention depend on differential contributions from parietal and frontal cortices. Another study on linear and nonlinear analysis of EEG during a cognitive task suggests that non-linear measures of EEG are useful for investigating neural dysfunctions in adolescents with ADHD (Sohn et al., 2011). This study revealed that the mean of approximate entropy of the ADHD patients was significantly lower than the healthy subjects over the right frontal regions (Fp2 and F8) during the performance of the cognitive task, but not at rest. The spectral analysis showed significant differences between the two groups in the P3 and T4 regions at rest and the Fp2 and F8 regions during task performance. The approach we have pursued in a previous study was to compare the effects of correct and wrong answers on ERP in ADHD and age-matched normal participants (Ghassemi, Moradi, Tehrani-doost, & Abootalebi, 2010). In other studies we classified a population of clinical ADHD and normal adults to three levels of attention. A promising accuracy (above 80%) was acquired encouraging to develop the number of classes for further studies (Ghassemi, Moradi, Tehrani-doost, & Abootalebi, 2009a, 2009b). This study will examine the EEG signals in ADHD and normal adults during a CPT. It also investigates the relation between the participant’s clinical presentation and non-linear features of EEG which are used to classify ADHD/normal participants. 2. Experimental Procedure Signals which were recorded from 50 volunteers (26 men) have been used in the processing. Informed consent was obtained from each participant after explaining the protocol. The experiment was conducted in accordance with the Declaration of Helsinki. Also the review board of Institute for Cognitive Science Studies (ICSS) revised and approved the experimental protocol. The mean age of the participants was 29.78 ± 6.15 years. All participants were examined for handedness using the Edinburgh test and only right-handed participants (50 persons) were considered. They had normal or corrected to normal vision and were checked for color-blindness by the Ishihara test which revealed that two participants were color-blind. According to the interview by a psychiatrist, ten participants (29.8 ± 6.4 years, 7 men) had been diagnosed as having attention-deficit hyperactivity disorder based on the Diagnostic and Statistical Manual of Mental Disorders, Fourth edition (DSM-IV) (American Psychiatric Association, 1994). The diagnosis was confirmed using the results of self-report screening form the Conners' Adult ADHD Rating Scale (CAARS-S: SV) (Conners et al., 1999). They were not on any medications. Other participants had no major psychiatric or medical disorders. One of the popular tests for evaluating sustained attention is the Continuous Performance Test (CPT). Second version of Conners’ CPT (Conners & MHS Staff, 2004) was used in this study which is a "No-Go" CPT task. Different letters of English alphabet are presented randomly on the screen and participants are asked to click the left mouse button with the index finger of their dominant hand when any letter except for the target "X" appears. Participants are instructed to respond as fast as they can and as accurate as possible. There are 6 blocks, with 3 sub-blocks each containing 20 trials. Therefore the experiment involved 360 stimuli: 36 X letters (No-Go stimuli) and 324 other letters (Go stimuli). The inter-stimulus intervals (ISIs) are 1, 2 or 4 seconds with a display time of 250 ms. The participants seated on a comfortable chair with a place for relaxing the head. The test was performed in a quiet and dimly lit room. The distance between the participants’ eyes and a 19 inch monitor was 75 ± 5 cm depending on their height. The letters were 7.5 cm high and 7 cm wide which resulted in a 7° visual angle. They appeared white colored on a black background. A short practice test (70 seconds) was performed before conducting the full test to ensure that the participant has fully understood the task. Each test took approximately 14 minutes to be completed. EEG was recorded from 19 Ag/AgCl electrodes placed according to the international 10-20 standard mounted in an electrode cap. Impedance of all electrodes was kept below 5 K. Average of A1 and A2 was used as the reference. A bipolar vertical EOG was recorded. Two additional bipolar channels were used for synchronization of CPT system with EEG signals and recording of the participants’ responses. A 32-channel AC/DC amplifier (Walter Graphtek GmbH, Germany) was used for data recording and Pl-Winsor 3.0 for data acquisition. Amplifier band-pass was 0.05–100 Hz and a 50 Hz notch filter was used for line noise reduction. The sampling rate was 200 Hz. Data were analyzed using the MATLAB 2009a software (MathWorks, USA). A suitable band-pass filter (0.1– 80 Hz) was used to eliminate movement artifacts, and a notch filter at 50 Hz to suppress the remained line noise. Independent Component Analysis (ICA) was performed for canceling EOG artifacts (Delorme, Sejnowski, & Makeig, 2007; Vorobyov & Cichocki, 2002). Combination of Efficient Variant of Fast ICA (EFICA) and Efficient Weights Adjusted SOBI (EWASOBI) was chosen as the ICA method and was performed using ICALAB software (Cichocki et al.). The ICs are identifiable up to a permutation and scaling of the sources (Hyvarinen, Karhunen, & Oja, 2001). EOG components were automatically recognized by calculating the correlation between recorded EOG and all achieved components by ICA. The component with correlation coefficient greater than 0.8 and P-value less than 0.01 was determined as EOG component. This component was eliminated and then all other components were back-projected to their initial space. Artifactual parts of EEG including abnormal values, trend and spectra and also improbable data were automatically rejected using EEGLAB software (Delorme & Makeig, 2004). For epoch extraction, periods of 200 ms before to 1000 ms after stimuli onset were considered. Baseline was calculated by the average of 200 ms prior
149
150
Farnaz Ghassemi et al. / Procedia - Social and Behavioral Sciences 32 (2012) 148 – 152 Farnaz Ghassemi/ Procedia – Social and Behavioral Sciences 00 (2011) 000–000
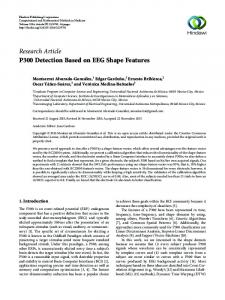
to the stimuli onset and subtracted from the epoch. Artifact-free epochs extracted from each group, were considered as the signals. Four groups of signals were considered for each participant: target stimuli (X), non-target stimuli (nX), correct answers on target stimuli (CX, which is the X that participant did not respond) and wrong answers on target stimuli (WX). Three non-linear features, wavelet entropy, correlation-dimension and Lyapunov exponent, were defined (Abarbanel & Parlitz, 2006; Parlitz, 1998) and evaluated in different signal groups yielding in 12 features (4 signal groups * 3 features) for each channel. These features have shown good performances in similar studies and hence, were believed to be useful as well for this application. The K-Nearest Neighbors (KNN) algorithm is considered as a classifying method for discrimination of classes. KNN is amongst the simplest algorithms for classifying objects which decides based on closest training examples in the feature space. According to Leave One Out (LOO) method, one subject's data was considered as the test data and the classifier was trained based on others, then it was evaluated on the test data. This procedure was repeated for all participants and accuracy is achieved by the ratio of correct classifications to total number of subjects. This test was performed for each feature and then repeated for all combinations of two features. 3. Results The mean hit rate (the mean response time for all non-X responses) in normal and ADHD group was (Mean ± STD) 370.9 ± 33.4 ms and 372.8 ± 48.2 ms, respectively. Average of Omissions (the number of non-targets to which the participant did not respond) in both normal and ADHD groups was 0.4% while average of Commissions (the number of times the participant erroneously responded to the target X) was 30% and 40%, respectively. The mean age of normal group was 29.78 ± 6.1 years which is pretty much close to the ADHD group (29.8 ± 6.4 years). In the Normal group 47.5% of the population was male while in the ADHD group 70% were male. Accuracy of classification on test data was calculated by the ratio of correctly classified participants to the total number of participants. The classification was performed between ADHD and normal groups based on test data to investigate the efficiency and capability of extracted features in this regard. The results are reported in Table 1. The best accuracy with one feature was 88% which was obtained by feature related to the wavelet-entropy of the EEG signal in 2 cases: Wrong answered X signal (WX) at Pz electrode and correct answered X signal (CX) at P4 electrode. The best result for classification with two features was 96% which was obtained by the combination of features related to wavelet-entropy of WX signal at T3 electrode and nX signal at T5 electrode. The best obtained accuracy for each group of non-linear features is shown in figure 1. 4. Discussion Best accuracy of classification in both cases (using 1 or 2 features) was obtained by wavelet-entropy features. The accuracy of 96% was obtained with combination of two features, one was related to the wrong answered X’s at T3 electrode and the other related to the non X’s at T5 electrode. Consequently results represented a significant association between clinical presentation and some parameters of brain signals which can be used in evaluating the level of attention. Results are improved comparing to the previous study (Ghassemi et al., 2009a) where the accuracy of 81% was achieved while investigating some different morphological features on independent components of ERP signals from 19 participants divided to 3 classes of attention. In another study (Ghassemi et al., 2009b) 24 participants were examined where the accuracy of 93%, 88%, and 94% were achieved in classification of each 2 classes which are comparable to the results of this study on different features. It should be mentioned that Robeva (Robeva, Penberthy, Loboschefski, Cox, & Kovatchev, 2004) have reported the accuracy of 100% in a pilot study for differentiating between 6 adult ADHD female college students with normal controls using the combination of psychometric tests with EEG-based physiological markers of ADHD which justifies investigating a greater statistical population considering both male and female participants.
Figure 1. Best obtained accuracy in classification of ADHD/normal participants with different non-linear features
Farnaz Ghassemi et al. / Procedia - Social and Behavioral Sciences 32 (2012) 148 – 152 Farnaz Ghassemi/ Procedia – Social and Behavioral Sciences 00 (2011) 000–000
The significant correlation between the clinical characteristics of the participants and many of the extracted features from EEG signals validates the implementation of proposed method for further studies on the ADHD and sustained attention disorders. 5. Conclusion In this study different features of EEG were evaluated and compared while adult participants performing a continuous performance task. The accuracy of 96% is achieved in discrimination of ADHD and normal participants. This accuracy is obtained on test data using the combination of two nonlinear features and the KNN classifier. Acknowledgment The authors are thankful to the Institute for Cognitive Science Studies (ICSS) for their help with providing the EEG laboratory for performing the tests. They appreciate Dr. Anahita Khorrami and Eng. Amin Mohammadian for their assistance in designing the protocol and conducting the test for some participants. The authors also thank all participants for their contribution in this study. Table 1. Different non-linear features which resulted in the best obtained accuracy in classification of ADHD/normal participants.
No. of Features
1
2
Type
Best Accuracy
Wavelet-Entropy
88%
Correlation Dimension
80%
Lyapunov Exponent
Characteristics of Best Features W W C C
CX WX CX WX
P4 Pz Cz Cz
78%
L
nX1
Fz
Wavelet-Entropy
96%
W
WX
T3
,W
nX
T5
Correlation Dimension
84%
Lyapunov Exponent
82%
C C L L
CX nX CX X
Pz Cz Pz Fz
,C ,C ,L ,L
nX X X CX
Cz Fz Fz Pz
References Abarbanel, H. D. I., & Parlitz, U. (2006). Nonlinear analysis of time series data. In B. Schelter, M. Winterhalder, & J. Timmer (Eds.), Handbook of time series analysis (pp. 5-33). Weinheim: WILEY-VCH Verlag. American Psychiatric Association (1994). Diagnostic and Statistical Manual of Mental Disorders. (4th ed.). Washington, D.C: Author. Arns, M., Ridder, S., Strehl, U., Breteler, M., & Coenen, A. (2009). Efficacy of neurofeedback treatment in ADHD: The effects on inattention, impulsivity and hyperactivity: A meta-analysis. Journal of Clinical EEG and Neuroscience, 40(3), 180-190. Barry, R. J., Clarke, A. R., McCarthy, R., Selikowitz, M., & Brown, C. R. (2006). Event-related potentials in two DSM-IV subtypes of attentiondeficit/hyperactivity disorder: An investigation using a combined modality auditory/visual oddball task. In R. D. Oades (Ed.), Attention-deficit/hyperactivity disorder (AD/HD) and the hyperkinetic syndrome (HKS): Current ideas and ways forward (pp. 229-247). New York: Nova Publishers. Cichocki, A., Amari, S., Siwek, K., Tanaka, T., Phan, A. H., et al. ICALAB Toolboxes. Retrieved July 29, 2011 from http://www.bsp.brain.riken.jp/ICALAB. Conners, C. K., Erhardt, D., & Sparrow, M. A. (1999). Conners' adult ADHD rating scales (CAARS). New York: Multi-Health Systems, Inc. Conners, C. K., & MHS Staff. (2004). Conner's continuous performance test II. Tonawanda: Multi-Health Systems. Delorme, A., Sejnowski, T., & Makeig, S. (2007). Enhanced detection of artifacts in EEG data using higher-order statistics and independent component analysis. NeuroImage, 34, 1443-1449. Delorme, A., & Makeig, S. (2004). EEGLAB: An open source toolbox for analysis of single-trial EEG dynamics. Journal of Neuroscience Methods, 134, 9-21. Ghassemi, F., Moradi, M. H., Tehrani-Doost, M., & Abootalebi, V. (2009a). Classification of sustained attention level based on morphological features of EEG’s independent components. Proceedings of the IEEE/ICME International Conference on Complex Medical Engineering (CME 2009), USA, 1-6. Ghassemi, F., Moradi, M. H., Tehrani-Doost, M., & Abootalebi, V. (2009b). Combination of independent component analysis and feature extraction of ERP for level classification of sustained attention. Proceedings of the 4th International IEEE/EMBS Conference on Neural Engineering (NER), Turkey, 136-139. Ghassemi, F., Moradi, M. H., Tehrani-Doost, M., & Abootalebi, V. (2010). Effects of correct and wrong answers on ERPs recorded under conditions of the Continuous Performance Test in ADHD/normal participants. Neurophysiology, 42, 255-262. Golob, E. J., Irimajiri, R., & Starr, A. (2007). Auditory cortical activity in amnestic mild cognitive impairment: Relationship to subtype and conversion to dementia. Brain, 130, 740–752. Hyvarinen, A., Karhunen, J., & Oja, E. (2001). Independent component analysis: Theory and applications. New York: Wiely. Kandel, E., Schwartz, J., & Jessell, T. (2000). Principles of neural science. New York: McGrow Hill.
151
152
Farnaz Ghassemi et al. / Procedia - Social and Behavioral Sciences 32 (2012) 148 – 152 Farnaz Ghassemi/ Procedia – Social and Behavioral Sciences 00 (2011) 000–000
Lenz, D., Krauel, K., Flechtner, H., Schadow, J., & Hinrichs, H. (2010). Altered evoked gamma-band responses reveal impaired early visual processing in ADHD children. Neuropsychologia, 48, 1985-1993. Li, L., Gratton, C., Yao, D., & Knight, R. T. (2010). Role of frontal and parietal cortices in the control of bottom-up and top-down attention in humans. Brain Research, 1344, 173-184. Parlitz, U. (1998). Nonlinear time-series analysis. In J. A. K. Suykens & J. Vandewalle (Eds.), Nonlinear modeling-advanced black-box techniques (pp. 209239). Boston: Kluwer Academic Publishers. Robertson, I. H., Manly, T., Andrade, J., Badeley, B.T., & Yiend, J. (1997). Oops!: Performance correlates of everyday attentional failures in traumatic brain injured and normal subjects. Neuropsychologia, 35, 747-758. Robeva, R., Penberthy, J. K., Loboschefski, T., Cox D., & Kovatchev, B. (2004). Combined psychophysiological assessment of ADHD: A pilot study of Bayesian probability approach illustrated by appraisal of ADHD in female college students. Applied Psychophysiology and Biofeedback, 29, 1–18. Searight, H. R., & Hermann, R. (2010). Adult attention-deficit hyperactivity disorder. [Electronic Version]. UpToDate. Retrieved January 18, 2010, from http://www.uptodate.com/home/about/index.html. Simon, V., Czobor, P., Balint, S., Mészáros, A., & Bitter, I. (2009). Prevalence and correlates of adult attention-deficit hyperactivity disorder: Meta-analysis. British Journal of Psychiatry, 194, 204-211. Sohn, H., Kim, L., Lee, W., Peterson, B. S., Chae, J. H., Hong, S., et al. (2010). Linear and non-linear EEG analysis of adolescents with attentiondeficit/hyperactivity disorder during a cognitive task. Clinical Neurophysiology, 121, 1863-1870. Todd, J., Michie, P. T., Schall, U., Karayanidis, F., Yabe, H., & Näätänen, R. (2008). Deviant matters: Duration, frequency, and intensity deviants reveal different patterns of mismatch negativity reduction in early and late schizophrenia. Biological Psychiatry, 63, 58–64. Vorobyov, S., & Cichocki, A. (2002). Blind noise reduction for multisensory signals using ICA and subspace filtering, with application to EEG analysis. Biological Cybernethics, 86, 293-303. Williams, L. M., Hermens, D. F., Thein, T., Clark, C. R., Cooper, N. J., Clarke, S. D., et al. (2010). Using brain-based cognitive measures to support clinical decisions in ADHD. Pediatric Neurology, 42, 118-126.