omissions in the FSM eligibility field (Harland and Stillwell, 2007). ..... The Data Access Layer is a Java component that is responsible for the management of .... for those policy makers concerned to ensure service provision meets demand.
(Working Paper 07/03)
Using PLASC data to identify patterns of commuting to school, residential migration and movement between schools in Leeds
Kirk Harland and John Stillwell
Version 1.0 May 2007
School of Geography, University of Leeds, Leeds, LS2 9JT, United Kingdom
Paper prepared for the AAG Annual Meeting, San Francisco, 21 April, 2007
This Working Paper is an online publication and may be revised.
Abstract New patterns of interaction emerge annually between the places where schoolchildren live and go to school. This paper concentrates on understanding the dynamics of the ‘journey to learn’. It explains how PLASC data for Leeds, a city in northern England, can be used to measure daily pupil movements and to investigate school territories, but also to identify pupil movements between schools and between places of usual residence. The longitudinal nature of the data provides the opportunity for checking the authenticity of individual record attributes from one year to another and for making adjustments to improve consistency. Consideration is given to how these flows might be modelled in order to support the local authority (Education Leeds) make better decisions when planning the provision of primary and secondary schools across the district in future years.
Acknowledgements This paper has been produced as part of an ESRC CASE postgraduate studentship funded by the ESRC and Education Leeds and we acknowledge this financial support. We are also grateful to Education Leeds for the supply of PLASC and other datasets, and to Heather Eyre in particular, for her continued advice and support.
i
Contents Contents .................................................................................................................... ii 1.
Introduction ....................................................................................................... 1
2.
Context.............................................................................................................. 2
3.
PLASC data characteristics, errors and omissions .............................................. 5
4.
School rolls and commuting distances ............................................................. 10
5.
4.1.
Pupil distributions .................................................................................... 10
4.2.
School intake types and governance ......................................................... 13
4.3.
School rolls and territories ....................................................................... 16
4.4.
Pupil commuting distances by ethnicity ................................................... 21
Pupil mobility and residential migration .......................................................... 23 5.1.
Gender ..................................................................................................... 24
5.2.
FSM eligibility......................................................................................... 25
5.3.
National Curriculum year group............................................................... 26
6.
Modelling framework ...................................................................................... 28
7.
Conclusions ..................................................................................................... 32
ii
1. Introduction A key objective in planning education provision is to ensure that the number of school places is commensurate with the number of children requiring education at different levels. This objective has become increasingly difficult to achieve in Britain due to changing demographic, behavioural and legislative factors. Reductions in fertility mean smaller cohorts of children reaching different stages in the education system at different times; household migration creates new patterns of demand for school places; parental attitudes to school selection have changed as school league tables have been published; new legislation on parental choice of school has accentuated the focus on achievement; and variation in school admissions policies or Government policy on admissions has created constraints on the education market. Although the education market has become more open following the Education Reform Act in 1998, in principle allowing parents to choose the school they wish their sons and daughters to attend, it can be argued that admissions policies and parental behaviour have led to a more selective or segregated system.
Given the complicated nature of the market and the importance increasingly attached to the journey to school, the project to which this paper relates has two main aims that are as follows:
to understand the patterns of pupil mobility associated with the journey to school, the behavioural factors that underpin those patterns, and the process of school selection by parents; and
to develop and implement techniques for modelling the commute to school so as to enhance the predictive capabilities for education planners to use in a strategic planning context.
The aims of this paper are rather more modest. Initially we include a short discussion of the British context for research on the activity of commuting to school. In Section 3, we introduce the way in which a relatively new administrative data set, the Pupil Level Annual School Census (PLASC), can be used as an important source of information on the commuting of individual state school pupils in Leeds at a time when data from the 2001 Census Special Travel Statistics (STS) only provide data on children travelling to study within Scotland. The annual cross-sectional PLASC data 1
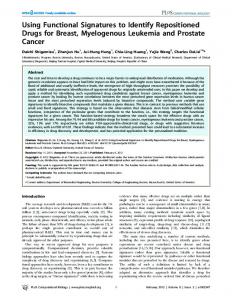
contain a unique identifier for each pupil that can be linked from one year to the next, allowing the data to become longitudinal and thus providing the opportunity for attributes of individuals, such as age, sex, ethnicity and home location to be compared from year to year and for errors and omissions to be rectified where possible. Some selected analyses of the PLASC data for Leeds are presented in Sections 4 and 5 of the paper: we choose to examine spatial variation in the rolls and territories of primary and secondary schools since this is a key focus of geographical interest; we identify how territories vary in size by ethnic group since the ethnic dimension of education is increasingly important in a multicultural city like Leeds; and we explore the propensity of pupils to move between schools and/or between homes since this is an area that has received scant attention by researchers hitherto. Thereafter, in Section 6, we propose a framework for a planning support system that incorporates the tools required for the analysis and visualisation discussed previously but also for modelling these interaction flows using either spatial interaction modelling or agent-based modelling techniques. Finally, some conclusions are drawn in Section 7. 2. Context Four important points are made here by way of context and the geographical area that we are using for the research is introduced. Firstly, 2004-based national demographic projections by the Government Actuary’s Department (GAD, 2005) show that the current decline in primary school numbers is set to continue in the short term but begins to recover from 2009 onwards, whereas the trend for secondary school age pupil numbers is one of marked decline until 2015 as the smaller cohorts in primary schools enter and make their way through the secondary school system. Figure 1 shows the individual age projections aggregated to match those of primary and secondary schoolchildren of compulsory school age (5-16).
Local authorities are therefore facing fluctuating demographic trends that are resulting in an increasing surplus of school places in the current provision and have strategic implications for school closure and merger. This is contrary to past trends in which there has been an expanding pupil population and where analysis and prediction methods have been designed to deal with increasing numbers and a shortage of places for schoolchildren.
2
Population Projections by School Phase 3,900
Population (000's)
3,700 3,500 3,300 3,100 2,900 Primary Secondary
2,700
2028
2026
2024
2022
2020
2018
2016
2014
2012
2010
2008
2006
2004
2,500
Year
Source : GAD (2005) Figure 1. National population projections in primary and secondary age ranges, 2004-29 Secondly, the policy context was changed radically by the 1988 Education Reform Act with the introduction of an ‘open market’ allowing parents the right to choose which school their child attends, so long as the school provides education that meets the requirement of the pupil and that the school has space to admit the child. Local authorities are inspected by OFSTED to evaluate the number of surplus school places brought about by these demographic trends. The Audit Commission has recommended a target of 10% surplus school places for each school although targets may be higher or lower than this so long as they can be justified and are reasonable. There is currently a very lively debate about school and local authority admissions policies which vary significantly across the country.
Most recently, central
government ministers have proposed the introduction of school admissions by lottery and the use of cheap US-style school bus transport to ‘open up’ popular schools for those from less affluent parts of cities. Furthermore, the focus on attempting to target funding has been underway for some time: i.e. understanding where pupils will want to attend school in order to prevent schools falling into the ‘failing’ category by effectively targeting funding into schools and areas where it is required.
3
The Government’s preoccupation with admissions policies is driven by the impacts of the current system which are seen as negative. Current school admissions systems tend to be very selective with children from poorer families not getting access to better schools and thus not going on to further or higher education. The result of this is more social and ethnic segregation in the education system, the focus for research studies by Gorad and Fitz (2000), Johnston et al. (2005) and, most recently, by Johnston et al. (2006). There is anecdotal evidence from estate agents of parents buying houses in areas in close proximity to good schools; in fact it is estimated that the premium on the price of a house in the territory of a perceived good school is an average of approximately £42,000 (The Daily Telegraph, 3 March 2007).
Thirdly, a major impact of the school run is the significant increase in the levels of traffic congestion that are noticeably worse during school term times. Most cities have traffic problems of this nature and this research project is aimed at understanding the flows of pupils in the metropolitan district of Leeds (Figure 2) in the north of England, a city of over 715,000 inhabitants in 2001 and suffering from major problems of traffic congestion due in part to insufficient public transport provision.
Figure 2. Location of Leeds Metropolitan District in Yorkshire and the Humber 4
Fourthly, it is also pertinent to recognise, by way of context, the importance that the current Government attaches to evidence and to ‘evidence-based policy making’. This means that information is required that can be derived from the analysis of reliable data about the demand for and supply of education. In the United States of America, the National Center for Education Statistics (NCES) collects and collates a multitude of surveys and longitudinal data for education at elementary, secondary and postsecondary levels, including fiscal and non-fiscal data at pupil, school and state level. In England and Wales, the Department for Education and Skills (DfES) collates education data into a central database called the National Pupil Database (NPD). In fact, the PLASC datasets described in Sections 3 and 4 of the paper are those data supplied to Department for Education and Skills (DfES) by the Leeds Local Authority, Education Leeds, and the next section of the paper aims to summarize the nature and content of the Leeds PLASC data and to demonstrate how essential it is to check and clean the data prior to their analysis. 3. PLASC data characteristics, errors and omissions The National Pupil Database (NPD) is a relatively new dataset created in 2002 and contains individual pupil records for all state educated school children (Ewens, 2005). It is updated on an annual basis with additions in excess of 8 million individual pupil records collected by each Local Authority (LA) in England and Wales and is maintained by the DfES (Jones and Elias, 2006). Access to the NPD has recently been provided through a central gateway funded jointly by the DfES and the ESRC and managed by the Centre for Market and Public Organisation at the University of Bristol where the PLASC/NPD User Group (PLUG) is based (Burgess et al., 2006). The NPD is stored in a relational database with several different datasets capable of being linked together using either a Unique Pupil Number (UPN) or a unique establishment identification number to allow for both temporal and cross-sectional analysis, creating a powerful information resource for policy formulation (Jones and Elias, 2006).
Completion of the Pupil Level Annual School Census (PLASC) is statutory for all state maintained primary, secondary and special schools under section 537A of the Education Act 1996 (Jones and Elias, 2006). The DfES began collection of the data in 5
2002 and the dataset now forms the cornerstone of the NPD. Individual schools are required to submit a PLASC return to the LA on the third Thursday of January each year. The return consists of entries for every pupil on role with data such as home postcode, ethnicity, Special Education Need (SEN) status and Free School Meal (FSM) eligibility, plus information relating to the school and its staff.
In actual fact, the data collection of pupil information is no longer referred to as PLASC because a tri-annual data collection procedure called the School Census with a modular structure was introduced in 2006 for secondary schools and will be introduced in 2007 for primary schools (DfES, 2006a). One of the three data collections will still be carried out in January, with two further collections on the third Thursday in May and the third Thursday in September augmenting the January collection (DfES, 2006b). The tri-annual data collections coincide with the three school terms and will enable more effective tracking of pupil migrations, moves between homes and moves between schools, throughout the year.
Although the PLASC does not contain any information relating to pupil attainment, there are additional tables in the NPD which store this information and can be seen in Figure 3 which also shows how tables are represented at three different levels. At the school level, only one table exists and this holds data relating to individual schools such as school capacity, number of computers and number of staff by qualification. At the pupil level, six tables exist, each holding data for pupils at the different stages of their school careers. The ‘Pupils’ table is a master table holding information on every pupil appearing in the NPD. This differs from the ‘PLASC’ table because not every pupil in the NPD attends a state school and is therefore not subject to the statutory pupil census. For further information on the NPD and PLASC data collection, refer to Harland and Stillwell (2007).
6
Source: adapted from Jones and Elias (2006, p.7) Figure 3. National Pupil Database tables overview, December 2006
The LA for the Leeds study area, Education Leeds, supplied PLASC data for the years 2000/01 through to 2005/06. It must be noted that the collection in the academic year 2000/01 was a test run for the data collection procedure to be implemented in the following years when collections became statutory.
The PLASC data were
augmented with X, Y coordinates for each pupil geocoded by Education Leeds using the Ordnance Survey Address-Point database although problems with these fields are highlighted in Harland and Stillwell (2007) where methods for rectification are described and implemented.
The number of pupils in the Leeds study area can be seen in Table 1. The ‘all pupils’ row contains all the data collected in each year. This includes pupils in nursery years and pupils studying for A Level qualifications. However, this study is concerned with pupils of compulsory school age as defined by Section 8 of the Education Act 1996. “A person begins to be of compulsory school age when he attains the age of five” and “ a person ceases to be of compulsory school age at the end of the day which is the school leaving date for any calendar year a) if he attains the age of 16 after that day but before the beginning of the school year next following; b) if he attains that age on that day; or c) (unless paragraph (a) applies) if that day is the school leaving date next following his attaining that age” (HMSO, 1996).
7
Therefore the ‘compulsory school age’ row shows the count of pupil records that attend the National Curriculum year groups’ reception through to year 11 and are regarded as being pupils of compulsory school age. Both rows show a consistent decline over the six years.
All pupils Compulsory school age
2001
2002
2003
2004
2005
2006
116,506
115,134
114,090
112,690
111,518
110,332
102,629
102,262
101,336
100,269
99,014
97,802
Table 1. PLASC Pupil numbers for Leeds
On initial inspection of the Leeds PLASC, omissions in the data were apparent, being most prevalent in the 2001 set with 2,484 omissions in the UPN field, 1,336 omissions in the ethnicity field, 2,888 omissions in the first language field and 13,294 omissions in the FSM eligibility field (Harland and Stillwell, 2007).
However,
despite these substantial omissions, it is the location attributes that are of critical importance for this study, since we are primarily concerned with pupil commuting behaviour. The pupil postcode field has fewer omissions with 549 in 2001, 98 in 2002, 89 in 2003, 22 in 2004, 9 in 2005 and 0 in 2006 but even though the field has fewer omissions, not all the postcodes recorded in the data are valid (Harland and Stillwell, 2007). Data interpolation to complete omissions and isolate and correct errors is possible with the PLASC data because it is not only cross-sectional but also longitudinal with the UPNs allowing the tracking of pupils throughout their school careers. The types of errors that can be isolated in the data are: •
missing values where interpolation is possible;
•
missing values where interpolation is not possible;
•
typographic error where detection and interpolation is possible;
•
typographic error where detection or interpolation is not possible;
•
accuracy/precision of geocoding; and
•
serious errors resulting in exclusion from the database.
For a full discussion of the error detection and the implementation of interpolation methods see, Harland and Stillwell (2007).
8
Field
2001
2002
2003
2004
2005
2006
% Missing data interpolated UPN
1.88
0
0
0
0
0
Postcode
0.42
0.02
0.02
0.01
0
0
Coordinates
0.29
0.14
6.68
12.04
5.97
1.04
% Typographic errors interpolated Gender
0.24
0.29
0.10
0.13
0.10
0.03
Year Group
0.97
8.07
7.16
0.26
0.39
0.12
70.31
5.91
1.31
% Geocoding corrections Coordinates
0.86
2.76
75.68
% Errors resulting in exclusion UPN
0.02
0
0
0
0
0
Postcode
0.84
0.28
0.24
0.16
0.21
0.28
Table 2. Percentage of errors and omissions corrected by type
Table 2 shows the omissions and errors corrected by type of error as a percentage of the total number of pupils of compulsory school age. Some percentages for the UPN exclusions are too small to show to two decimal places in years 2002, 2003 and 2004, the actual numbers of exclusions are 2, 1 and 1 respectively. Following the data cleaning process, some serious errors required the exclusion of records from the database, shown in the errors resulting in exclusion section of Table 2. In these cases, the records were removed from all years. Thus, the total database exclusions shown in Table 3 do not match those shown in Table 2, as those in Table 2 are only those records that are in error in that particular year. Table 3 shows the exclusions in each year including the records that are errors in other years but require exclusion throughout the database.
2001 Total pupil records Excluded records % Excluded
102,629
2002
2003
102,262 101,336
2004
2005
2006
100,269
99,014
97,802
1,310
1,124
1,055
946
900
818
1.3
1.1
1.0
0.9
0.9
0.8
Table 3. Total database exclusions
9
Tables 2 and 3 show that the quality of data collection is increasing over the period 2001 through 2006 as the number of errors and omissions that require correction decrease and the number of errors requiring exclusion overall consistently decreases. Although the quality of the data is increasing and the number of exclusions are relatively small and decreasing, it is important to ensure that the exclusions are evenly distributed throughout the database and do not originate from one school skewing any analysis concerning that particular institution in that year.
On examination, the
exclusions are evenly distributed throughout the database and are not expected to cause any significant problems in further analysis (Harland and Stillwell, 2007). 4. School rolls and commuting distances 4.1.
Pupil distributions
Figure 4 shows the changing distributions of pupils attending Leeds schools that live within the Leeds Metropolitan District Area (MDA) or in the districts of the wider Yorkshire and Humber region. The light green area is the central business district for Leeds and the areas to the east and to the south show the greatest decrease in pupil numbers. The south-western border of the Leeds MDA also shows a noticeable decrease in pupil numbers, while at the same time, the surrounding districts that border the Leeds MDA to the south and the west show an increase in the numbers of pupils attending schools in Leeds.
10
Figure 4. Pupil distribution in Leeds and surrounding Yorkshire and Humber districts 11
2001
2002
2003
2004
2005
2006
Within Leeds
98,383
97,913
96,842
95,827
94,652
93,448
Outside Leeds
2,936
3,225
3,439
3,496
3,462
3,536
Table 4. Pupils attending schools in Leeds
Table 4 shows the number of pupils attending schools in Leeds after the serious errors have been excluded from the database. The decline the number of pupils who live in Leeds and who attend school in the Leeds MDA is actually higher at 5% than initially indicated by the figures in Table 1, showing a decline of 4.7%. In fact, there has been an increase of the percentage of pupils attending schools in Leeds who live outside the MDA. This suggests that, as the pupil numbers within Leeds decline, access to schools for pupils from outside the LA area is facilitated because of the requirement to fill surplus school places, although further investigation is required before a definitive reason can be given.
District
2001
2002
2003
2004
2005
2006
Primary Pupils 58,312
57,520
56,290
55,106
54,203
53,358
Bradford
596
627
685
653
692
728
Kirklees
89
116
124
122
122
126
Wakefield
152
167
203
198
193
197
Harrogate
147
156
149
151
146
146
Selby
117
116
107
109
89
85
Total
59,413
58,702
57,558
56,339
55,445
54,640
Leeds
Secondary Pupils 39,434
39,664
39,800
40,017
39,802
39,436
Bradford
923
1,002
1,055
1,103
1,101
1,141
Kirklees
627
708
774
780
776
773
Wakefield
149
168
182
208
172
179
Harrogate
71
70
63
68
68
56
Selby
38
48
45
47
46
45
Total
41,242
41,660
41,919
42,223
41,965
41,630
Leeds
Table 5. Pupil origins from the districts surrounding the Leeds MDA 12
Table 5 shows counts of pupils attending schools in the Leeds MDA from the surrounding districts. Bradford, Kirklees and Wakefield show consistent increases in the number of pupils attending Leeds schools. The increases shown here support the interpretation of Figure 4 as Bradford, Kirklees and Wakefield form the south-western border of the Leeds MDA where the changes in pupil distributions were noticed. 4.2.
School intake types and governance
The intake type of schools in the modern day education system is very much a legacy of how the education system has developed in Britain in the past. Thus, to understand the diversity of school intake types, a brief overview of the development of the education system is required. The development of the education system from 1900 up to the introduction of the 1988 Education Reform Act (ERA) had been fraught with a lack of specific guidance at a national level. The Hadow Report in 1926 called for compulsory schooling up to the age of 15 for children and suggested a comprehensive school system (Armytage, 1970). The Spen Report in 1938 also called for compulsory schooling for children but suggested a school leaving age of 16 and favoured a selective tripartite school system containing grammar, secondary and technical schools (Lawrence, 1992). The onset of the Second World War delayed education reforms until the historic 1944 Education Act that is widely accepted as the Act that “laid the foundation for the modern education system” (Statham et al., 1991 p.42). Although this may be the case, a lack of cohesive legislative guidance at a national level lead to many different education systems being implemented in parallel at a local level for many years, the remnants of which are reflected in the diversity of school types still available in England and Wales.
Comprehensive schools do not select their pupil intake on academic aptitude and are the favoured secondary school system suggested in the Hadow Report of 1926 (Armytage, 1970). These schools are reflected by a code of ‘comp’ in the PLASC data. Up to 1976, the comprehensive school system, the tripartite school system and several systems that fell somewhere between the two all existed in different LAs across England and Wales. The Labour Party's 1976 Education Act brought in legislation to officially end the tripartite school system and selection by ability in state schools (Gordon et al., 1991). However, resistance to the abolition of the tripartite system of schooling in some LAs and changing political views has lead to state run 13
‘grammar’, ‘technical’ and ‘secondary modern’ schools remaining. These are reflected by the codes ‘SEL1’, ‘SEL2’ and ‘SEL3’, although none of these school types exist in the Leeds study area. The code ‘SEL4’ refers to schools that are selective on religious grounds and a number of these schools do exist in Leeds.
Definitions of the governance status of the different types of schools in England are supplied by Teachernet (2007). Schools with a ‘community’ governance type are controlled by the LA and are represented by the code ‘CO’ in the PLASC data. The buildings and land are LA owned, the staff are employed by the LA and the LA decides and implements the school admissions policy. ‘Voluntary aided’ schools are normally church schools, with the land and buildings being owned by a charitable foundation. The governing body contributes to the costs of running the school, employs the staff and has responsibility for the schools admissions policy, these schools are represented by a code of ‘VA’ in the PLASC data.
‘Voluntary controlled’ schools, represented by a code of ‘VC’ in the PLASC data, are similar to voluntary aided schools although the LA employs the staff and has responsibility for the admissions policy of the school. ‘Foundation’ schools were formerly known as ‘grant maintained’ schools. School land and buildings are owned by the governing body or by a charitable foundation in this case. The governing body employs the school staff and has responsibility for the schools admissions policy. Foundation schools are represented by a code of ‘FO’ in the PLASC data. ‘City academies’ and ‘city technology colleges’ are funded through schemes directly from the Government with academies being partially funded through private investment and are represented by the codes ‘CA’ and ‘CT’ respectively. ‘Non-maintained’ schools are not-for-profit charitable schools represented by the code ‘NM’ in the PLASC data and ‘independent’ schools are supported by fee-paying students and are not maintained by state funding and are coded with ‘IN’ in the PLASC data.
Figure 5 shows the distribution of schools by intake type and governance in the Leeds LA. The most common intake type is comprehensive with 217 of the 225 primary schools and 38 of the 40 secondary being comprehensive intake type. The remaining eight primary schools and two secondary schools have an intake type of selective on religious grounds. Community schools, with 159 primary and 33 secondary, dominate 14
the governance types in the Leeds study area. However, in addition to this at the primary stage there one city academy, 53 VA and 12 VC schools. At the secondary stage, there are six voluntary aided and one voluntary controlled school.
Figure 5. Distribution of schools in Leeds by intake type and governance, 2006
15
4.3.
School rolls and territories
Figures 6 shows the mean distance travelled to each primary school in Leeds in each year from 2001 to 2006 and Figure 7 shows the size of school roll for each primary school in Leeds. Examining these figures closely shows that in many cases, as a school roll size decreases over time, the mean distance travelled to school increases possibly suggesting that the pupil population in the immediate vicinity of the school in question is ageing and therefore the school is becoming unsustainable. This pattern of increasing travel distance to decreasing school rolls can be seen in several of the institutions that eventually end up either merging together to form one new school or closing altogether. The spatial pattern of mean distance travelled indicates larger territories in the outer suburban areas than in the inner suburbs and centre although this pattern is by no means universal. The school territories are shown at 20% of their real size so as to avoid overlap. The same patterns can also be detected in Figures 8 and 9 that show the mean distances travelled to each secondary school and the roll size of each secondary school respectively. These figures also shows that as a school is closed, the rolls of surrounding schools are increased and the mean distances travelled to surrounding schools increase as the displaced pupils are accommodated in alternative educational facilities.
Examining the mean distance travelled to school by intake type and governance, as summarised in Table 6, reveals that VA selective religious schools have the shortest mean distance travelled to secondary schools but the longest distance travelled to primary schools in 2006. Community comprehensive schools have either the shortest mean distance or second shortest mean distance travelled to school across all years. Community comprehensives are also the most prevalent school type in the study as shown in Figure 5. VC comprehensive schools at the secondary phase have the largest mean territory size, although on further examination it is clear that there is only one of these schools and it resides in a fairly rural area close to the north west border of the Leeds study area. An initial examination of the distances travelled to school by pupils categorised by ethnic origin revealed that Asians, and in particular Bangladeshis and Pakistanis, consistently had low mean travelling distances. This may be a reflection of the strong community bonds in Asian communities and needs
16
further investigation with respect to the low mean territory sizes of the selective religious schools in the area.
Figure 6. Mean size of primary school territories, 2001-06
17
Figure 7. Size of primary school rolls in Leeds, 2001-06
18
Figure 8. Mean size of secondary school territories, 2001-06
19
Figure 9. Size of secondary school rolls in Leeds, 2001-06
20
Intake
Governance
2004
2005
2006
Primary *
*
1.53
Community
1.05
0.96
0.97
Comprehensive
Voluntary Aided
1.69
1.43
1.38
Comprehensive
Voluntary Controlled
1.22
1.42
1.43
Selective (Religion)
Community
1.19
*
*
Selective (Religion)
Voluntary Aided
1.68
1.45
1.77
Selective (Religion)
Voluntary Controlled
*
*
1.12
Comprehensive
Academies
Comprehensive
Secondary Comprehensive
Community
2.52
2.47
2.46
Comprehensive
Voluntary Aided
5.08
4.06
4.21
Comprehensive
Voluntary Controlled
*
3.42
3.31
Selective (Religion)
Voluntary Aided
3.04
2.18
2.22
Table 6. Distance to school by intake type and governance, 2004-06
4.4.
Pupil commuting distances by ethnicity
Tables 7 and 8 show the average commuting distance by ethnicity for pupils travelling to primary and secondary schools respectively. As one would expect, the average commuting distance is much lower for primary age school pupils (1.09 km) than it is for secondary age school pupils (2.65 km). Of much more interest is the fact that the Bangladeshi group travel the shortest distances to both primary and secondary schools at 0.43 and 1.73 kilometres in 2006 respectively. The average distance that the Bangladeshi ethnic group travel to secondary school is actually less than the Black Caribbean ethnic group travel to primary schools suggesting that the Bangladeshi ethnic group live in tight community areas and attend a local school.
Another ethnic group with an interesting commuting pattern is the Black African group. They travel a relatively short average distance to primary school but have one of the highest average distances to secondary school, 0.96 and 3.05 kilometres in 2006 respectively. Another interesting point about the Black African ethnic group is that
21
the average distance travelled to primary school has consistently dropped over the six year period while the average distance to secondary school has fluctuated around the 2.6 kilometre distance. This is also one of the fastest growing ethnic groups in the Leeds MDA.
Ethnic Origin Traveller of Irish Heritage
2001
2002
2003
2004
2005
2006
*
*
2.16
2.26
2.21
2.19
Black Caribbean
1,37
1.27
1.44
1.44
1.37
1.79
White Irish
1.17
1.52
1.60
1.35
1.54
1.41
*
*
1.11
1.17
1.23
1.37
Information Not Yet Obtained
1.03
0.82
1.19
1.34
1.13
1.34
Chinese
1.06
1.20
1.18
1.20
1.20
1.32
Refused
*
0.73
1.13
1.29
1.43
1.28
Any Other White Background
1.31
1.26
1.27
1.42
1.39
1.27
Any Other Black Background
1.21
1.16
1.12
1.18
1.23
1.26
*
*
1.16
1.18
1.21
1.24
1.04
1.02
1.07
1.12
1.17
1.21
White and Asian
*
*
1.23
1.36
1.17
1.19
Any Other Mixed Background
*
*
1.27
1.16
1.27
1.18
1.01
1.05
1.06
1.09
1.09
1.10
White and Black African
*
*
0.91
1.29
0.94
1.05
Any Other Asian Background
*
*
0.94
1.00
0.98
0.98
Black African
1.40
1.17
1.13
1.06
1.01
0.96
Any Other Ethnic Group
1.11
1.09
0.98
0.93
0.88
0.87
Pakistani
0.75
0.75
0.73
0.80
0.79
0.77
Bangladeshi
0.38
0.35
0.36
0.37
0.41
0.43
Overall Average
1.01
1.04
1.06
1.08
1.08
1.09
Gypsy / Roma
White and Black Caribbean Indian
White British
Table 7. Mean distance travelled to primary school by ethnic group, 2001-06
22
Ethnic Origin
2001
2002
2003
2004
2005
2006
Information Not Yet Obtained
2.72
2.35
2.83
3.05
4.65
4.49
Any Other Black Background
3.11
3,10
3.76
3.52
3.33
3.47
Black African
3.56
3.30
2.97
2.97
2.95
3.05
*
*
2.58
2.90
3.08
3.05
Black Caribbean
3.46
3.52
3.15
3.12
3.18
2.95
Any Other White Background
3.80
3.03
2.97
3.13
2.98
2.95
White Irish
2.89
3.04
2.83
3.00
2.93
2.91
Any Other Asian Background
*
*
2.71
2.38
2.63
2.88
White and Black Caribbean
*
*
2.63
2.64
2.81
2.87
White and Asian
*
*
2.52
2.49
2.79
2.81
2.82
3.11
2.84
2.95
2.97
2.80
Gypsy / Roma
*
*
2.21
2.89
2.91
2.72
Refused
*
3.91
2.85
2.33
2.82
2.68
Any Other Ethnic Group
2.96
2.91
3.89
3.02
3.02
2.65
Pakistani
2.78
2.66
2.74
2.67
2.65
2.65
*
*
2.34
2.46
2.38
2.64
White British
2.53
2.60
2.61
2.62
2.60
2.60
Indian
2.88
2.92
2.71
2.68
2.67
2.56
*
*
2.36
2.33
1.75
1.90
Bangladeshi
1.74
1.83
1.73
1.68
1.62
1.73
Overall Average
2.61
2.64
2.65
2.64
2.65
2.65
Any Other Mixed Background
Chinese
White and Black African
Traveller of Irish Heritage
Table 8. Mean distance travelled to secondary school by ethnic group 2001-06
5. Pupil mobility and residential migration Using the known pupil residence and the establishment attended, it is possible to analyse the numbers of pupils moving home locations, school or both home location and school from one collection year to the next. However, due to the 2001 data having a number of unknown UPNs, it is not viable to use this year in this type of temporal analysis so the analysis in this section will refer to the time periods 2002/03, 2003/04, 2004/05 and 2005/06. It can be seen throughout this analysis that the time period 2004/05 has higher numbers of pupils moving school, this is due to the
23
changes in the school network that took place in the September of 2004 which saw 18 schools merge to form nine new schools with four school closures. All the values in this section are shown as percentage rates of the ethnic pupil population of compulsory school age. 5.1.
Gender
Figure 10 shows that there is very little difference between male and female movement patterns. However, pupil residential mobility rates are consistently dropping over the four time periods shown here from just below 10% in 2002/03 to P u p ils M o v in g H o m e F e m a le M a le
12
% Rate
10 8 6 4 2 0 02-03
03-04
04-05
05-06
Y e ar
P u p ils M o v in g S c h o o l F e m a le M a le
7 6
% Rate
5 4 3 2 1 0 02-03
03-04
04-05
05-06
Year
P u p ils M o v in g H o m e a n d S c h o o l F e m a le 3
M a le
% Rate
2 .5 2 1 .5 1 0 .5 0 02-03
03-04
04-05
05-06
Y e ar
Figure 10. Pupil mobility by gender, 2002/03 - 2005/06 24
just below 8% in 2005/06. Pupils moving school show no discernable trends other than the higher percentage rate in 2004/05, which is expected due to the large number of school network changes that took place in this year. 5.2.
FSM eligibility
FSM eligibility displayed in Figure 11 shows a surprising trend that substantially more pupils tend to move home when eligible for a FSM than when not. The rates of P u p ils M o v in g H o m e E lig ib le 16
N o t E lig ib le
14
% Rate
12 10 8 6 4 2 0 02-03
03-04
04-05
05-06
Y e ar
% Rate
P u p ils M o v in g S c h o o l E li g i b le
10 9 8 7 6 5 4 3 2 1 0
N o t E li g i b le
02-03
03-04
04-05
05-06
Y e ar
P u p ils M o v in g H o m e a n d S c h o o l E lig ib le 6
N o t E lig ib le
% Rate
5 4 3 2 1 0 02-03
03-04
04-05
05-06
Ye a r
Figure 11. Pupil mobility by Free School Meals eligibility, 2002/03 - 2005/06
25
home moves, school moves and home and school moves are almost double for pupils eligible for FSM over those that are not. The reasons for this are unclear at this time although it may be linked to higher home mobility rates for families in public rented accommodation or more family breakdown for various reasons. Further investigation to find a definitive answer is required. 5.3.
National Curriculum year group
Figure 12 shows the percentage rate of pupils moving school by National Curriculum
All Pupils Moving School 100 90
Year 02-03 Year 03-04
80
% Rate
70
Year 04-05
60
Year 05-06
50 40 30 20 10 0 R/ 4
1/5
2/6
3/7
4/8
5/9
6 / 10
7 / 11
8 / 12
9 / 13
10 / 14
11 / 15
NC Year Group / Age
Pupils Moving School Excluding Primary to Secondary 14 12
Year 02-03 Year 03-04 Year 04-05
% Rate
10 8
Year 05-06 6 4 2 0 R/4
1/5
2/6
3/7
4/8
5/9
6 / 10
7 / 11
8 / 12
9 / 13 10 / 14 11 / 15
NC Year Group / Age
Figure 12. Pupil school mobility by National Curriculum year group, 2002/03 - 2005/06
26
year group. It can clearly be seen that there is a spike at year seven (age 11). However, this is the year when pupils move from primary to secondary school so this is an enforced move. In the lower of the two line graphs, this mandatory school move has been excluded and a second much smaller spike becomes more apparent. The smaller spike of pupils moving schools takes place in year three (age 7), which is the year after pupils sit their first Key Stage examinations. It is also interesting to note that the rate of pupil mobility between schools declines steadily as pupils get closer to the Key Stage 4 (GCSE) examinations in year 11 (age 15).
Figure 13 shows the rate of pupils moving both home and school by National Curriculum year group. There is a large spike at the time when pupils move from primary to secondary school with rates rising from around 2% in year 6 (age 10) to over 10% in year 7 (age 11). Although this can partially be explained by pupils that would normally only be recorded as moving home having to move school from primary to secondary, the spike is very prominent and would suggest home movement into school territories to ensure their child gets a place at his/her chosen school. P u p ils M o v in g H o m e a n d S c h o o l 16 14
Ye ar 0 2-0 3
12
Ye ar 0 3-0 4 Ye ar 0 4-0 5
% Rate
10
Ye ar 0 5-0 6 8 6 4 2 0 R /4
1 /5
2 /6
3 /7
4 /8
5 /9
6 / 10
7 / 11
8 / 12
9 / 13
10 / 14 11 / 15
N C Y e a r G r o u p / Ag e
Figure 13. Pupil moving home and school by National Curriculum year group, 2002/03 - 2005/06 An overall downward trend is also evident in Figure 13 after year 7, a clear reduction in pupil mobility can be seen the closer they get to their GCSE examinations. Figure 14 shows pupils that just move home by National Curriculum year group and again an 27
Pupils Moving Home 16 14
% Rate
12 10 8 6
Year 02-03
4
Year 03-04
2
Year 04-05
0
Year 05-06 R/ 4
1/5
2/6
3/7
4/8
5/9
6 / 10
7 / 11
8 / 12
9 / 13 10 / 14 11 / 15
NC Year Group / Age
Figure 14. Pupil moving home by National Curriculum year group, 2002/03 – 2005/06 increase in the rate of home moves can be seen at the time when pupils are moving from primary to secondary school, suggesting that parents do tend to consider a home move to secure a place for a child at their preferred school. Again the general downward trend in movement the closer the pupil is to their GCSE examinations can be seen. 6. Modelling framework To help education planners to understand, analyse and use the rich data source being collated in PLASC to support effective decision making and policy formulation, it is necessary to apply more advanced analytical techniques such as Spatial Interaction Models (SIMs) or Agent Based Models (ABMs) to the sector.
However, it is
recognised that any such developments will require a significant amount of research and development, including mechanisms to accommodate these computer models which allows for gradual updates and expansion of the system.
These are the
considerations that have been taken into account when developing the ‘Flexible Modelling Framework’ (FMF) outlined in Figure 15. Although the development of the FMF is not complete, a beta version for testing has been developed and applied in initial runs of a SIM to test the proof of concept and viability of the models.
28
Figure 15 shows how the components of the FMF fit together. The ‘Application Framework’ is a Java component that is responsible for screen and communication management. It is only aware of the ‘Data Access Layer’ and the ‘Information’ object. When the application starts, the framework checks specified locations on a computer or computer network to find components to load. As components are found they are loaded and added to the main menu bar.
Figure 15. Component diagram of the Flexible Modelling Framework
The Data Access Layer is a Java component that is responsible for the management of all data requests. It controls connections to one or more databases and can read or write data to a specified database. All requests to read or write data must go through the Data Access Layer. The Information object is a Java component that contains information about the application and communication pathways for objects to talk to each other and the Framework.
Although the Framework is not aware of any
components that are loaded, a reference to an Information object is passed to each component as it is loaded enabling each component to broadcast information to the Framework or other interested components.
29
The Java components (SIM, Agent and Visual) are all free standing Java projects. They are the components that the framework will search for when loading. As each component is found and loaded by the Framework, the menu for the component will be added to the main screen menu bar. Each component is freestanding and although the Framework will grant access from the main screen to the active component, it is the individual component that has to supply the user interface layer. Because each component is freestanding and is not hard coded into the Application Framework, it is easy to develop new versions, enhance existing versions, completely redesign a component or just fix a bug without having to change any code in any other part of the application. The revised code can then simply be placed in the network or local folder that the Framework searches at start up. The next time the application is started, the revised version will automatically load and run. The application design outlined here makes modular development and deployment possible with minimal disruption to other parts of the system and can be used as the basis for a planning support system with more modular components being added as and when they are developed/required.
SIMs have been used in both academia and industry for many years and have a proven track record in sectors such as retailing and finance (Birkin, 1996; Birkin et al., 2004). They require aggregated data at a chosen spatial level. For example, if a SIM was to be run on the education commuting data at a Middle Layer Super Output Area level, then all pupil counts would need to be aggregated to these spatial units. The model allocates the flow from an origin zone to a destination zone or point (school).
Some initial runs of an origin constrained SIM on the education data
resulted in relatively good territory predictions matching the observed flow in size reasonably well. However, schools that had a high attractiveness value in the initial model (attractiveness was approximated using a combination of pupil teacher ratio, OFSTED inspection rating and number of computers available on site) had large overpredictions of pupil numbers exceeding their admission limits, and the surrounding schools had under-predictions. A possible way to improve this situation is to use an origin-destination constrained model, although this type of SIM would attempt to ensure all schools reached their admissions
30
limits, which again is unrealistic. Therefore it is necessary to relax the destination constraint while keeping the origin constraint rigid and this is going to be the focus of future research.
Although relaxing the destination constraint on a SIM would aid in improving the predictive capability, it is still the case that some schools have different admissions policies to those of the LA. This variation in admissions criteria is difficult to incorporate into a SIM. However, using an ABM approach, each school could be a coded software agent aware of its own admissions limits and policies, and either accept of reject applications from pupil agents based on their attributes. Each pupil agent might contain attributes from the PLASC data, so individual pupil agents could have attributes relating to their home location, gender, religion and FSM eligibility and any other attributes available that are required, thus retaining and exploiting the rich properties of the PLASC data. One drawback to ABM is in certain ‘what if’ scenario modelling situations. For example, if an education planner wanted to know what the impact of the creation of a new housing estate would be on surrounding schools, this would be relatively easy to achieve in a SIM, boosting the pupil numbers in an area by the estimated increase in pupils expected. However, for the data hungry ABM, the problem is much more difficult as each pupil agent would have to have all attributes estimated, requiring an additional model to estimate the distribution and pupil attributes before they are fed into the ABM.
In summary, the key differences between the two types of modelling are as follows:
SIMs are robust with a proven track record in industry.
SIMs ignore much of the data collected only using aggregated pupil counts per origin zone.
There are difficulties associated with over-predicting popular/attractive schools using SIMs.
It is not easy to incorporate different admissions policies for different school types in SIMs.
ABMs are data hungry using much of the rich data source provided by PLASC.
31
It is not trivial to add pupils into an ABM for ‘what if’ scenario modelling.
Admissions limits and policies can easily be incorporated into an ABM.
It is clear from the above that both model types have their advantages and disadvantages and it may be that a combination of the two modelling types to be used in different situations will be more effective than one single model to fit all situations. Therefore the flexibility offered by the FMF to develop, redevelop and expand modules and apply them quickly and easily is an attractive proposition. 7. Conclusions
In recent years, increasing interest has been shown by geographers and educationists in the spatial dimensions of primary and secondary education provision and pupil attainment. This interest has been sharpened by prevailing demographic trends, Government policy on access to schools at national level and variations in admissions policies at local level by education authorities or individual schools. Whilst particular attention has been paid to issues such as variations in attainment levels, segregation and access, relatively little attention has been devoted to the interaction flows between homes where children live and schools at which they study.
At a time when there are very considerable decreases in the demand for primary and secondary school places across the country and when Government is committed to the principle that parents should have access to the school they wish their children to attend, regardless of the commuting distance involved, understanding the patterns of demand and being able to model the journey to learn becomes increasingly important for those policy makers concerned to ensure service provision meets demand. Assisting the process of strategic planning is the objective of our research and the latter section of the paper has proposed a framework that will include facilities to explore alternative scenarios using two alternative modelling methods, one which is based on modelling aggregate flows and one which simulates individual behaviour. The results of this work will be reported in due course.
However, in order to build an effective modelling system, it is necessary to have reliable journey to school data. As this paper explains, the PLASC provides rich and comprehensive information on an annual basis on daily pupil movements between home and school. Using PLASC data provided for all the state schoolchildren in Leeds Metropolitan District on an annual basis between 2001 and 2006, we have 32
demonstrated that a large amount of work is needed in the first instance to check and clean the data in order to resolve inconsistencies and errors in pupil attributes between years and to provide missing data through the use of interpolation techniques. The result is a more accurate and reliable annual series of data sets that have been used in the paper to show how distributions of primary and secondary pupils inevitably change over time and how school territories also vary in space and time. The latter are less variable for primary than secondary schools with secondary schools in more suburban locations having wider territories although not perhaps as pronounced as we might have expected. Mean distances to school have increased marginally from 1.01 to 1.09 km between 2001 and 2006 in the case of primary schools and from 2.61 to 2.65 km over the same period in the case of secondary schools.
The ethnic
differences in distance travelled to school in Leeds are more interesting with the Asians (Bangladeshis in particular) having relatively average short journeys to school. These results, suggesting a more tight knit Asian community, conform with findings by Johnston et al. (2006) that school segregation for South Asian populations is very substantially greater than residential segregation. The same does not appear to apply to Black Caribbean and Black African populations, at least at secondary level, since these groups have relatively high average distances to school.
The longitudinal linkage between annual PLASC data sets is very useful in providing a mechanism to be able to generate a measure of pupil mobility between schools, residential migration, and the coincidence of change of school and home. Whilst residential migration peaks in national curriculum year 7 (age 11) when all children have to change school, there is also some evidence of higher residential migration in national curriculum year 3 (age 7) once the first round of examinations in year 2 have been taken. Whilst the migration and mobility rates of ethnic groups re-emphasise the relative stability of the Asian communities, the high rates of residential migration and pupil mobility for children receiving free school meals requires further investigation.
33
References Armytage, W.H.G. (1970). Four Hundred Years of English Education, 2nd Edition. Cambridge University Press, Cambridge. Birkin, M. (1996). ‘Retail location modeling in GIS’ in Spatial analysis: modeling in a GIS environment. Longley, P., Batty, M. (eds), GeoInformation International, Cambridge. Birkin, M., Clarke, G., Clarke, M., Culf, R. (2004). ‘Using Spatial Models to Solve Difficult Retail Location Problems’ in Applied GIS and Spatial Analysis. Stillwell, J., Clarke, G. (eds). John Wiley & Sons Ltd, Chichester. Burgess, S., Briggs, A., McConnell, B., Slater, H. (2006). ‘School Choice in England: Background Facts’. Working Paper 06/159, Center for Market and Public Organisation, University of Bristol. DfES
(2006a).
‘National
Pupil
Database:
The
Future’.
URL:
http://www.bris.ac.uk/Depts/CMPO/PLUG/userguide/catherine.ppt#258,2,Natio nal Pupil Database: The Future DfES (2006b). ‘2006 School Census: Maintained Secondary Schools Technical Specification’. URL: http://www.teachernet.gov.uk/ doc/9096/School Census 2006 Specification School and Pupil v1.91.doc Ewens, D. (2005). ‘The National and London Pupil Datasets: An introductory briefing for researchers and research users’. DMAG Briefing 2005/8, Data Management and Analysis Group, Greater London Authority, City Hall, The Queen’s Walk London, SE1 2AA. GAD. (2007). ‘National population projections 2004-based’. Series PP2 No 25, Palgrave Macmillan. URL: http://www.gad.gov.uk/population/index.asp Gorad, S., Fitz, J. (2000). ‘Investigating the determinants of segregation between schools’, Research Papers in Education 15(2): 115-132. Gordon, P., Aldrich, R., Dean, D. (1991). Education and Policy in England in the Twentieth Century. The Woburn Press, London. Harland, K., Stillwell, J. (2007). ‘Commuting to school in Leeds: how useful is the PLASC?’. Working Paper 07/02, School of Geography, University of Leeds, Leeds. HMSO (1996). ‘Education Act 1996’. Act of parliament, Her Majesty’s Stationery Office and Queens Printer of Acts of Parliament, London.
34
Johnston, R., Wilson, D., Burgess, S. (2005). ‘England’s multi-ethnic educational system? A classification of secondary schools’. Environment and Planning A 37: 45-62. Johnston, R., Burgess, S., Wilson, D., Harris, R. (2006). ‘School and residential ethnic segregation: an analysis of variations across England’s local education authorities’. Regional Studies 40(9): 973-990. Jones, P., Elias, P. (2006). ‘Administrative data as a research resource: a selected audit’. Economic & Social Research Council Regional Review Board Report 43/06, Warwick Institute for Employment Research. Lawrence, I. (1992). Power and Politics at the Department of Education and Science. Cassell, London. Statham, J., Mackinnon, D., Cathcart, H., Hales, M. (1991). The Education Fact File. The Open University, London. Teachernet (2007). ‘Teaching in England: Types of schools in England’. URL: http://www.teachernet.gov.uk/teachinginengland/detail.cfm?id=497 The Daily Telegraph (2007). ‘School place lottery will hit house prices’. Saturday, 3 March.
35