Vol. 67 · No. 2 · 151–166
2013
USING QUADTREE REPRESENTATIONS IN BUILDING STOCK VISUALIZATION AND ANALYSIS M artin Behnisch, Gotthard M einel , Sebastian Tramsen and M arkus Diesselmann With 7 figures and 1 table Received 14. September 2012 · Accepted 25. February 2013
Summary: Many public facilities, institutions, and private domains in Germany are still limited to using administrative zones when visualizing densities of statistical data. When dealing with geospatial information the following question is becoming increasingly more important: „How much data (persons/buildings) must be aggregated to consider regulations of data protection?”. This article presents a quadtree representation to provide building data management on a small scale. In recent years, German buildings were fully geocoded as a building polygon. Regarding statistical and cartographic analysis this allows the use of grids of arbitrary size and any administrative units. The city of Hamburg and several surrounding communities (Hamburg conurbation) are used as an example to demonstrate the principle of a quadtree. It is also possible to apply the general model to other sensitive data and to other regions (e.g. cities or rural areas). This includes the possibility of using regular grids in any projection useful for European cooperation (INSPIRE). The building representation, using varying cell sizes is not to be understood as a pure visualization as it serves as a new structure on a small scale to carry out cell-based analyses in the future. Zusammenfassung: Von der Forschung und der Raumplanung werden dringend kleinräumige Statistikdaten benötigt. Im Umgang mit kleinräumiger Information wird die folgende Frage zunehmend wichtiger: „Welche Daten (z.B. Personen/Gebäude) erfordern eine aggregierte Darstellung, damit Bestimmungen des Datenschutzes nicht verletzt werden?“. Der Artikel widmet sich am Beispiel der Stadtumlandregion Hamburg der Darstellung von sogenannten Mischrasterkarten nach dem Quadtree-Prinzip. In Verbindung mit den Hausumringen als Produkt der amtlichen Geoinformation (= Umringpolygone der Gebäudegrundrisse) zeichnen sich neue Möglichkeiten ab, den Gebäudebestand genauer zu quantifizieren und räumlich hoch aufgelöst abzubilden. Die europäische Interoperabilität wird in Bezug auf die Richtlinie INSPIRE thematisiert. Die Aufbereitung der Gebäudedaten im Kontext der Mischraster ist nicht als reine Visualisierung zu verstehen, da es sich um eine kleinräumige Struktur handelt, die neue zusätzliche Möglichkeiten zur Datenhaltung schafft und eine solide Basis für künftige zellbasierte Analysen bildet. Keywords: Data protection, cell-based analysis, building stock, quadtree, GIS, thematic cartography
1 Introduction – geovisualization and data aggregation “Geographic visualization [can be defined] as the use of concrete visual representations […] to make spatial contexts and problems visible, so as to engage the most powerful human informationprocessing abilities, those associated with vision.” (M ac E achren 1992, 101). Depending on how a spatial data model (e.g. vector/grid) is used, different visualizations may be possible. When dealing with sensitive geospatial information the following question is becoming increasingly more important: „How much data (e.g. persons/buildings) must be aggregated to consider regulations of data protection?” DOI: 10.3112/erdkunde.2013.02.04
Rather than using data collected by arbitrary administrative zones, such as census tracts, the authors suggest a specific form of a grid representation. A regional quadtree could be ideal for both representing relevant information in a geographic information system, as well as, considering current frameworks of data protection. In this context, it should be considered that the more comprehensive the database and the more sensitive the data, the greater the risk of abuse: “The boundaries between personal and anonymous data are fading in view of the rapid increase in data volumes, as ever more powerful computers are making it easier and easier to restore the personal reference retroactively” (RatSWD 2009). The purpose of this paper is therefore to highlight the opportuni-
ISSN 0014-0015
http://www.erdkunde.uni-bonn.de
152
ties and challenges of quadtree representations to provide spatial data management as well as spatial analysis on a small scale. Some examples are at first exemplified on the basis of German building stock data. It is obvious that building stock data do not represent a typical example of sensitive data. Building distribution data play an important role in building and settlement related research, especially in exploring relationships with social, environmental, and economical issues. Recently, the research department “Monitoring of Settlement and Open Space Development” at the Leibniz Institute of Ecological Urban and Regional Development ( IOER) has been increasingly interested in advanced procedures for the observation of settlement and open space development on the basis of spatial grids (M einel et al. 2009; M einel and S chumacher 2011). The building representation, using varying cell sizes is, therefore, not to be understood as a pure visualization as it serves as a new structure on a small scale to carry out cellbased analyses in the future. The issue of data protection is of rising importance when the new grid structure is filled with other building attributes (e.g. energy consumption per building, real estate information per building, number of households per building). In consideration of strict laws of data protection in Germany the approach should prove to motivate the implementation of hierarchic data structures in order to handle sensitive data (e.g. individual data, economical data etc.). The idea is to encourage (German) statistical institutions and political decision makers to define official thresholds and cell sizes when dealing with spatial grids and aspects of data protection. The article is organized as follows: In Section 2 the authors present a general discussion of data protection; and then briefly outline the concept of threshold values to visualize data on a small scale. Differences in European countries are presented in order to the legal frameworks. In section 3, the authors present selected approaches currently available for grid representations, using varying cell sizes. In section 4 the quadtree approach is presented at the conceptual level. In section 5, the authors discuss the INSPIRE directive; and the authors briefly outline the building data that are relevant for the suggested approach. Later on in section 6 the quadtree approach is applied to building data in the study region of Hamburg. A discussion of results is followed by conclusions and recommendations for further research.
Vol. 67 · No. 2
2 Data protection and freedom of information in Germany and other countries The Federal Statistical Office in Germany (=Statistisches Bundesamt) publishes a variety of data on the economy, environment, population, and buildings: “Producing high-quality statistical information is not a simple matter as it presupposes a sound theoretical and practical knowledge of the issues involved. Ensuring a thorough methodological preparation and a response burden as small as possible, implementing strong data protection measures, applying modern technologies in data collection and processing, and selecting the intended data distribution channels are some of the components of the process from data collection to the availability of statistical information.” (STATISTISCHES BUNDESAMT 2012). Currently, statistical information is primarily published in reports or tabular format. Choropleth mapping is a common technique to visualize thematic aspects. In view of statistical information, these maps are based on administrative units, such as districts or communities. Visualization and analysis on a finer level is not well established (e.g. building blocks) and often not possible due to data protection and/or missing geospatial data. Legal frameworks enable and control the flow of data (BUNDESREGIERUNG 2007, §10). The purpose of data protection is, according to the Federal Data Protection Act (BDSG (Bundesdatenschutzgesetz) 1, 1.), “to protect the individual against impairment of his right to privacy through the handling of his personal data.” “Personal data means any information concerning the personal or material circumstances of an identified or identifiable individual (the data subject)” (BDSG 3, 1.). Data accessibility tends to differ not only amongst countries but also smaller political entities (e.g. states or provinces, municipalities). Due to the fragmentation of data over many organizations and the financial independence of some of these organizations, data availability in Germany is quite restricted and often subject to payment. Other countries, such as the USA, tend to have a more open access policy on data availability. It is to mention that there is a differentiation in the accessibility of data according to the institution that wants to use the data. Research institutions are often provided with free-of-charge data for research purposes, whereas, e.g. consultancy companies have to pay for the same data. Furthermore data with high resolution tend to be much less accessible than data with low resolution. Especially for GIS-data, such as buildings or building related attributes, the required resolution has a large influence on their availability.
In the context of data protection, the freedom of information legislation should be shortly mentioned. It comprises laws that guarantee access to data held by the state. They establish a right-to-know legal process by which requests may be made for government-held information, to be received freely or at minimal cost. Over 85 countries around the world have already implemented some form of such legislation (=URL: http://right2info.org/, 22.05.2012). In Germany, the Federal Government passed a Freedom of Information Law on September 5, 2005 (=Informationsfreiheitsgesetz), which grants each person an unconditional right to access official federal information. No legal, commercial, or any other kind of justification is necessary. Eleven of the 16 Federal States (in German: Bundesländer) including Berlin, Brandenburg, North Rhine-Westphalia, Schleswig-
Transformation
Georeferencing
Input data with addresses Addresses of housing
Data
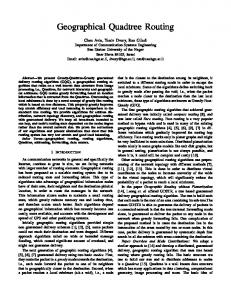
Holstein, Hamburg, Bremen, Mecklenburg-Western Pomerania, Rhineland-Palatinate, Saxony-Anhalt, Saarland, and Thuringia have approved such laws. In recent years, the Federal Statistical Office in Germany has also put emphasis on representations on a small spatial scale so grid concepts are in preparation for future publications of selected statistical information (Schnorr-Bäcker 2010, 773). The Federal Statistical Office aims to develop a standardized grid for representation. Thus, the Federal Statistical Office is able to link personal information to specific grid cells (Szibalski 2007, 138). Figure 1 shows the conceptual state of how to handle aspects of data protection when dealing with grid information. However, the concept is not precise in defining a minimal grid cell size, a value for data blocking, or a threshold of data aggregation ( BUNDESREGIERUNG 2009, §3, Surveying data Address of buildings
Coordinates
X-Street, Z-City
XXX
X-Street, Z-City
34111, 52111
X-Street, Z-City
YYY
X-Street, Z-City
34222, 52222
X-Street, Z-City
ZZZ
X-Street, Z-City
34333, 52333
X-Street, Z-City
XXX
X-Street, Z-City
34444, 52444
…
…
…
…
Input data with coordination Data
Geographical grid
Coordinates
XXX
34111, 52111
YYY
34222, 52222
ZZZ
34333, 52333
XXX
34444, 52444
…
…
1 A B C
Output data without coordination Data
Storage
153
M. Behnisch et al.: Using quadtree representations in building stock visualization and analysis
2013
Number of grid cells
XXX
C2
YYY
C3
ZZZ
C3
XXX
C3
…
…
D E F G
Fig. 1: Geographical grid and census data at the conceptual level (Szibalski 2007, 138)
2
3
4
5
154
Vol. 67 · No. 2
Abs. 6). Therefore, characteristics shall only be given where grid cells are sufficiently occupied. The resolution of data generally differs between European countries (Szibalski 2007, 141). Nine European countries have already implemented census and business data combined with coordinate data or geographical grids. Data protection thresholds are in use in several countries. For example, Sweden modifies data in order to make single persons unrecognizable (data blocking). The European Forum for GeoStatistics activities is mainly concentrated on the development of the best practices in the production of geostatistics in Europe (EFGS, see URL=http://www.efgs.info/, 20.05.2012).
A Steering Committee consists of the national contact persons from the national statistical institutes that participate in the ESSnet project GEOSTAT 1A - Representing Census data in a European population grid, mainly funded by Eurostat. Table 1 gives a short overview on results of a survey about grid data offered in European countries. Selected threshold values for census data are presented to illustrate the diversity of different grid concepts. For example, in Switzerland census data are already offered in a 100-metre grid, Austria uses different grid sizes (125 and 250 metres), and Estonia publishes grid maps with a minimum reso-
Tab. 1: Spatial grids and threshold values for buildings (B) and population (P)
Country
Census Data
Thresholds
Business data
B
P
>3
>30
AT
For grid maps, statistical sample sizes (e.g. number of persons with principal residence, number of households) are published without any restriction when using a grid ≥ 125 metres. A classification depending on the attributes of the sample sizes (e.g. civil status of persons at the principal residence) is also published when using grids ≥ 250 metres.
For grid maps, statistical sample sizes are published without any restriction when using a grid ≥ 125 metres. Classifications of attributes of the sample sizes are published without any restriction when using grids ≥ 250 metres.
Grid maps with a minimal grid spacing of 500 metres. Grid cell values, which account for less than three statistical units are blocked. A special code is specified for blocked cells.
≥3 cell
>30
no details
EST
Grid maps with a minimal grid spacing of 250 metres. Attributes for which confidentiality is not necessary (e.g. population, age, gender) and those that must be kept confidential (e.g. education, employment, consumer structures, income, specifications to residential buildings, apartments and households) are strictly differentiated. Grid cell values that account for less than ten statistical units, or grid cells, that represent only one building, are protected by specifying a value of -1.
>1
≥ 10
Grid maps without any lower bound. For company locations geographic coordinates are available. Data of company locations are published in tables or maps for each building. Grid maps of company locations were not published until now, as a precise specification of coordinates is not allowed. Compliance with statistical confidentiality is only necessary for the attributes number of employees and turnover. This is achieved by classification of data.
>20
Grid maps with a minimal grid of 250 metres. Special methods are achieved for compliance with statistical confidentiality, when data of less than 50 employees account to a grid cell value.
FIN
N
Grid maps with a minimal grid spacing of 250 metres. Special methods are achieved for compliance with statistical confidentiality, when data of less than 20 persons account to a grid cell value.
CH
Grid maps with a minimal grid spacing of 100 metres. A pre-selection of attributes which are published in grid maps is performed. Sensitive attributes, such as religious affiliation or nationality, are not published. There is no indication of grid cell values, which account for less than four statistical units.
Source: Own contribution referring to Szibalski (2007)
≥ 3 cell Grid maps with a minimal grid spacing of 100 metres. A pre-selection of attributes which are published in grid maps is performed. Sensitive attributes are not published. There is no indication of grid cell values, which account for less than four statistical units.
2013
M. Behnisch et al.: Using quadtree representations in building stock visualization and analysis
lution of 500 metres. In Switzerland, grid cells with low population values are only made available in a classified manner (e.g. 1 to 3). In Austria, characteristics relating to people with their main residence (e.g. marital status) are only passed on if there are at least 31 people with their main residence in a grid cell. If the data refer to buildings (e.g. building usage), there must be at least four buildings in the grid cell. Dwelling characteristics (e.g. fixtures category) are only passed on if there are at least four dwellings per grid cell. In the future, official institutions could incorporate the requirements of statistical confidentiality into grid methodologies for data collection and analysis. The process could be summarized in three steps: development of general methodological guidelines, definition of benchmarking statistics and assessment of the effects of different practices on such statistics and, finally, the definition of a threshold for determining when an intervention is necessary. Threshold values are also very interesting in cases of cell aggregation processes. For example, such aggregation procedure is necessary when dealing with quadtree representations. In this article, quadtrees are presented to create maps with varying resolution. At this point, the established techniques to ensure statistical confidentiality in Germany might be useful to grid representations. Those working with personal and proprietary data can benefit from the well-known principles (Giessing and Dittrich 2006, 806). Similar aspects have already been discussed by Szibalski (2005, 5). For example, problems of data protection in Germany are presented in the context of point data and some solutions are presented in the form of grid data and current data protection frameworks. Furthermore, the German E-Government-Act (EGovG, 2012) is widely discussed. It deals with spatial grids, data protection, and shows possibilities of legal frameworks and their modifications. Recently, the German Data Forum (Rat SWD) instituted the “Geo-coding Data” Working Group (Rat SWD 2012). It is expected that this group will make several recommendations as to how the growing demand for spatial data may be met and how the use of geodata by scientists, citizens, and the economy may be improved. Several recommendations are also given in the 3rd geoprogress report of the Federal Government ( BMI 2012) and in a study ( ULD 2008) of the Office of the Data Protection Commissioner (Unabhängiges Landeszentrum für Datenschutz). These recommendations concern the size of grid cells as well as threshold values for the grid cell contents.
155
3 State of the art – other approaches The cartographic visualization, especially that of statistical data, makes it possible to point out distribution patterns, core areas, differentiations, and tendencies, in short, the density. In general, the data consist of point related phenomena or are represented by its centroid (point). Under the assumption that data have a geographic reference, it can, therefore, be visualized on a map. Furthermore, it is important to choose an adequate spatial reference unit for the map. Eduard Imhof (1972, 163) names the following possibilities: 1. Enumeration unit: Also known as the statistical method because it is the most used reference unit in combination with statistical data. Examples for units are federal states, community, and other country wide specific units. 2. Geographic unit: The method here is to form new custom reference units that outline the actual density of the data feature. Therefore, the needed fundament is a dot map. The geographic unit is comparable to the point pattern analysis (Fischer and Getis 2010, 229) that is implemented in GIS software like ArcGIS. 3. Geometric unit: The geometric unit is based on a grid that consists of equally formed squares of the same size. It is also known as the grid net map principle. It should be considered that the great variety of object density (e.g. people, buildings etc.) and coordinate data in (German) settlement structures makes it very difficult to define just one grid resolution. The idea is to set a threshold for a count of objects for a given space. Below the threshold, an aggregation of the space structure has to be triggered. At the beginning of the 1970s, Eduard Imhof visualized statistical data with a georeferenced point basis in grid nets using the cartogram method. From the current viewpoint, it requires only a small step more to calculate a cartogram with high resolution into one with lower resolution. Although, the values of the neighbouring fields have to be summarized/aggregated. Therefore, several levels of grid nets can be calculated and visualized in varying resolution (Tramsen 2012). Wellestablished methods in the field of Geoinformatics exist to solve the problem of varying resolution. These methods are based on appropriate data structures. For example, some approaches focus on data compression (e.g. TIFF-algorithms, see Adobe Systems Inc. 1992) while other approaches use hierarchical data structures such as quadtrees (Samet 1988; Berg et al. 1998). A well-known scientific
156
term for a map with varying resolution based on the quadtree data structure has not been clearly defined in the cartographical literature: In 2005, Josef Strobl (Strobl 2005, 163–171) published a relevant article dealing with census data and data protection requirements in Austria. The article presents a quadtree approach as a solution for the visualization of census data. “Statistik Austria” switched over from storage of census data to a more general relationship to address coordinates in 2001 (Prinz et al. 2004, 556). Consequently, statistical data can now be aggregated for square grid cells of various sizes. Researchers are now able to compile data for studies of small areas, regions or all of Austria. Data for grid cells can be combined or subdivided arbitrarily (Wonka et al. 2009, 661–664). The author’s critical view (Strobl 2005, 163–171) deals with person-related data protection, which appears at the fusion of address with spatial reference (Geo-referencing). Strobl criticizes common GIS software for not implementing quadtree algorithms or other hierarchical data models. The technical term in German is more or less similar to a grid with varying cell sizes (Strobl: «Grid mit variabler Auflösung»). He concludes that the approach is also suitable for Multi Criteria Evaluation (MCE). Ingrid K aminger (Statistik Austria) is of the same opinion that this method is easy to automate and gives an overview of the complete data set in contrast to strategies of data blocking. K aminger criticizes that a grid cell (R1) could be hidden by an aggregated grid cell (R2) that falls below the threshold even if the grid cell (R1) itself does not fall below the threshold (K aminger and Meyer 2007, 3). Werner Meyer of the Federal Office for Statistics, Switzerland presents another specific term for visualizations based on the quadtree principle (in German “Mischrasterkarte”). He is also of the opinion that these maps are very useful to present statistical data on a small scale in consideration of data protection aspects (K aminger and Meyer 2007, 4). Furthermore, he discusses interpolation difficulties in the area statistics of Switzerland (Meyer 2011, 1). Therefore, he recommends the use of grid maps with varying cell sizes as a master map. In his view, these maps should offer locally precise information. Additionally, an interpolated map (e.g. such as Kriging) of the same area should provide the process of interpretation. He argues that some patterns are not easy to compare with real world phenomena (K aminger and Meyer 2007, 7). K ardos et al. (2005, 19–34) developed an appropriate visualization technique to manage certain choropleth issues and uncertainty in census data. The technique is based on hierarchical spatial data
Vol. 67 · No. 2
structures, in particular the region quadtree and the hexagon or rhombus (HoR) quadtree. The region quadtree provides a potential approach for the dissemination of aggregated census data and standardization of spatial units, thus reducing subjectivity. TRUST (The Representation of Uncertainty using Scale-unspecific Tessellations) is here discussed as a developed software suite, implemented as an add-on to ESRI ArcGIS.
4 Method – quadtree approach Hierarchical data structures are representation techniques in the domains of computer graphics, image processing, computational geometry, geographic information systems, and robotics etc. (Berg et al. 1998). Examples are the quadtree, the k-d tree (k-dimensional), the R tree, the R+ tree, the R*-tree, the X-tree or the BSP tree (binary space partitioning). The quadtree is suitable for the given representation problem. It is based on the principle of recursive decomposition of 2D or 3D space (Samet 1988, 1). This space is filled with data that can be in the form of points, regions, curves, surfaces, or volumes. There are different kinds of quadtree approaches that can be separated accordingly: 1. By the data type they represent (e.g. areas, points, lines and curves). 2. By the principle of space decomposition: Space can be divided into equal size quadrants on each decomposition level (e.g. region quadtree) or be triggered to divide by the data object itself (e.g. point quadtrees). 3. By the resolution or depth of space decomposition: It can be set manually (“divide x-times” or “divide until a count (threshold) of data objects per space structure is reached”) or it automatically takes the objects in consideration (“divide space until each data object is considered”) (Samet 1988, 2). The desire to keep a high resolution of data (e.g. individual data, building data) in cartographic representations while not breaking data protection laws, requires a solution that enables the possibility to have multiple resolutions of data in one visualization. For this work (see section 6), the hierarchical structure of the region quadtree was applied. In contrast to the typical region quadtree the presented approach begins with the grid of the highest resolution (bottomup-principle). After a spatial join with that grid, the cells have the object count. With a defined threshold (>3) the algorithm now aggregates until each grid cell object count meets with it. Figure 2 shows an example consisting of a test area with point objects. As the
157
M. Behnisch et al.: Using quadtree representations in building stock visualization and analysis
Spatial Join
2013
6
7
5
4
3 f 0g 1 j 1k
6
7
8
8
5
3
2
8
8
6
5
4
3
0 h i l m 1 n 1o 1 r 0s
6
5
4
4
3
2
1p 1q 1 t 2u
4
4
2
3
2
2
3
3
2
2
1
1
2
2
4
4
3
2
2
2
2
3
5
6
5
4
0
0
1
3
4
6
4
4
6
7
8
8
6
5
4
4
0
17
4
9
6
12
4
2
b
8
4
9
c
4 d
7
b
12
8
17
e
14
9
5
6
5
4
4
6
4
4
Example Quadtree Structure a
16
7
Quadtree Aggregation
1
c
d
e
a 14
f ghi jklmnopqr stu
9
5
6
5
4
4
6
4
4
Used Threshold: > 3
Fig. 2: The bottom-up principle based on the region quadtree at the conceptual level (own contribution)
158
objects will likely be randomly distributed and lack a specific pattern the resulting aggregated grid consists of quadrants of variable size – the quadtree representation (e.g. grid mode map, multi-resolution grid). The relationship between the quadtree representation, with its sub-divided cells, can be also shown as links and nodes in a directed tree, with each link being directed from the parent node towards its children (sub-quadrants). After choosing, testing, and evaluating the approach, the integration and automation into a geographic information system (GIS) was the next step. In GIS -Software quadtree approaches are mostly available as a secondary structure (spatial index) but seldom as a primary data structure (e.g. SPANS resp. Geomatica, URL= http://www.pcigeomatics.com, 20.01.2013) (Strobl 2005). ArcGIS was used for the implementation of an automated quadtree solution.
5 INSPIRE directive and building dataset The INSPIRE directive (infrastructure for spatial information in Europe) was approved in 2007 by the European Parliament to counter the challenges regarding the lack of availability, quality, organization, accessibility, and sharing of spatial information, which are common to a large number of policies and activities and are experienced across the various levels of public authority in Europe. Therefore, it is necessary to take measures of coordination between the users and providers of spatial information ( INSPIRE 2010). INSPIRE will establish a European Union (EU) wide spatial data infrastructure and spatial data harmonization with the background of environmental policies that should be implemented completely by 2019. Examples of some common INSPIRE principles are efficiency in collecting and maintaining data, combining and sharing spatial information from different countries of the EU, and a prompt and transparent availability of geographic information. This will assist the policy making actors across boundaries (=http://inspire.jrc.ec.europa.eu/index. cfm, 20.04.2012). Different implementing rules are adopted to ensure that the spatial data infrastructure between the Member States is compatible and usable in a community and transboundary context. One of these implementing rules is the data specification for different themes like the Specification on Geographical Grid Systems (grids). Grids in general are characterized by a number of n x m cells spanned by two axes. The shape of the grid cells is usually quadrilateral
Vol. 67 · No. 2
although hexagons are also possible. The usage of grids makes it possible to store spatial information with indirect positioning. As a result, they are very useful for the harmonization and reduction of complexity of spatial data as average values of qualitative datasets can be stored in grid cells. The grid, which is specified by INSPIRE, should be used for themes where equal-area grid cells are required with a fixed and ambiguous position. It should be used for statistical reporting and spatial analysis purposes. The grid is based on the ETR S89 Lambert Azimuthal Equal Area coordinate reference system and is defined by hierarchical resolutions of 1 m, 10 m, 100 m, 1000 m, 10000 m, and 100000 m. The grid specified by INSPIRE is used for the quadtree representation of the German building stock (see Fig. 3). It is a challenge to determine the total number of buildings in most countries of the world and, in particular, in Germany (Behnisch 2011, 88–105): The main reason is the lack of appropriate official statistics dealing with all types of buildings. On average, the housing component is well-known due to political interest in social housing. The non-housing component, amounting to approximately 50% of the whole of buildings, is partially covered by annual construction reports. In Germany, many institutions record building data from different perspectives. Collection of data is complicated, often expensive, and the handling of missing data is one of the biggest handicaps. Furthermore, a comprehensive understanding of buildings is difficult to achieve, due to their structural (i.e. use, costs, and materials) and dynamic complexity (i.e. construction, maintenance, refurbishment, demolition). To be able to use building data for quadtree representations, it is necessary to initially give them a spatial reference. Recently, the official building polygons (ZSHH 2011) offer such a possibility. They are based on 2D-building graphics (building footprint) summarized in the ALK (in German: Automatisierte Liegenschaftskarte) or, in the case of Bavaria, contained in the DFK (in German: Digitale Flurkarte). The only attribute per building is the key attribute AGS (in German: Amtlicher Gemeindeschlüssel) of the German municipalities. The official building polygons allow easy combinations with other (statistical) data, as well as visualization and analysis on a finer level. To improve the quality of the dataset and the information content of the buildings some changes were made by the researchers. The applied procedure to handle the amount of buildings in Germany and, in particular, the study area can be described as follows. In one case, the building footprint data
2013
M. Behnisch et al.: Using quadtree representations in building stock visualization and analysis
of one Federal State were not complete. Hence, they were substituted with the buildings from the ATKIS dataset (in German: Amtliches Topographisches Informationssystem). In another case aggregated buildings were separated with the help of the postal address coordinates dataset (= in German: Georeferenzierte Adressdaten Bund) to be consistent. In addition, all buildings were allocated to a specific land use class. Such classification is based on the official topographic and cartographic information system, ATKIS. Depending on the building location and the ATKIS land use class, the buildings
were classified as follows: industrial building (ATKIS land use class: industrial and commerce), special functions building (ATKIS land use class: special function), residential building (ATKIS land use class: residential or mixed use), and other buildings. In addition, some other attributes were given (e.g. label of the federal state, label of the municipality, building’s centre point, etc.). That will increase the usability of the dataset. All grid representations are based on building’s center points. These points are generated from the optimized building polygons.
INSPIRE Reference Grids Germany
With cell sizes of 10 km, 50 km and 100 km
Buildings per 10 km grid cell 131085
Data: Official Building Polygons © GeoBasis-DE/BKG 2011
159
0
0
100
Fig. 3: German building stock and the grid in varying cell sizes based on the INSPIRE directive
200 km
160
Figure 3 presents the German building stock in a localized way. The optimized dataset contains nearly 50 Mio. objects. A majority of the buildings are located in Nordrhein-Westfalen (containing the “Ruhrgebiet”), while the Federal State of Bremen has the lowest amount of buildings. The conurbations in Germany are easily seen. For example, Berlin, Hamburg, the Rhein-Ruhr, and Rhein-Main region are characterized by a large amount of buildings. Figure 4 is based on a 1 km grid, also specified by INSPIRE. The number of buildings per grid cell is presented for two selected land use classes in two quantile maps. Against this background it is possible to compare the industry/commerce buildings per grid cell and the residential/mixed use buildings per grid cell. These maps display a distribution so each clas-
Vol. 67 · No. 2
sification group contains an equal number of features (grid cells). As can be seen from the map below 25% of the grid cells for commerce and industry contain 1-2 buildings and 75% of the grid cells on the mixed use and residential map contain fewer than 206 buildings (75% of grid cells contain between 1–205 buildings).
6 Results – quadtree representations of German building stocks By the use of surveyed data (e.g. official building polygons and coordinates) from well-known institutions (Surveying Authorities of the States of the Federal Republic of Germany) it has become possible to quantify the amount of buildings in Germany on a small
Fig. 4: Localized buildings based on the ATKIS land use classification
2013
M. Behnisch et al.: Using quadtree representations in building stock visualization and analysis
scale. The idea is now to present data of the building’s center points in Germany in a way that ensures the anonymity/right to privacy when dealing with (sensitive) building attributes (e.g. energy consumption per building, real estate information per building, number of households per building). An automated solution was realized to demonstrate the quadtree representation in the framework of building stock visualization and analysis using the example of the Hamburg conurbation. Figure 5 gives insight into specific characteristics of the selected study area. Continental waters, forest, and vegetation, as well as the grid of the aggregation procedure (red line) are presented.
161
Using the quadtree data structure, building densities (resp. number of building’s center points per km²) are presented for the Hamburg conurbation (study area: 64 × 64 km) in figure 6. The determination of thresholds for the ‘number of buildings per grid cell’ is based on ”Statistik Austria”, as previously mentioned in section 2. According to “Statistik Austria”, the threshold demands more than three buildings within a grid cell of 250 m x 250 m. Hamburg itself is a dense area where a large amount of buildings is located (≈500,000). Prominent locations including the harbour, the riv-
Fig. 5: Characteristics of the conurbation Hamburg (e.g. administrative zones, land use, quadtree grid)
162
Vol. 67 · No. 2
er Elbe, the Außen-Alster, and the airport have an influence on the results of the quadtree representation. Regions with many buildings are represented using small grid cell sizes, while regions with just a few buildings are represented using larger grid cell sizes. In particular the outskirts of the city form a contrast to the core area of the city. The cartogram representation is carried out using six classes, which are growing progressively. A graded scale of three colors, from yellow to orange followed by brown visualizes the classes. The high-
er the building density, the darker the color. Grid cells with no building count (0 buildings per grid cell) are shown in a neutral grey without grid lines. The map scale is approx. 1:500 000 and the actual dimension amounts to 64 x 64 km. The projection was carried out using the Lambert azimuthal equal-area projection with the origin at 52° north and 10° east. The description of coordinates has a false easting of 4,321,000 m and false northing of 3,210,000 m. The geodetic reference frame is ETRS89.
Fig. 6: Quadtree representation (threshold >3) of the conurbation Hamburg
2013
M. Behnisch et al.: Using quadtree representations in building stock visualization and analysis
7 Discussion – validation and perspectives for future work In view of statistical information, official maps in Germany are usually based on administrative units such as districts or communities. Problems of aggregation bias are obvious, as are the side effects of the Modifiable Areal Unit Problem ( MAUP, Openshaw 1984). Visualization and analysis on a finer level is not well established and often not possible due to data protection and/or missing geospatial data. With this in mind, a grid map on a small scale based on a region quadtree was investigated. The approach should prove to motivate the implementation of hierarchic data structures in order to handle aspects of data protection. The choice of a threshold for cell aggregation explicitly determines how much details will be generalized (aggregated). Additionally, the scale of the map has an influence on the information density. The number of classes and their separation with a graded scale of colors is also a decisive factor for the perception of the presented content. The resolution of grid cells excessively limits the map scale to be displayed. The final map was created automatically based on a 250 m grid. The presented approach is only usable under certain conditions. At first, the number of rows and columns of the grid must be the same. Secondly, the aggregation procedure demands a number of rows and columns as follows: 2d d>0, d ℮ ℕ. Thirdly, the rows and columns must be continuous. All of these conditions are a strict requirement for the application of the procedure. In other cases (see section 3), it is possible to create quadtree representations in a non-automatic manner. In this case the procedure is based on pre-calculated maps for every aggregation level. In the future, the presented aggregation process needs further optimization, e.g. rule-based aggregation or a specific spatial query approach. The flexibility of the aggregation process correlates with the amount of local information loss. The advantage of the quadtree approach is to form a basis for an accurate depiction of total buildings for the settlement areas on a small scale; so later on other statistical data can be easily stored directly into the matrix representation of the corresponding quadtree (as depicted in figure 7). Each cell, aggregated or not, has an explicit identifier that ensures the connection of data to the database. In addition, the quadtree representation allows the storage of different information in grid cells with their fixed positioning by following the requirements of the
163
INSPIRE directive ( INSPIRE 2010). The proposed
spatial grid has a potential for further analysis and visualization. In general, grid data have great potential for cross-border studies and for studies or indicators where the data are heavily dependent on the spatial entity they relate to. Grid data form a good basis for small area estimations concerning variables that do not have primary data by detailed georeferences. The temporal aspect is also of specific interest as grids offer comparable descriptions over long periods. Previously, the Federal Office for Building and Regional Planning investigated the changes of settlement structures in German agglomeration areas over a period of 10 to 20 years (1980–1999) with a focus on the 1990’s (Siedentop et al. 2003). The agglomeration areas were defined by a 60 km buffer around the boundaries of 44 central cities. This wide spatial scope allowed the examination of development patterns of the inner ring high density suburbs, as well as of outer ring suburbs and rural areas at the fringe of the urbanized area. The agglomeration areas comprise about 60% of the whole area in Germany and nearly 70% of the whole population in Germany. Applying the quadtree approach to selected German agglomerations gives the chance of a comparison within the scope of future work. It is expected that there is a recurring generation of spatial patterns caused by airports, highways, large recreation areas, or other natural features. Furthermore, the knowledge in Germany about selected threshold values will increase and the exploration of quadtree results forms a good basis to elaborate requirements for future data protection guidelines. A nationwide comparison will discover spatial characteristics on a small scale and leads to further content based interpretations in combination with other data. It is possible to quantify the amount of cells, which might be critical in the context of data protection aspects. Data mining and knowledge discovery (M iller and H an 2009, 21) are appropriate techniques for advanced geospatial research and further representations regarding data protection aspects (e.g. finding an appropriate threshold value, explanation of grids based on other settlement data). The conversion of sub-symbolic patterns and trends in data to a symbolic form is realized as the most difficult and critical part of geo-data analysis (Behnisch and Ultsch 2009, 520). The tool ELKI (Environment for Developing KDD -Applications Supported by IndexStructures) may also be interesting for future work (=URL: http://elki.dbs.ifi.lmu.de/, 04.04.2012). This tool is based on knowledge discovery in data-
164
Vol. 67 · No. 2 Grid ID AREA EDGE Buildings Households Energy consumption Real estate value 30
1000
1000
84
101
38532
31
1000
1000
31
56
27498
16023260 7728056
51
250
500
154
559
296651
61806394
Quadtree
Administrative zones
Sensitive data
Real world
Fig. 7: Different density visualizations (quadtree vs. statistical zones) and additional attributes (own contribution)
bases and deals with cluster analysis, identification of outliers, and the use of structures for indexing, currently being researched at the chair for databases of Professor Hans-Peter Kriegel at the LudwigMaximilians-University, Munich. Applying other analytical methods for sensitive data is also of scientific interest, including point pattern analysis, interpolation, spatial autocorrelation, etc. Furthermore interpolated maps (Kriging) with different adjustments could be derived from the quadtree representation (center point of the grid cells). According to K aminger and M eyer (2007, 306–308) this will ease the interpretability of the grid. The quadtree representation is also suitable for the application of Multi Criteria Evaluations or as a basis for the simulation of temporal development scenarios (Strobl 2005, 170).
8 Conclusion The article deals with a quadtree representation based on building’s center points. In particular, a map with varying cell size is presented for the Hamburg conurbation. The basic idea of cell aggregation is feasible to present building information and further (statistical/ business) information on a small scale. Quadtree representations are useful to provide building data management, as well as discussing the importance of determining an accurate depiction of the total buildings necessary for the settlement areas in order to develop an improved “denominator” which would enable the calculation of more accurate rates in GIS analyses involving, e.g., inhabitants, energy consumption, or real estate information.
2013
M. Behnisch et al.: Using quadtree representations in building stock visualization and analysis
Data protection aspects could be implied through levels of detail generated by the structure. The more a structure is subdivided the more detail or resolution is gained. Confronted with the problem of data protection, a loss of details will be considered under certain conditions. The authors want to encourage (German) statistical institutions and political decision makers to define official thresholds and cell sizes when dealing with spatial grids and aspects of data protection on a small scale. For example, it might be possible to present selected official statistical data on the basis of quadtree representations. Grid-based statistics could offer a good alternative to statistics by administrative zones. Other European countries are already prepared (theoretically) to use quadtree approaches when dealing with sensitive data (e.g. census or business data). The experience of other European institutions provides a good basis to establish legal frameworks in Germany. The Leibniz Institute of Ecological Urban and Regional Development ( IOER) has the goal of describing land use and its development nationwide for Germany in a continuous, spatial, and high-resolution manner with the help of suitable indicators. This monitor of settlement and open space development follows spatial and chronological comparisons on the basis of topographic base data (e.g. regarding the location and density of buildings, as well as the issue of the development of the building stock) and, thus, provides a better evaluation of the sustainability of the development via policies and management. The implementation of the monitoring concept has greatly progressed and several indicators are available on the Internet (=URL: http://www.ioer-monitor.de/, 22.01.2012). Small-scale (grid) data will be indispensable to understand spatial structures and processes within the next decades.
References Behnisch, M. (2011): Urban data mining – Eine Technik zur Quantifizierung von Gebäudebeständen? In: Hassler, U. (ed.): Langfriststabilität: Beiträge zur langfristigen Dynamik der gebauten Umwelt. Towards a sustainable development of the built environment. Zürich, 88–105. Behnisch, M. and Ultsch, A. (2009): Urban data mining: spatiotemporal exploration of multi-dimensional data. In: Building Research & Information 37 (5–6), 520–532. Berg de, M.; Kreveld van, M.; Overmars, M. and Schwarzkopf, O. (20083): Computational geometry – algorithms and applications. Berlin, Heidelberg.
165
BKG (BUNDESAMT FÜR KARTOGRAPHIE UND GEODÄSIE) (2011): Digital Basic Landscape Model. ��� Of-
ficial German Surveying and Mapping Authority http://www.bkg.bund.de/nn_149572/EN/FederalOffice/Products/Geo-Data/Digital-Landscape-Models/DLM-Germany/DLMgermany__node.html__ nnn=true (Date: 22.04.2012). BMI (BUNDESMINISTERIUM DES INNEREN) (ed.) (2012): 3. Geo-Fortschrittsbericht der Bundesregierung. BUNDESREGIERUNG (2007): Gesetz über die Statistik für Bundeszwecke (Bundesstatistikgesetz – BStatG). Zuletzt geändert durch Art. 3 G v. 7.9.2007 I 2246. http://www. gesetze-im-internet.de/bundesrecht/bstatg_1987/gesamt.pdf (Date: 25.01.2012). – (2009): Bundesdatenschutzgesetz (BDSG). Zuletzt geändert durch Art. 1 des Gesetzes vom 14. August 2009 (BGBl. I S. 2814). http://www.gesetze-im-internet.de/bundesrecht/ bdsg_1990/gesamt.pdf (Date: 29.02.2012). CITIES ALLIANCE (2007): Livable cities – the benefits of urban environmental planning. Washington D.C. Fischer M. M. and Getis, A. (2010): Handbook of applied spatial analysis. Berlin. Giessing, S. and Dittrich, S. (2006): Tabellengeheimhaltung im statistischen Verbund – ein Verfahrensvergleich am Beispiel der Umsatzsteuerstatistik. In: Wirtschaft und Statistik 8, 805–814. Imhof, E. (1972): Thematische Kartographie. Lehrbuch der Allgemeinen Geographie 10. Berlin, New York. INSPIRE Thematic Working Group Coordinate Reference Systems and Geographical Grid Systems (2010): D2.8.I.2 INSPIRE Specification on Geographical Grid Systems – Guidelines. http://inspire.jrc.ec.europa.eu/documents/Data_Specifications/INSPIRE_Specification_GGS_v3.0.1.pdf (Date: 21.04.2011) Kaminger, I. and Meyer,W. (2007): Neue Raster-Orientierte Statistik in Europa. In: Strobl, J.; Blaschke, T. and Griesebner, G. (eds.): ���������������������� Angewandte Geoinformatik 2007: Beiträge zum 19. AGIT-Symposium Salzburg. Salzburg, 303–308. Kardos, J.; Benwell, G. L. and Moore A. (2005): The visualisation of uncertainty for spatially referenced census data using hierarchical tessellations. In: Transactions in GIS 9 (1), 19–34. MacEachren, A. M.; Buttenfield, B. P.; Campbell, J. B.; DiBiase, D. W. and Monmonier, M. (1992): “Visualization.” In: Abler, R. F.; Marcus, M. G. and Olson, J. M. (eds.): Geography’s inner worlds: pervasive themes in contemporary American geography. New Brunswick, 99–137. Meinel, G. and Schumacher, U. (eds.) (2011): Flächennutzungsmonitoring III. Erhebung – Analyse – Bewertung. Berlin.
166 Meinel, G.; Hecht, R. and Herold, H. (2009): Analyzing building stock using topographic maps and GIS. In: Building Research & Information 37 (5–6), 468–482. Meyer, W. (2011): Visualisierung von Ergebnissen der Arealstatistik der Schweiz mit Kriging und Mischrasterkarten. In: Meinel, G. and Schumacher, U. (eds.): Flächennutzungsmonitoring III. Erhebung – Analyse – Bewertung. Berlin, 83-92. Miller, H. J. and Han, J. (2009): Geographic data mining and knowledge discovery. Boca Raton. Openshaw, S. (1984): The modifiable areal unit problem. Concepts and Techniques in Modern Geography 38. Norwich. Prinz, T.; Strobl, J. and Wonka, E. (2004): Flexible Aggregation regionalstatistischer Erhebungen – Neue Produkte der Statistik Austria. In: Strobl, J.; Blaschke, T. and Griesebner, G. (eds.): Angewandte Geographische Informationsverarbeitung XVI. Heidelberg, 556– 561. RatSWD (Rat für Sozial- und Wirtschaftsdaten) (2009): Data protection and statistics – a dynamic and tensionfilled relationship. Working Paper 82. Berlin. – (2012): Endbericht der AG „Georeferenzierung von Daten“ des RatSWD. http://ratswd.de/Geodaten/ downloads/RatSWD_Endbericht_Geo-AG.pdf (Date: 29.02.2012) Samet, H. (1988): An overview of quadtrees, octrees, and related hierarchical data structures. NATO ASI Series Vol. F40. Theoretical Foundations of Computer Graphics and CAD. Berlin Heidelberg, 51–68 Schnorr-Bäcker, S. (2010): Aktuelle Entwicklungen auf dem Gebiet der Regionalstatistik. In: Wirtschaft und Statistik 8. Wiesbaden, 770–774. Siedentop, S.; Kausch, S.; Einig, K. and Gössel, J. (2003): Siedlungsstrukturelle Veränderungen im Umland der Agglomerationsräume. Bundesamt für Bauwesen und Raumordnung 114. Bonn. STATISTISCHES BUNDESAMT (2012): The 2011 census in Germany. Snapshot of basic information on the population, housing space, education and employment as of 9 May 2011. http://archive-de.com/page/141553/2012-07-17/https:// www.zensus2011.de/english.html (Date: 27.04.2013) Strobl, J. (2005): Hierarchische Aggregation: Detailinformation versus Datenschutz am Beispiel adressbezogen georeferenzierter Datensätze. Salzburger Geographische Arbeiten 38. Salzburg, 163–171. Szibalski, M. (2005): Anonymität von Erhebungseinheiten und statistische Geheimhaltung in digitalen Karten amtlicher Statistikdaten. Methoden – Verfahren – Entwicklungen 2/2005, 5–7. – (2007): Kleinräumige Bevölkerungs- und Wirtschaftsdaten in der amtlichen Statistik Europas. In: Wirtschaft und Statistik 2, 137–143.
Vol. 67 · No. 2 Tramsen, S. (2012): Berechnungen und kartographische Gestaltung von Mischrasterkarten zum deutschen Gebäudebestand – Detailinformation versus Datenschutz. Bachelor’s Thesis. Dresden. ULD (UNABHÄNGIGES LANDESZENTRUM FÜR DATENSCHUTZ SCHLESWIG-HOLSTEIN) (2008): Da-
tenschutzrechtliche Rahmenbedingungen für die Bereitstellung von Geodaten für die Wirtschaft – Gutachten im Auftrag der GIW-Kommission. Wonka, E.; Kaminger, I. and Katzlberger, G. (2009): Regionalstatistische Auswertungen mit geographischen Rastern in der Raumplanung. In: Informationen zur Raumentwicklung 10/11, 661–674. ZSHH (ZENTRALE STELLE HAUSKOORDINATEN UND HAUSUMRINGE) (2011): Official house coordi-
nates and building polygons. http://www.bezreg-koeln. nrw.de/brk_internet/presse/publikationen/geobasis/ faltblatt_geobasis_hauskoordinaten_eng.pdf (Date: 22.04.2012)
Authors Dr.-Ing. Martin Behnisch Dr.-Ing. Gotthard Meinel B. Eng. Sebastian Tramsen Dipl.-Geogr. Markus Dießelmann Leibniz Institute of Ecological Urban and Regional Development (IOER) Weberplatz 1 01217 Dresden
[email protected] [email protected] [email protected] [email protected]