Currently, NASD generates a list of higher-risk brokers. (HRB) using a set of .... series of conference calls, email communication, and a visit by NASD staff to ...
Using Relational Knowledge Discovery to Prevent Securities Fraud ¨ ur Jennifer Neville, Ozg ¨ S¸ims¸ek, David Jensen
John Komoroske, Kelly Palmer, Henry Goldberg
Department of Computer Science University of Massachusetts Amherst Amherst MA 01003-9264 USA
National Association of Securities Dealers 1735 K Street, NW Washington, DC 20006-1516 USA
[jneville,ozgur,jensen]@cs.umass.edu
[komorosj,palmerk,goldberh]@nasd.com
ABSTRACT
1.
We describe an application of relational knowledge discovery to a key regulatory mission of the National Association of Securities Dealers (NASD). NASD is the world’s largest private-sector securities regulator, with responsibility for preventing and discovering misconduct among securities brokers. Our goal was to help focus NASD’s limited regulatory resources on the brokers who are most likely to engage in securities violations. Using statistical relational learning algorithms, we developed models that rank brokers with respect to the probability that they would commit a serious violation of securities regulations in the near future. Our models incorporate organizational relationships among brokers (e.g., past coworker), which domain experts consider important but have not been easily used before now. The learned models were subjected to an extensive evaluation using more than 18 months of data unseen by the model developers and comprising over two person weeks of effort by NASD staff. Model predictions were found to correlate highly with the subjective evaluations of experienced NASD examiners. Furthermore, in all performance measures, our models performed as well as or better than the handcrafted rules that are currently in use at NASD.
The National Association of Securities Dealers (NASD) is the world’s largest private-sector securities regulator, with responsibility for preventing and discovering misconduct among securities brokers such as fraud and other violations of securities regulations. In accomplishing this regulatory mission, it is critical for NASD to target its limited resources on those brokers who are most likely to be engaged in fraudulent behavior. This paper describes an application of relational knowledge discovery methods to identify such brokers, which was a joint effort between NASD and researchers at the University of Massachusetts (UMass) Amherst. Using publicly available data, we learned statistical relational models of broker behavior that provide a ranking of active brokers with respect to their probability of committing a serious securities violation in the near future. The intention is to use this ranking to improve NASD’s assignment of field examinations—brokers who are ranked higher would be more likely to receive additional examinations by NASD staff. This approach limits the effects of false positives as human analysts will further evaluate the brokers identified by the model. NASD currently identifies higher-risk brokers using a set of handcrafted rules. These rules are based on information intrinsic to the brokers such as the number and type of past violations. They do not exploit social, professional, and organizational relationships among brokers even though NASD experts believe this information is central to the task. Indeed, fraud and malfeasance are usually social phenomena, communicated and encouraged by the presence of other individuals who also wish to commit fraud [4]. It is, however, difficult to accurately specify these patterns manually. As such, relational learning methods have the potential to improve current techniques. Our approach to modeling in this domain exploits recent work on learning accurate, interpretable models of relational data [9, 10]. We learned relational probability tree (RPT) models, an extension of probability estimation trees for relational domains [12]. These models have three attractive characteristics. First, they provide a ranking of brokers (with respect to estimated probability of misconduct) rather than the binary classification provided by the handcrafted rules. Second, they are able to represent and reason with the relational context information analysts believe to be important. And third, due to their selectivity and intuitive representation, tree models are usually easily interpretable—a
Categories and Subject Descriptors H.2.8 [Database Management]: Database Applications— Data Mining; I.2.6 [Artificial Intelligence]: Learning
General Terms Algorithms, Design, Experimentation.
Keywords Fraud detection, statistical relational learning, relational probability trees.
Permission to make digital or hard copies of all or part of this work for personal or classroom use is granted without fee provided that copies are not made or distributed for profit or commercial advantage and that copies bear this notice and the full citation on the first page. To copy otherwise, to republish, to post on servers or to redistribute to lists, requires prior specific permission and/or a fee. KDD’05, August 21–24, 2005, Chicago, Illinois, USA. Copyright 2005 ACM 1-59593-135-X/05/0008 ...$5.00.
INTRODUCTION
quality that is often important in order for domain experts to trust, and make regular use of, the models. The learned models were subjected to an extensive evaluation by NASD staff that took over two person weeks of effort. This evaluation showed that the models ranked brokers in a manner consistent with the subjective ratings of experienced examiners. Furthermore, in all performance measures, our models performed as well as or better than the handcrafted rules that are currently in use at NASD. Most notably, our models identified higher-risk brokers not previously detected with the handcrafted rules and combined with the current NASD process to significantly increase the accuracy of predicting higher-risk brokers. In the remainder of this paper, we relate our experience developing statistical relational models for this task. We start with a description of the regulatory mission of NASD and the data used to train the models. We then outline the prediction task and our modeling approach. We continue with an empirical evaluation of the models and conclude with implications and future research directions.
2. 2.1
BACKGROUND NASD’s Regulatory Mission
NASD is the world’s largest private-sector securities regulator. It regulates every firm in the United States that conducts securities business with the public (called brokerdealers), and it is subject to oversight by the U.S. Securities and Exchange Commission (SEC). Established in 1939, NASD has a nationwide staff of more than 2,000, and its regulatory responsibility now includes 5,200 securities firms that operate more than 100,000 branch offices and employ 660,000 individual securities brokers. NASD rules regulate every aspect of the brokerage business for NASD members. NASD responsibilities include examination, licensing, testing and registration; enforcement; market surveillance; rule writing; professional training; dispute resolution; and investor education. NASD examines broker-dealer firms for compliance with NASD rules, Municipal Securities Rulemaking Board rules, and federal securities laws. NASD also disciplines those who fail to comply and in 2004 filed 1,400 enforcement actions, barred or suspended 830 brokers from the securities industry, and collected $104 million in fines. In addition, NASD monitors all trading on the NASDAQ Stock Market, which covers more than 70 million orders, quotes, and trades per day. NASD examines firms both on a periodic basis (called cycle examinations) and also in response to complaints or other reasons (called cause examinations). In 2004, NASD’s Member Regulation Department conducted 2,275 cycle examinations and 5,967 cause examinations, which required more than 500 field examiners as well as headquarters staff. Properly targeted examinations are critical to protecting investors and the integrity of securities markets. Early discovery of securities violations can prevent serious harm, recover fraudulently obtained funds, and lead to swift punishment of perpetrators. It can also prevent future violations through increased regulatory scrutiny. It is critically important for NASD to identify firms and brokers who have a higher probability of committing serious violations in the future because this allows efficient allocation of the limited resources of examiners and other NASD staff. Currently, NASD uses a variety of methods to identify
Disclosure 384,944
Branch 295,455 Institution Location ...
BeginDate EndDate ...
BelongsTo 295,455
Date Type ...
FiledOn 384,944
LocatedAt 1,945,942
Broker 1,245,919
ReportedTo 66,823
WorkedFor 2,820,426
Firm 16,047
RegisteredWith 248,757
Regulator 61 Exchange ...
DBA Location ...
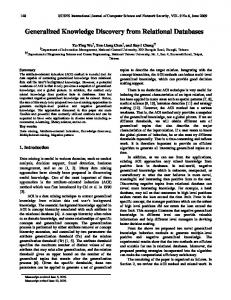
Figure 1: CRD data schema.
higher-risk brokers and firms, particularly highlighting firms and individual brokers who have had regulatory or financial problems in the past. Because of the difficulty of this task, NASD continually seeks methods to both predict violations and assign its examinations more precisely.
2.2
The Central Registration Depository
One key tool for accomplishing NASD’s regulatory misc syssion is its Central Registration Depository (CRD ) tem. CRD was established to aid in the licensing and registration of its broker-dealers and the brokers who work for them. CRD maintains information on all federally registered broker-dealers and brokers for the SEC, NASD, the states, and other federally authorized private sector regulators, such as the New York Stock Exchange. Originally implemented in June 1981, CRD has grown to include data on approximately 3.4 million brokers, 360,000 branches, and 25,000 firms. For firms, CRD information includes data such as ownership and business locations. For individual brokers, CRD includes qualification and employment information. Information in CRD is self-reported by the registered firms and brokers, although incorrect or missing reports can trigger regulatory action by NASD. Figure 1 shows a relational schema for the NASD data, indicating entities and relationships that were used in our analysis. Although the CRD database employs a much more complex schema, Figure 1 provides a guide to the major types of objects and links provided to the relational learning algorithms. The frequency counts in Figure 1 refer to a subset of the CRD used for this analysis, which was restricted to firms and brokers who have had an approved NASD registration. One of the most important categories of data in CRD captures disciplinary information from a number of sources, including state regulators, SEC, NASD, New York Stock Exchange, American Stock Exchange, and FBI, as well as from the registered brokers and the brokerage firms themselves. This disciplinary information, generally referred to as disclosures, includes information on criminal, regulatory, and civil judicial actions; customer complaints; and termination actions. Other disclosure types report financial problems such as bankruptcies, bond denials, and liens. Disclosure information on individual brokers is provided free of charge to the public through NASD’s BrokerCheck system (www.nasdbrokercheck.com). Because one indicator of future problematic behavior is past behavior, NASD uses disclosure counts of individual
brokers from the CRD to assist it in targeting its examinations toward those who are at higher risk to commit future violations.
3.
TASK DESCRIPTION
Our goal was to develop a statistical model to identify which brokers warrant additional attention from NASD examiners. There are two reasons to instigate reviews: (1) to uncover broker violations, and (2) to prevent future violations by increasing supervision on those brokers who are believed to be most likely to commit them. Unfortunately, there is no attribute in the data that records, in retrospect, whether examiners should have reviewed particular brokers. Instead, we use the existence of serious violations as a surrogate measure. To quantify broker misconduct, we used a ranking of disclosure severity provided by NASD experts. We regarded disclosures of type investigation or regulatory-action as “serious violations” and labeled the brokers who have had a serious violation in a given time period as positive examples. In other words, the surrogate measure we used is whether a broker will have an investigation or regulatory-action disclosure in the near future, under the assumption that examiners would have wanted to review these brokers before they committed these actions. We restricted our analysis to small and moderate sized firms with fewer than 15 brokers. These firms account for almost half of the firms under NASD jurisdiction. There were two reasons for this restriction. First, the patterns of behavior differ between small and large firms. Second, large firms typically have more extensive compliance mechanisms in place. Currently, NASD generates a list of higher-risk brokers (HRB) using a set of handcrafted rules they have formed using their domain knowledge and experience. This approach has two weaknesses we aim to address. First, the handcrafted rules simply categorize the brokers as “higherrisk” and “lower-risk” rather than providing a risk-ordered ranking. A ranking would be more useful to examiners as it would allow them to focus their attention on brokers considered to have the highest risk. Second, NASD’s handcrafted rules use only information intrinsic to the brokers. In other words, they do not utilize relational context information such as the conduct of past and current coworkers. NASD experts believe that organizational relationships can play an important role in predicting serious violations. For example, brokers that have had serious violations in the past may influence their coworkers to participate in future schemes. Furthermore, some firms tend to be associated with continuous misconduct (i.e., they do not regulate their own employees and may even encourage violations). Lastly, higher-risk brokers sometimes move from one firm to another collectively, operating in clusters, which heightens the chance of regulatory problems. A model that is able to use relational context information has the potential to capture these types of behavior and provide more accurate predictions.
4.
MODELING APPROACH
NASD’s task of ranking brokers for examination has three characteristics that are common to many knowledge discovery tasks, but that are rarely addressed in combination. Accurate ranking of brokers is inherently probabilistic, relational, and temporal.
Probabilistic — Any attempt to predict the future behavior of brokers is inherently probabilistic. There can be many underlying reasons for a particular pattern of behavior, and CRD data can never fully capture the complex motivations of, and influences on, a particular broker. Instead, the goal of the statistical model is to focus the attention of NASD examiners on brokers whose past behavior indicates that they are at greater risk for particular future behaviors. Probabilistic predictions particularly aid this goal because they facilitate the assessment of both absolute and relative risk. Relational — The majority of the patterns discussed by expert NASD examiners reflect aspects of the social, professional, and institutional networks within which brokers operate. Fraud and malfeasance are usually social phenomena, communicated and encouraged by the presence of other individuals who also wish to commit fraud. Yet the existing methods used by NASD to automatically filter brokers for analysts do little to reflect these networks. Fortunately, recent developments in relational knowledge discovery (e.g., [7, 16]) offer the potential to develop statistical models that incorporate aspects of these networks into predictive models. Temporal — NASD wishes to predict behavior in the relatively near future, so our analysis focused on predicting the probability of at least one serious violation in the next calendar year. Ideally, a model might predict a probability distribution of serious violations across all future years, allowing for more informative reasoning of the type outlined by Fawcett & Provost [5] in their discussion of “activity monitoring.” However, we focused on predicting disclosures in the next year as a reasonable approximation to this task that provided the most immediate value to NASD. All three of these problem characteristics indicate the potential for a statistical relational model to provide better indicators for examiners than a broker’s actual disclosures. Specifically, a relational model can capture dependencies among broker characteristics, past behavior, and future behavior that go beyond what can be captured in simple filtering rules. In addition, it can capture dependencies that go beyond an individual broker to consider the behavior of the broker’s past and present coworkers, branches, and firms. Finally, a statistical relational model might be able to identify and represent complex temporal trends of behavior that suggest particularly high risk for serious violations in the next year, even though past behavior has been relatively benign.
4.1
Relational Probability Trees
We use relational probability trees (RPTs) [12] for this task. RPTs extend probability estimation trees [13] to a relational setting. Due to their selectivity and intuitive representation of knowledge, tree models are often easily interpretable. This makes RPTs an attractive modeling approach for NASD examiners. The RPT learning algorithm adjusts for biases towards particular features due to the unique characteristics of relational data. Specifically, three characteristics—concentrated linkage, degree disparity, and relational autocorrelation—can complicate efforts to construct good statistical models, leading to feature selection bias and discovery of spurious correlations [9, 10].
Target Broker
LocatedAt
Branch
LocatedAt
CoWorker
LocatedAt
FiledOn
LocatedAt
FiledOn
LocatedAt
CoWorker
BelongsTo
Disclosure
CoWorker
Disclosure
CoWorker
Firm
each instance. Bagging is an ensemble method that reduces variance without increasing bias [8]. The bagging procedure involves learning multiple trees, each from a different bootstrapped pseudosample (i.e., sample N instances with replacement from the original sample), and then computing probability estimates by averaging the predictions of the trees on the test set.
RegisteredWith RegisteredWith
5. Regulator
Regulator
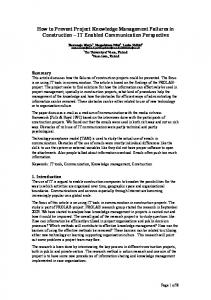
Figure 2: Sample subgraph.
By adjusting for these biases, the RPT algorithm is able to learn relatively compact and parsimonious tree models. RPT models estimate probability distributions over class labels in a manner similar to conventional tree models. However, the learning algorithm looks beyond the attributes of the object for which the class label is defined and considers the effects of attributes in the relational neighborhood of the object being classified. The RPT learning algorithm uses subgraphs as training examples. Each subgraph includes different types of objects (e.g., firms, disclosures), links that represent relationships between these objects (e.g., employment links between a broker and a branch), and attributes on these objects and links. In each subgraph, there is a single target object to be classified; the other objects and links in the subgraph form the target’s relational neighborhood. To classify brokers, we constructed subgraphs around brokers, including information about their current and past employment, and their disclosures (see section 6.1 for more detail). A hypothetical subgraph for this task is shown in Figure 2. The RPT algorithm automatically constructs and searches over aggregated relational features to model the distribution of the class label. For example, to predict the value of an attribute (e.g., broker-has-serious-violation-next-year ) based on the attributes of related objects (e.g., characteristics of the broker’s coworkers), a relational feature may ask whether the average employment length of the coworkers is less than 12 months. The algorithm constructs features from the attributes of different object/link types in the subgraphs using multiple methods of aggregation (mode, average, count, proportion, and degree) to group the values of those attributes. Count, proportion, and degree features consider a number of different thresholds (e.g., proportion > 10%). The algorithm searches for the best binary discretization of continuous attributes for features (e.g., count(disclosure.year > 2004)). For the experiments reported in this paper, we considered 10 thresholds and 10 discretizations per feature. The algorithm uses pre-pruning in the form of a p-value cutoff and a depth cutoff to limit tree size. All experiments reported in this paper used α = 0.2/|attributes| and depth cutoff=7. Given an RPT model learned from a set of training examples, the model can be applied to unseen subgraphs for prediction. The chosen feature tests are applied to each subgraph and the example travels down the tree to a leaf node. The model then uses the probability distribution estimated for that leaf node to make a prediction about the class label of the example. Alternatively, an ensemble of RPT models can be used to improve the probability estimates for
KNOWLEDGE DISCOVERY PROCESS
This work was conducted as a joint project between NASD and the Knowledge Discovery Laboratory at UMass Amherst Department of Computer Science. The project proceeded in two iterations of a four-stage process of task specification, data preparation, data mining, and evaluation (with rough time estimates in parentheses):
5.1
First Iteration
Scoping and task selection (one month) — We discussed the basic needs of NASD and the analysis capabilities of statistical relational data mining tools in a series of conference calls, email communication, and a visit by NASD staff to UMass. We decided to focus on predicting future disclosures of brokers in small firms and jointly developed a dataset specification that identified entities (e.g., brokers, firms, branches, and disclosures), relations (e.g., worked-for), and attributes (e.g., disclosure type, broker qualification). Data preparation (three months) — NASD staff prepared an initial data set in a UMass-supplied format. UMass researchers then imported the data, constructed more than 20 attributes from the supplied data, and produced seven subsets corresponding to individual years. Training sets were then constructed that corresponded to contiguous periods of years (e.g., 19971999). In addition, a class label was constructed that indicated whether a broker had received a disclosure of type: regulatory-action, civil-judicial-action, investigation, criminal, termination-for-cause, or arbitrationaward. Data mining (one month) — UMass researchers constructed relational probability trees (RPTs) for each training set. These RPTs estimated the probability that a broker would have a positive class label in the following year. An additional set of trees was constructed that estimated whether a broker would have such a label for the first time. Evaluation (one month) — UMass researchers evaluated the constructed models using conventional measures such as accuracy, precision, and recall. The models and the evaluation results were presented to a wide selection of NASD staff. While the models met with general approval, a variety of new issues were raised about the class label and the task.
5.2
Second Iteration
Task refinement (two months) — The task specification was criticized by some NASD staff with particular knowledge about examinations and the CRD data. These staff had not been involved in the initial task
selection and pointed out several misinterpretations of the categories of disclosures. Based on the new interpretation, a revised class label was derived, in which brokers with positive labels had at least one of the two most serious categories of disclosures (regulatoryaction or investigation). Data refinement (two months) — In addition to revising the class label, a day-long meeting of UMass researchers and NASD examiners in Boston resulted in suggestions for several new categories of attributes that examiners believed would be predictive of the new class label. These attributes attempted to characterize the movements of groups of brokers from firm to firm and to distinguish “problem” firm environments. Data mining (one month) — Based on the new class label and some additional attributes, new models were constructed. In contrast to previous results, ensembles of RPTs, learned through bagging, outperformed single trees, and bagged ensembles of RPTs became our default model. Evaluation (one month) — As before, the RPTs were analyzed using conventional evaluation metrics such as area under the ROC curve (AUC) and accuracy. However, the trees appeared accurate enough to subject them to a far more extensive evaluation in a more realistic setting. An evaluation protocol was developed jointly with NASD examiners and was then conducted as a double-blind review with four examiners over a one-week period (see Section 6 for details). Also, during this second iteration, it was discovered that an approach (the “higher-risk broker” list) was currently in use at NASD for a very similar task, so the evaluation compared the RPTs to this approach as well. In retrospect, several findings of prior work on the knowledge discovery process [6, 2] were largely borne out. The analysis process of this project followed a sequence quite similar to the ones described in this prior work. In addition, the vast majority of time was spent on task specification, data preparation, and evaluation, rather than on the data mining step.
6.
EMPIRICAL EVALUATION
In this section, we present an empirical evaluation of the claim that RPT models provide a useful ranking of brokers with respect to their likelihood of committing securities violations in the near future. We examine two surrogate measures of misconduct. The first is the class label used to train the RPT models, namely whether any serious disclosures were filed on the target broker. The second is a subjective evaluation of brokers by NASD examiners. Where appropriate, we compare the performance of the RPT models to two baseline models. The first, referred to as Base, is an RPT model learned using the same algorithm, but without the attributes in the relational neighborhood surrounding the target broker. Base models used only the attributes on the target brokers themselves. The second, referred to as HRB, is the binary classification produced by NASD’s higher-risk broker list.
6.1
Methodology
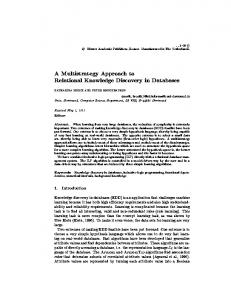
The training and test instances were subgraphs centered on a target broker and included information about the broker’s current and past employment. These subgraphs were extracted from the data using the visual query language QGraph [1]. Queries in this language allow for variation in the number and types of objects and links that form the subgraphs and return collections of all matching subgraphs from a database. Figure 3 shows an example of the type of query used to construct training and test instances. This query is dated December 31, 2000. It returns one subgraph for each broker who, on that date, was working for a firm that employed fewer than 15 brokers. In each subgraph, the relational neighborhood includes the following: (1) any disclosures that have been filed on this broker until the query date, (2) the broker’s current branch (at query date), all coworkers at this branch, the firm this branch belongs to, and the regulators associated with this firm, and (3) the broker’s past branches, past coworkers at those branches, and firms and regulators associated with these past branches. Figure 2 shows a hypothetical match to this query: a broker who has had two disclosures and who has worked at a single branch. To address the temporal nature of the prediction task, we created multiple samples, where each sample was a static view of the dataset at a particular point in time. More specifically, the samples we created reflected a static view of the dataset at the end of the calendar years 1996-2001. For example, the 1996 sample was constructed using the data available on December 31, 1996. The samples include a subgraph for each broker active at that date; the relational neighborhoods of the target brokers reflect what was known about the brokers at that date. The target class label was broker-has-serious-violationnext-year, indicating whether at least one disclosure of type regulatory-action or investigation was filed on the broker within the next calendar year. For example, for the 1996 sample, the target class label was whether the broker had a serious violation during the calendar year 1997. One characteristic of the resulting training samples is that there are few positive instances but many negative instances. Table 1 lists the distribution of positive and negative examples in each sample. On average, only 1% of the examples are positive. To increase the absolute number and distribution of positive instances, and to avoid overfitting to the trends of a single year, we constructed training sets by combining samples from three consecutive years. For example, we merged the samples from 1996, 1997, and 1998 into a single training set. If brokers were active during the entire time interval, they were included as three separate examples, with subgraphs that reflect their relational neighborhood at the end of each year. From these merged samples, we produced 10 pseudosamples for bagging. Each pseudosample was produced using stratified bootstrap resampling (i.e., the positive and the negative examples were separately sampled with replacement from the original sample). The number of positive examples in the pseudosamples was chosen to be the same as in the original sample, but we limited the negative examples to 1500 to increase the overall proportion of positive examples. This also limits the number of times each broker is added to the sample (since brokers are unlikely to have a positive class label for three consecutive years).
Broker
PastLocatedAt
CurrentlyLocatedAt
ObjectType=Branch
ObjectType=Indivdiual
DisclosureFiledOn
Current Branch
Past Branch
BelongsTo
ObjectType=Branch PastBelongsTo
Disclosure AND (ObjectType=Organization, FirmSize