SLEEP DISTURBANCES AND PREDICTION OF WORK DISABILITY http://dx.doi.org/10.5665/sleep.1746
Using Repeated Measures of Sleep Disturbances to Predict Future DiagnosisSpecific Work Disability: A Cohort Study
Paula Salo, PhD1,2; Jussi Vahtera, MD, PhD1,3; Martica Hall, PhD4; Naja Hulvej Rod, PhD5; Marianna Virtanen, PhD1; Jaana Pentti, BSc1; Noora Sjösten, PhD1; Tuula Oksanen, MD, PhD1; Mika Kivimäki, PhD1,6 Finnish Institute of Occupational Health, Helsinki, Finland; 2Department of Psychology, University of Turku, Turku, Finland; 3Department of Public Health, University of Turku and Turku University Hospital, Turku, Finland; 4Department of Psychiatry, University of Pittsburgh School of Medicine, Pittsburgh, Pennsylvania; 5Department of Public Health, University of Copenhagen, Copenhagen, Denmark; 6Department of Epidemiology and Public Health, University College London Medical School, London, United Kingdom
1
Context: It is unknown whether or not measuring sleep disturbances repeatedly, rather than at only one point in time, improves prediction of work disability. Study Objective: To examine sleep disturbance patterns over time as a risk marker for diagnosis-specific work disability. Design: Prospective cohort study linking repeatedly measured self-reported sleep disturbances with records of physician-certified work disability (sickness absence) from a national register. Participants responded to surveys in 2000-2002, and 2004, and were followed up for 12 mo. Setting: Public sector employees in Finland. Participants: 25,639 participants (mean age 45.6 yr, 82% female). Main Outcome Measure: Incident diagnosis-specific sickness absence of > 9 days. Results: During a mean follow-up of 323 days, 4,975 employees (19%) had a new episode of sickness absence. In multivariable-adjusted models corrected for multiple testing, stable severe sleep disturbances, in comparison with no sleep disturbances, were associated with an increased risk of sickness absence due to diseases of the musculoskeletal system (hazard ratio (HR) 1.68, 95% confidence interval (CI) 1.45-1.95), and injuries and poisonings (HR 1.64, 95% CI 1.23-2.18). Increases in sleep disturbances predicted subsequent sickness absence due to mental disorders (HR 1.59, 95% CI 1.32-1.91), and diseases of the musculoskeletal system (HR 1.44, 95% CI 1.27-1.64) According to net reclassification improvement analyses, measurement of sleep disturbance patterns rather than the level of sleep disturbances at one point in time improved prediction of all-cause sickness absence by 14%, and diagnosis-specific sickness absences up to 17% (P for improvement < 0.001). Conclusions: Increasing and severe chronic sleep disturbances mark an increased risk of diagnosis-specific work disability. Keywords: Sleep initiation and maintenance disorders, sick leave, cohort studies Citation: Salo P; Vahtera J; Hall M; Rod NH; Virtanen M; Pentti J; Sjösten N; Oksanen T; Kivimäki M. Using repeated measures of sleep disturbances to predict future diagnosis-specific work disability: a cohort study. SLEEP 2012;35(4):559-569.
INTRODUCTION Complaints of disturbed sleep are common across the life span.1,2 However, emerging evidence suggests that symptoms of disturbed sleep may fluctuate.3 For instance, although it is estimated that only 10% of the population meet the diagnostic criteria for insomnia at any given time, 30%-50% of the general population report occasional symptoms of insomnia, or some degree of sleep disturbances over prolonged periods ranging from several months to years.1,4,5 Increasing evidence suggests that sleep disturbances, such as self-reported insomnia-related symptoms, are linked to various adverse health outcomes. In prospective cohort studies, disturbances in sleep, especially when reported to be persistent, have been associated with an increased risk of poor health and chronic diseases6-10 as well as a higher incidence of mood disorders such as depression and anxiety.4,11 Health may also be indexed as a function of disability.
Growing literature suggests that sleep complaints measured at one point in time are associated with subsequent work disability and inability to work.12-23 In addition, we have recently reported significant associations between a single measure of sleep disturbances and subsequent long-term work disability related to a wide variety of causes, including mental disorders; diseases of the circulatory, musculoskeletal, and nervous systems; and external causes, such as injuries and poisonings.21 However, it remains unclear whether repeated measurements of sleep disturbances, capturing both stable severe disturbances as well as new-onset sleep disturbances, might improve prediction of work disability over and above a single measurement of sleep disturbances. In this prospective, observational cohort study with repeated measures of self-reported sleep disturbances, we examined whether stable sleep disturbances and changes in sleep disturbances were associated with the risk of subsequent sickness absences, including both all-cause and diagnosis-specific sickness absence. We hypothesized that stable sleep disturbances and increasing sleep disturbances would mark a higher risk of diagnosis-specific work disability. In contrast, improved sleep was expected to be an indicator of recovery and hence not associated with an excess risk of work disability. We also hypothesized that measuring sleep disturbances repeatedly, rather than at only one point in time, would improve prediction of work disability.
Submitted for publication May, 2011 Submitted in final revised form September, 2011 Accepted for publication October, 2011 Address correspondence to: Paula Salo, PhD, Unit for Psychosocial Factors, Finnish Institute of Occupational Health, Lemminkäisenkatu 14-18 B, FI-20520 Turku, Finland; Tel: +358 30 474 7553; Fax: +358 30 474 7556; E-mail:
[email protected] SLEEP, Vol. 35, No. 4, 2012
559
Sleep Change and Work Disability—Salo et al
4th Edition (DSM-IV), i.e., the following sleep problems with duration of at least 1 mo: difficulty falling asleep, difficulty maintaining sleep during the night, early morning awakenings, and nonrestorative sleep. Participants reported how frequently they had experienced each of the 4 symptoms during the past 4 weeks (response scale from 1 = never to 6 = every night). The most frequent symptom of those who reported more than 1 symptom was used to assess the degree of sleep disturbances experienced. The severity of sleep disturbances was categorized as one of the following: 0-1 night/wk (no sleep disturbance), 2-4 nights/wk (moderate sleep disturbance), or 5-7 nights/wk (severe sleep disturbance).21 We used the Jenkins Sleep Problem Scale responses from 2 measurements to characterize sleep disturbance patterns over time. Participants were divided into 6 groups: no history of sleep disturbance (no sleep disturbance at either time point), no current sleep disturbance (moderate to severe disturbance at Time 1 to no sleep disturbance at Time 2), decreased sleep disturbance (sleep disturbance decreased from severe at Time 1 to moderate at Time 2), increased sleep disturbance (sleep disturbance increased from none at Time 1 to moderate or severe at Time 2 or from moderate at Time 1 to severe at Time 2), stable moderate sleep disturbance (moderate at Time 1 and Time 2), and stable severe sleep disturbance (severe at Time 1 and Time 2). Internal consistency (Cronbach α) between the items of the Jenkins Sleep Problem Scale was 0.80 at Time 1 and 0.82 at Time 2. The validity of the scale was evaluated in the current data by comparing the scores with recorded use of sleep medication drawn from the Drug Prescription Register upheld by the Social Insurance Institution of Finland and encoded according to the Anatomical Therapeutic Chemical (ATC) classification by the World Health Organization28 (Table 1). We found a graded cross-sectional association between the Jenkins Sleep Problem Scale score at Time 2 and recorded purchases of prescribed hypnotics or sedatives (ATC code N05C) during that survey year: moderate sleep disturbance was associated with 2.97-fold (95% CI 2.40-3.66) and severe sleep disturbance with 6.71-fold (95% CI 5.56-8.10) increased odds of being treated with hypnotic agents or sedatives, compared with no sleep disturbance. A stronger dose-dependent association with sleep medication use was found for participants with a stable moderate (OR 4.02, 95% CI 3.00-5.38) or stable severe sleep disturbance (OR 10.16, 95% CI 7.99-12.91) over the 2 measurements (Table 1). These clinical data support the validity of the Jenkins Sleep Problem Scale as a measure of sleep disturbances in the current cohort.
Table 1—Association between self-reported sleep disturbance and use of sleep medication Prevalence (%)
Risk of sleep medication OR (95% CI)
Sleep disturbance in 2004 None Moderate Severe
1.2 3.4 7.3
1.00 2.97 (2.40-3.66) 6.71 (5.56-8.10)
Sleep disturbance in 2000-2004 No history of sleep disturbance No current sleep disturbance Decreased sleep disturbance Increased sleep disturbance Stable moderate sleep disturbance Stable severe sleep disturbance
1.0 1.8 4.7 4.2 3.7 8.9
1.00 1.88 (1.35-2.64) 5.17 (3.72-7.18) 4.55 (3.57-5.78) 4.02 (3.00-5.38) 10.16 (7.99-12.91)
Sleep disturbance was measured using the Jenkins Sleep Problem Scale, and purchases of prescribed hypnotics or sedatives (Anatomical Therapeutic Chemical classification code N05C) during yr 2004 were obtained from the Drug Prescription Register kept by the Social Insurance Institution of Finland. CI, confidence interval; OR, odds ratio.
METHODS Study Population and Design This study is part of the Finnish Public Sector Study of local government employees in 10 towns and 21 public hospitals in Finland.24 In 2000-2002, 48,598 employees age 17-65 yr responded to the baseline survey regarding health and well-being (Time 1). In 2004 (Time 2), 36,440 employees (75%) were still employed by the target organizations. Follow-up for sickness absences began on January 1, 2005, i.e., after the year of the follow-up survey. A total of 29,180 employees responded to the survey at both time points (response rate 80%). Participants with data at both time points did not substantially differ from the eligible population (n = 48,598) in terms of mean age at Time 1 (44.9 yr in the sample, 44.6 yr in the eligible population), the proportion of women (82.1% versus 80.3%) and manual workers (18.0% versus 19.0%), or the prevalence of sleep disturbances (moderate sleep disturbances, 43.7% versus 43.8%; severe sleep disturbances, 20.9% versus 21.2%). Participants who were on a very long sick leave (≥ 90 days) at the beginning of follow-up or who had retired or died before the beginning of follow-up (n = 706) were excluded from the analysis. Also excluded were those who had incomplete Time 1 data (n = 2,835). Thus, the analytic sample comprised 25,639 government employees (4,650 men; 20,989 women). The study was approved by the ethics committee of the Finnish Institute of Occupational Health.
Sickness Absence Survey responses were linked to diagnosis-specific data on sickness absences lasting more than 9 days, drawn from the national register upheld by the Social Insurance Institution of Finland. Linkage was performed using personal identification numbers. The register data were available until December 31, 2005, and the linkage data were available for all respondents. Finnish residents age 16−67 yr received daily benefits due to medically certified sickness absence. After a qualifying period of the first 9 days after the day of falling ill, compensation is paid for a maximum of 1 yr. All sickness absence periods are
Sleep Disturbances The Jenkins Sleep Problem Scale25 was used to assess selfreported sleep disturbances and was administered at Time 1 and Time 2, on average 3.4 yr apart (range, 731-1,461 days). This scale is widely used in epidemiologic studies11,21,26,27 and its individual items correspond to the insomnia symptoms specified by the Diagnostic and Statistical Manual of Mental Disorders, SLEEP, Vol. 35, No. 4, 2012
560
Sleep Change and Work Disability—Salo et al
medically certified and are recorded in the register with the beginning and end dates. Diagnoses for sickness absences were encoded according to the International Classification of Diseases, 10th Revision (ICD-10). In addition to all-cause sickness absence, we analyzed the following main diagnostic groups: malignant tumors (ICD-10 codes C00-C99); mental disorders (F00-F99); diseases of the nervous system (G00-G99), circulatory system (I00-I99), and musculoskeletal system (M00-M99); and external causes, i.e., injuries and poisonings (S00-T98). A more detailed list of diagnostic categories is provided in Appendix 1.
bance assessments at Time 1 and Time 2 and to better address the possibility of reverse causation. Data on sickness absences (> 9 days) with somatic diagnoses at Time 1 and between Time 1 and Time 2 were drawn from the Social Insurance Institution of Finland, and data on temporary disability pensions with somatic diagnoses from the Finnish Center for Pensions. In addition, data on purchases of reimbursed medication for prevalent hypertension, cardiac failure, ischemic heart disease, diabetes, asthma or other chronic obstructive lung disease, and rheumatoid arthritis were obtained from the Drug Reimbursement Register upheld by the Social Insurance Institution of Finland. Information regarding malignant tumors diagnosed during the 5 yr preceding Time 1 and between Time 1 and Time 2 was obtained from the Finnish Cancer Registry, which covers all diagnosed cancer cases in Finland. Survey data were used to identify self-reported sciatica ever diagnosed by a physician. Purchases of prescribed pain killers drawn from the Drug Prescription Register were used as an indicator of chronic pain. Participants who during the baseline survey year (Time 1) or between Time 1 and Time 2 purchased more than 30 defined daily doses (DDD) of analgesics (ATC code N02) or nonsteroidal antiinflammatory and antirheumatic products (M01A), corresponding to 1- mo use of the medication, were coded as pain killer users. Having at least one of the previously mentioned indicators was coded as “yes” for physical health problems. Mental health was measured from survey responses and national registers and included mental health problems, psychological distress, and anxiety. Participants were coded as positive for mental health problems if they reported a diagnosis of depression, or if during the baseline survey year (Time 1) their national health register records indicated purchases of antidepressant medication (ATC code N06A, > 30 DDDs) or anxiolytic agents (ATC code N05B, at least 1 DDD),28 sickness absence (> 9 days) or temporary disability pension due to mental disorders, compensation for psychotherapy, or hospitalization due to mental disorders. Information on all indicators of mental health problems was updated at the beginning of the follow-up (Time 2) to control for new-onset depression. Having at least one of the previously mentioned indicators was coded as “yes” for mental health problems. Two additional mental health indicators assessed in the Time 1 survey were psychological distress and symptoms of anxiety. Participants were characterized as positive for psychological distress if they endorsed at least 4 items on the 12-item version of the General Health Questionnaire (GHQ).36 The 6-item Trait Anxiety Inventory37 was used to quantify the subjective symptoms of anxiety (continuous outcome).
Baseline Covariates Sociodemographic characteristics were drawn from employers’ records and included age, sex, and occupational status. Occupational status was divided into upper-grade nonmanual workers (e.g., teachers, physicians), lower-grade nonmanual workers (e.g., registered nurses, technicians), and manual workers (e.g., cleaners, maintenance workers) according to the occupational title classification of Statistics Finland.29 Age, sex, and occupational status were considered confounders and sex was further treated as a potential effect modifier. The survey data on work schedules were dichotomized: 0 = day work, 1 = night or shift work. Health behaviors were drawn from the baseline survey at Time 1 and included current smoking (no/yes), alcohol consumption, obesity, and physical activity. Participants reported their average weekly consumption of beer, wine, and spirits in portions that were transformed into grams of pure alcohol. Alcohol intake was classified as ≤ 210 g or > 210 g per wk.30 Body mass index (BMI) was calculated from self-reported height and weight (BMI; kg/m2) and dichotomized to indicate obesity (BMI ≥ 30) or no obesity. Participants also reported the amount of their physical activity and whether it was equal to walking, fast walking, jogging, or running. Low physical activity was classified as ≤ 2 Metabolic Equivalent Task (MET) hr per day (no/yes).31 In the Finnish Public Sector Study, selfreported smoking was a strong predictor of smoking-related deaths32 (HR for current smoker versus former smoker/never smoked 2.89, 95% CI 1.57-5.29, n = 45,626, 44 deaths), and a self-reported alcohol intake of > 210 g per wk a strong predictor of mortality from alcohol-related causes32 (HR for those with high alcohol intake versus low alcohol intake 4.27, 95% CI 2.55 to 7.15, n = 46,763, 72 deaths) among those who responded to the survey in 2000-2002 (follow-up until December 31, 2005, mean duration 4.7 yr, SD 0.7). Although people tend to underestimate their weight and overestimate their height, a strong agreement exists between self-reported and measured BMI (intraclass correlation coefficient 0.97)33 and the measurement of obesity based on self-reported weight and height is reasonably accurate (70% and 82% sensitivity in men and women, respectively; 99% specificity in both sexes).34 Self-reported physical activity has been shown to be moderately associated with objective measures of physical activity, such as accelerometer activity count and pedometer step count.35 Physical health problems were measured from the survey responses and national health records at Time 1 (record data covered the survey year), and the information was updated at Time 2 to control for new-onset diseases between the sleep disturSLEEP, Vol. 35, No. 4, 2012
Statistical Analysis We performed all analyses using SAS statistical software, version 9.2 (SAS Institute, Inc., Cary, North Carolina). Associations between baseline covariates and sleep disturbance histories were analyzed using the chi-square test (categoric baseline variables) or analysis of variance (continuous baseline variables). We used Cox proportional hazard models to examine the association between change in sleep disturbance from Time 1 to Time 2 and sickness absence, and between Time 2 sleep disturbance and sickness absence. Follow-up began on January 1, 2005, after the Time 2 survey, and ended at the first 561
Sleep Change and Work Disability—Salo et al
occurrence of a long-term sickness absence, disability or statutory pension, death, or on December 31, 2005, depending on which came first. We calculated unadjusted HR and 95% CI, and sequentially adjusted multivariate models for age, sex, and occupational status, above listed + night/shift work, health behaviors, physical health problems, mental health problems, psychological distress, and anxiety at baseline Time 1 survey, and above listed + new physical and mental health problems occurring between the Time 1 and Time 2 surveys. An interaction term, sex × sleep disturbances, was entered in the fully adjusted model to examine sex differences. Participants with no history of sleep disturbances were used as the referent group in all analyses. In order to minimize the potential type I error (false positive) arising from multiple testing, we used Bonferroni correction to adjust for multiple comparisons. Given that there were 40 tests in the analyses, including 2 measurements of sleep (5 comparisons per outcome × 8 outcomes: all-cause sickness absence and 7 diagnosis-specific sickness absence categories), a P value lower than 0.00125 was considered statistically significant. To test whether the effect of sleep disturbance histories on sickness absence was independent of baseline health, we conducted a sensitivity analysis with a subcohort of 9,475 participants with no health problems at the beginning of sickness absence follow-up, i.e., those who had no physical or mental health problems at Time 1 or between Time 1 and Time 2, as assessed by the register and survey data; and those who had no diagnosed sleep apnea during the 10 years preceding Time 1 baseline or between Time 1 and Time 2. Sleep apnea cases (codes 3472A in ICD-9 and G47.3 in ICD-10) were identified from the National Hospital Discharge Register, which contains data on all inpatient hospital admissions in Finland and is maintained by the National Institute for Health and Welfare. The primary diagnosis of sleep apnea at discharge is given for patients with abnormalities in the sleep study (i.e., a standard polysomnography or a modified portable sleep apnea test) and typical symptoms of sleep apnea; the 168 cases (0.7%) identified therefore represented severe forms of sleep apnea. Sickness absences due to malignant tumors or diseases of the nervous system were not analyzed because of insufficient statistical power (≤ 50 cases). Finally, we computed net reclassification improvement (NRI) with 95% CI38,39 to assess the extent to which sleep disturbance patterns from 2 sleep measurements (no history of sleep disturbance, no current sleep disturbance, stable moderate sleep disturbance, stable severe sleep disturbance, increasing sleep disturbance, decreasing sleep disturbance) improves prediction of sickness absence among cases and noncases in combination, as compared with a single measurement of sleep disturbances (no sleep disturbance, moderate sleep disturbance, or severe sleep disturbance at Time 2). Because no standard scale is available for categorizing risk levels, we followed the recommendation to compute NRI for continuous predicted risk values.39 Thus, the NRI assessed the extent to which replacing a model of sleep disturbances measured at one point in time with a model of sleep disturbance patterns based on 2 measurements improves or impairs the prediction of sickness absence. To further characterize the difference in predictive ability between these 2 models, we compared predicted risk levels based on SLEEP, Vol. 35, No. 4, 2012
these 2 models separately among participants who were absent due to sickness during the follow-up (the model with a higher predicted risk level in this subgroup has better sensitivity) and among those who were not (the model with a lower predicted risk level in this subgroup has better specificity). We did not use c-statistics to compare the models, because recent studies suggest these indices are not sensitive for detecting differences between models.40,41 RESULTS A total of 9,649 participants (37%) reported no sleep disturbances either at Time 1 or at Time 2, whereas 3,087 (12%) reported improved sleep (no current sleep disturbance) at Time 2. Another 1,287 (5%) reported decreased but moderate sleep disturbances at Time 2 and 24% of the sample (6,081 participants) reported increased sleep disturbances from Time 1 to Time 2. Moderate sleep disturbances at both Time 1 and Time 2 were reported by 2,470 (10%) and severe sleep disturbances at both Time 1 and Time 2 by 3,065 (12%) participants. Stable severe sleep disturbances were more prevalent among women, manual workers, obese participants, and those with high alcohol intake, low physical activity, physical or mental health problems, or psychological distress (Table 2). Participants with stable severe sleep disturbances were also older and reported higher symptoms of anxiety. Sleep Disturbances Measured at One Point in Time During a mean follow-up of 323 days (SD 95, range 2-365) beginning immediately after the Time 2 survey, 4,975 participants (19%) had an incident sickness absence period lasting more than 9 days. As shown in Table 3, when only 1 measure of sleep disturbance (Time 2) was taken into account in the analyses, both moderate (HR 1.21, 95% CI 1.13-1.30) and severe sleep disturbance (HR 1.42, 95% CI 1.32-1.52) were associated with an increased risk of all-cause sickness absence after full adjustments for baseline covariates and health problems. Severe sleep disturbance was associated with an increased risk of sickness absence due to mental disorders (HR 1.52, 95% CI 1.29-1.79), the diseases of the musculoskeletal system (HR 1.57, 95% CI 1.40-1.76), and other causes (HR 1.24, 95% CI 1.09-1.42) after full adjustments. Moderate sleep disturbance was associated with sickness absence due to the diseases of the musculoskeletal system (HR 1.33, 95% CI 1.18-1.49). Sleep Disturbance Patterns Based on Two Measurements Over Time All-cause sickness absence
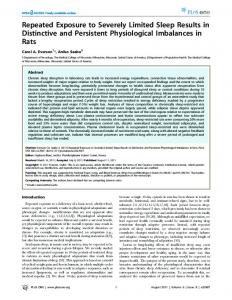
Figure 1 shows crude cumulative hazard function for risk of sickness absence by sleep disturbance pattern. Stable severe sleep disturbances were associated with an increased risk of allcause sickness absence during the entire 1-yr follow-up. The crude HR for stable severe sleep disturbances was 2.08 (95% CI 1.91-2.27) compared with no history of sleep disturbances. This effect was attenuated by 60% to 1.43 (95% CI 1.30-1.57) after full adjustment for baseline covariates and new-onset health problems between Time 1 and Time 2 (Table 4). After full adjustments, the risk of all-cause sickness absence was 1.36 (95% CI 1.26-1.47) for participants with increased sleep disturbances 562
Sleep Change and Work Disability—Salo et al
Table 2—Baseline characteristics Patterns of self-reported sleep disturbances from 2000-2002 to 2004 All n 45.6 (8.2)
No history of sleep disturbance n (%) 44.9 (8.1)
No current sleep disturbance n (%) 44.8 (8.3)
Decreased sleep disturbance n (%) 46.4 (7.8)
Increased Stable Stable sleep moderate sleep severe sleep disturbance disturbance disturbance n (%) n (%) n (%) P value 45.7 (8.3) 45.5 (8.1) 47.8 (7.8) < 0.001
Sex Men Women
4,650 20,989
1,986 (43) 7,663 (37)
550 (12) 2,537 (12)
224 (5) 1,063 (5)
1,006 (21) 5,075 (24)
420 (9) 2,050 (10)
464 (10) 2,601 (12)
Occupational status Higher nonmanual Lower nonmanual Manual
7,231 14,006 4,402
2,732 (38) 5,272 (37) 1,645 (37)
898 (12) 1,679 (12) 510 (12)
396 (5) 662 (5) 229 (5)
1,708 (24) 3,346 (24) 1,027 (23)
688 (10) 1,392 (10) 390 (9)
809 (11) 1,655 (12) 601 (14)
Night/shift work No Yes
17,095 8,544
6,475 (38) 3,174 (37)
2,046 (12) 1,041 (12)
867 (5) 4,202 (5)
4,009 (23) 2,072 (24)
1,618 (10) 852 (10)
2,080 (12) 985 (12)
Smoking No Yes
21,223 4,416
8,014 (38) 1,635 (37)
2,551 (12) 536 (12)
1,054 (5) 233 (5)
5,009 (23) 1,072 (24)
2,060 (10) 410 (10)
2,535 (12) 530 (12)
High alcohol intake (≥ 210 g/wk) No 23,520 Yes 2,119
9,036 (38) 613 (29)
2,823 (12) 264 (13)
1,152 (5) 135 (6)
5,572 (24) 509 (24)
2,211 (9) 259 (12)
2,726 (12) 339 (16)
Obesity (BMI ≥ 30 kg/m2) No Yes
22,823 2,816
8,708 (38) 941 (33)
2,756 (12) 331 (12)
1,129 (5) 158 (5)
5,416 (24) 665 (24)
2,198 (10) 272 (10)
2,616 (11) 449 (16)
Low physical activity (< 2 h/day) No 19,579 Yes 6,060
7,637 (39) 2,012 (33)
2,292 (12) 795 (13)
926 (5) 361 (6)
4,623 (23) 1,458 (24)
1,905 (10) 565 (9)
2,196 (11) 869 (15)
Physical health problems No Yes
16,992 8,647
6,958 (41) 2,691 (31)
2,064 (12) 1,023 (12)
748 (4) 539 (6)
3,987 (24) 2,094 (24)
1,602 (9) 868 (10)
1,633 (10) 1,432 (17)
Mental health problems No Yes
22,506 3,133
9,076 (40) 573 (18)
2,684 (12) 403 (13)
1,016 (5) 271 (9)
5,329 (24) 752 (24)
2,116 (9) 354 (11)
2,285 (10) 780 (25)
Psychologic distress No Yes
19,365 6,274
8,635 (45) 1,014 (16)
2,056 (11) 1,031 (16)
687 (4) 600 (10)
4,745 (24) 1,336 (21)
1,601 (8) 869 (14)
1,641 (8) 1,424 (23)
Anxiety (Mean (SD))
1.9 (0.5)
1.7 (0.4)
2.0 (0.5)
2.2 (0.6)
1.9 (0.5)
2.1 (0.5)
2.3 (0.6)
Age (Mean (SD))
< 0.001
< 0.01
0.28
0.75
< 0.001
< 0.001
< 0.001
< 0.001
< 0.001
< 0.001
< 0.001
SD, standard deviation; BMI, body mass index.
and 1.21 (95% CI 1.09-1.34) for participants with stable moderate sleep disturbances, compared with those with no history of sleep disturbances. Sleep disturbances that decreased from severe to moderate were associated with 1.24 times (95% CI 1.09-1.42) higher hazards after full adjustments. All of these associations remained statistically significant after Bonferroni correction for multiple testing. No increased or decreased risk of all-cause sickness absence was observed among participants who reported improved sleep (no current sleep disturbance) from Time 1 to Time 2. Sex did not moderate the relationship between sleep disturbance patterns and sickness absence (all P values for sex interaction terms > 0.6). SLEEP, Vol. 35, No. 4, 2012
In a sensitivity analysis, excluding participants with health problems before the beginning of follow-up for sickness absence, fully-adjusted models revealed that stable severe sleep disturbances (HR 1.66, 95% CI 1.32-2.09) and increased sleep disturbances (HR 1.28, 95% CI 1.09-1.51) were associated with all-cause sickness absence. Diagnosis-specific sickness absence
The most common subcategories for mental disorders (918 sickness absence cases) were mood disorders (440 cases, 48%, F(30-39)), mainly unipolar depression (425 cases, F(32-33)); and neurotic, stress-related, and somatoform disorders (415 563
Sleep Change and Work Disability—Salo et al
Table 3—Sleep disturbances in 2004 and risk of subsequent work disability (statistically significant associations after all adjustments and correction for multiple testing are highlighted in gray). Risk of disability No. of cases (%)
Crude HR (95% CI)
Model 1 HR (95% CI)
Model 2 HR (95% CI)
1,953 (39) 1,348 (27) 1,674 (34)
1.00 (ref) 1.39 (1.29-1.49) 1.85 (1.73-1.98)
1.00 (ref) 1.38 (1.28-1.47) 1.77 (1.66-1.89)
1.00 (ref) 1.21 (1.13-1.30) 1.42 (1.32-1.52)
69 (45) 46 (30) 39 (25)
1.00 (ref) 1.30 (0.90-1.89) 1.14 (0.77-1.69)
1.00 (ref) 1.22 (0.84-1.78) 0.99 (0.67-1.47)
1.00 (ref) 1.24 (0.84-1.81) 1.00 (0.66-1.52)
295 (32) 260 (28) 363 (40)
1.00 (ref) 1.73 (1.47-2.05) 2.53 (2.17-2.95)
1.00 (ref) 1.71 (1.45-2.03) 2.48 (2.13-2.90)
1.00 (ref) 1.29 (1.09-1.53) 1.52 (1.29-1.79)
78 (35) 63 (29) 79 (36)
1.00 (ref) 1.58 (1.13-2.20) 2.05 (1.50-2.80)
1.00 (ref) 1.54 (1.11-2.15) 1.88 (1.37-2.58)
1.00 (ref) 1.38 (0.98-1.94) 1.50 (1.07-2.09)
Diseases of the circulatory system (309 cases) None Moderate Severe
143 (46) 78 (25) 88 (29)
1.00 (ref) 1.06 (0.81-1.40) 1.24 (0.95-1.62)
1.00 (ref) 1.04 (0.79-1.37) 1.14 (0.87-1.49)
1.00 (ref) 0.99 (0.75-1.32) 1.04 (0.78-1.38)
Diseases of the musculoskeletal system (1,880 cases) None Moderate Severe
675 (36) 517 (27) 688 (37)
1.00 (ref) 1.51 (1.35-1.70) 2.12 (1.91-2.36)
1.00 (ref) 1.49 (1.33-1.67) 1.93 (1.73-2.15)
1.00 (ref) 1.33 (1.18-1.49) 1.57 (1.40-1.76)
Injuries and poisonings (524 cases) None Moderate Severe
224 (43) 128 (24) 172 (33)
1.00 (ref) 1.12 (0.90-1.39) 1.56 (1.28-1.90)
1.00 (ref) 1.12 (0.90-1.40) 1.54 (1.26-1.88)
1.00 (ref) 1.04 (0.83-1.30) 1.36 (1.10-1.68)
Other causes (1,406 cases) None Moderate Severe
605 (43) 369 (26) 432 (31)
1.00 (ref) 1.19 (1.05-1.36) 1.46 (1.29-1.65)
1.00 (ref) 1.19 (1.05-1.36) 1.46 (1.29-1.65)
1.00 (ref) 1.09 (0.95-1.24) 1.24 (1.09-1.42)
Sleep disturbance in 2004 All causes (4,975 cases) None Moderate Severe Malignancies (154 cases) None Moderate Severe Mental disorders (918 cases) None Moderate Severe Diseases of the nervous system (220 cases) None Moderate Severe
The study sample included 25,639 participants (4,975 sickness absence cases), of which 12,736 reported no sleep disturbances in 2004, 6,544 reported moderate sleep disturbances, and 6,359 reported severe sleep disturbances. Hazard ratios (HR) and their 95% confidence limits (CI) were derived from Cox proportional hazard models. P values for sex interaction 0.36-0.92. Model 1 adjusted for age, sex, and occupational status. Model 2: Model 1 + night/shift work, smoking, alcohol intake, body mass index, physical activity, psychological distress, anxiety, and physical and mental health in 2000-2002, and physical and mental health between the sleep measurements. Ref, reference category.
cases, 45%, F(40-F48)), mainly reaction to severe stress; and adjustment disorders (313 cases, F(43)). For the diseases of the musculoskeletal system (1,880 cases), the most common categories were dorsopathies (677 cases, 36%, M(40-54)), softtissue disorders (663 cases, 35%, M(60-79)), and arthropathies (517, 28%, M(00-25)). The injuries and poisonings category (524 cases) consisted mainly of injuries to the extremities, especially the knee and lower leg (155 cases, 30%, S(80-89)) or to the ankle and foot (96 cases, 18%, S(90-99)) (Appendix 1). In crude diagnosis-specific models, stable severe sleep disturbances from Time 1 to Time 2 were associated with sickness absence due to mental disorders, diseases of the musculoskeletal system, injuries and poisonings, and other causes, but not SLEEP, Vol. 35, No. 4, 2012
with malignancies or diseases of the nervous system or circulatory system (Table 4). After Bonferroni correction, the risk of sickness absence due to diseases of the musculoskeletal system (HR 1.68, 95% CI 1.45-1.95) and injuries and poisonings (HR 1.64, 95% CI 1.23-2.18) remained statistically significant. Stable moderate sleep disturbances were associated with an increased risk of sickness absence due to diseases of the musculoskeletal system after full adjustments, but not after Bonferroni correction for multiple testing. Increased sleep disturbances predicted sickness absence due to mental disorders, diseases of the musculoskeletal system, injuries and poisonings, and other causes, after full adjustments (Table 4). However, only the risk of sickness absence 564
Sleep Change and Work Disability—Salo et al
Cumulative hazard (%)
due to mental disorders (HR 30 1.59, 95% CI 1.32-1.91) and Stable severe sleep disturbance the diseases of the muscu25 Increased sleep disturbance loskeletal system (HR 1.44, Decreased sleep disturbance 95% CI 1.27-1.64) remained Stable moderate sleep disturbance 20 statistically significant after No current sleep disturbance Bonferroni correction. Sleep 15 No history of sleep disturbance disturbances that decreased from severe to moderate were 10 associated with sickness absence due to diseases of the 5 musculoskeletal system (HR 1.47, 95% CI 1.20-1.81) af0 ter Bonferroni correction. No 0.00 0.25 0.50 0.75 1.00 statistically significant interTime (years) action of sex and sleep disturNo. at risk bance patterns was found for 9649 9390 8950 8637 8237 No history of sleep disturbance any of the diagnosis-specific 3087 2986 2838 2687 2548 No current sleep disturbance sickness absence categories 1287 1233 1142 1077 1002 Decreased sleep disturbance (all P values > 0.2). 6081 5809 5401 5058 4708 Increased sleep disturbance Results from the main anal2470 2400 2238 2123 1966 Stable moderate sleep disturbance ysis were largely replicated in 3065 2891 2635 2424 2193 Stable severe sleep disturbance a sensitivity analysis excluding participants with mental Figure 1—Patterns of self-reported sleep disturbances from 2000-2002 to 2004, and risk of all-cause sickness or somatic health problems absence. Crude cumulative hazard rates for risk of sickness absence among participants with no history of sleep disturbance, no current sleep disturbance, decreased sleep disturbance, stable moderate sleep disturbance, before the beginning of folincreased sleep disturbance, and stable severe sleep disturbance, as estimated by Kaplan-Meier survival analysis. low-up. Stable severe sleep disturbances were associated with an increased risk of sickness absence due to mental disorders (HR 1.96, 95% CI 1.11and decreased the predicted risk level for noncases of sickness 3.47), diseases of the musculoskeletal system (HR 2.41, 95% absence due to mental disorder, musculoskeletal disorder, and CI 1.60-3.62), and injuries and poisonings (HR 2.08, 95% CI injuries and poisonings (11.3% to 21.3% specificity gain). 1.12-3.88) after full adjustments. Increased sleep disturbances predicted sickness absences due to diseases of the musculoskDISCUSSION eletal system (HR 1.52, 95% CI 1.11-2.08) in the fully adjusted In this prospective cohort study of more than 25,000 pubmodels, whereas association with mental disorders (HR 1.32, lic sector employees, we showed that the use of repeated mea95% CI 0.87-2.02) or injuries and poisonings (HR 1.46, 95% sures of self-reported sleep disturbances improves prediction CI 0.93-2.29) failed to reach statistical significance. Again, no of work disability risk (assessed by sickness absence records) statistically significant interaction of sex and sleep disturbance over and above a single measurement of sleep disturbances. We patterns was found for any of the diagnosis-specific sickness found that all-cause sickness absence was predicted by stable absence categories (all P values > 0.38). sleep disturbances as well as changes in sleep, but no excess or reduced risk was observed among participants recovering Comparison of Prediction Based on One Versus Two from sleep disturbances. Participants with stable severe sleep Measurements of Sleep Disturbances disturbances were at increased risk of physician-certified sickWe used the NRI formula to assess whether sleep disturness absence due to diseases of the musculoskeletal system or bance patterns measured at Time 1 and Time 2 were a stronger injuries and poisonings, whereas increase in sleep disturbances predictor of sickness absence than sleep disturbances measured predicted sickness absence due to mental disorders and diseases at Time 2 only (Table 5). Information from 2 measurements of the musculoskeletal system. These associations remained afof sleep disturbance improved the risk prediction of all-cause ter Bonferroni correction for multiple testing and controlling sickness absence by 13.7% (95% CI 10.6-16.8) compared with for measurements of physical and mental health problems bea single sleep measurement. Two measurements of sleep disturfore follow-up. bance also significantly improved the risk prediction of sickness Our findings are important because they demonstrate the poabsence due to mental disorders (17.1%, 95% CI 10.6-23.7), tential predictive utility of repeated measurement of sleep disdiseases of the musculoskeletal system (14.6%, 95% CI 9.9turbances for identifying persons at an increased risk of work 19.3), and injuries and poisonings (16.3%, 95% CI 7.6-24.9). disability. We found that compared with a single measurement A stratified analysis by status of sickness absence at follow-up of sleep disturbances, assessment of sleep disturbance patterns showed that a model based on 2 measurements accurately inover time more accurately assigned those who developed discreased the predicted risk level for those who were on sickness ability to a higher-risk status, demonstrating sensitivity gain. In absence due to any cause at follow-up (10.1% sensitivity gain) relation to diagnosis-specific work disability, sleep disturbance SLEEP, Vol. 35, No. 4, 2012
565
Sleep Change and Work Disability—Salo et al
patterns, while not adding to sensitivity, improved specificity by assigning those who did not develop disability during follow-up to a lower-risk status.
Our findings on a dose-response association between sleep disturbances and disease risk are consistent with previous studies based on a single measurement of sleep disturbances and
Table 4—History of self-reported sleep disturbances based on measurements in 2000-2002 and 2004, and risk of subsequent work disability (statistically significant associations after all adjustments and correction for multiple testing are highlighted in gray) Risk of disability No. of cases (%)
Crude HR (95% CI)
Model 1 HR (95% CI)
Model 2 HR (95% CI)
Model 3 HR (95% CI)
1,418 (29) 535 (11) 289 (6) 1,367 (27) 510 (10) 856 (17)
1.00 (ref) 1.20 (1.09-1.33) 1.61 (1.42-1.82) 1.61 (1.50-1.74) 1.45 (1.31-1.60) 2.08 (1.91-2.27)
1.00 (ref) 1.20 (1.09-1.32) 1.59 (1.40-1.80) 1.58 (1.47-1.71) 1.43 (1.29-1.58) 1.96 (1.80-2.14)
1.00 (ref) 1.09 (0.99-1.21) 1.32 (1.16-1.50) 1.46 (1.36-1.58) 1.28 (1.15-1.42) 1.55 (1.41-1.70)
1.00 (ref) 1.07 (0.96-1.18) 1.24 (1.09-1.42) 1.36 (1.26-1.47) 1.21 (1.09-1.34) 1.43 (1.30-1.57)
Malignancies (154 cases) No history of sleep disturbance No current sleep disturbance Decreased sleep disturbance Increased sleep disturbance Stable moderate sleep disturbance Stable severe sleep disturbance
57 (37) 12 (8) 6 (4) 40 (26) 18 (12) 21 (13)
1.00 (ref) 0.66 (0.35-1.23) 0.79 (0.34-1.83) 1.12 (0.75-1.67) 1.23 (0.73-2.10) 1.17 (0.71-1.93)
1.00 (ref) 0.65 (0.35-1.21) 0.72 (0.31-1.67) 1.04 (0.69-1.56) 1.15 (0.68-1.96) 0.97 (0.59-1.61)
1.00 (ref) 0.68 (0.36-1.27) 0.77 (0.32-1.81) 1.06 (0.70-1.60) 1.21 (0.70-2.08) 1.04 (0.61-1.79)
1.00 (ref) 0.67 (0.36-1.26) 0.74 (0.31-1.76) 1.02 (0.68-1.55) 1.18 (0.68-2.03) 1.01 (0.58-1.73)
Mental disorders (918 cases) No history of sleep disturbance No current sleep disturbance Decreased sleep disturbance Increased sleep disturbance Stable moderate sleep disturbance Stable severe sleep disturbance
202 (22) 93 (10) 66 (7) 288 (31) 90 (10) 179 (20)
1.00 (ref) 1.45 (1.13-1.85) 2.50 (1.90-3.30) 2.30 (1.92-2.76) 1.76 (1.37-2.25) 2.87 (2.35-3.51)
1.00 (ref) 1.43 (1.12-1.83) 2.49 (1.89-3.29) 2.26 (1.89-2.71) 1.72 (1.35-2.21) 2.81 (2.29-3.44)
1.00 (ref) 1.10 (0.85-1.41) 1.54 (1.16-2.07) 1.85 (1.54-2.23) 1.28 (0.99-1.65) 1.58 (1.27-1.98)
1.00 (ref) 1.05 (0.82-1.35) 1.37 (1.02-1.83) 1.59 (1.32-1.91) 1.15 (0.89-1.49) 1.34 (1.07-1.67)
62 (28) 16 (7) 11 (5) 59 (27) 29 (13) 43 (20)
1.00 (ref) 0.81 (0.47-1.40) 1.33 (0.70-2.53) 1.52 (1.06-2.17) 1.83 (1.18-2.85) 2.21 (1.50-3.27)
1.00 (ref) 0.80 (0.46-1.39) 1.29 (0.68-2.44) 1.45 (1.02-2.08) 1.78 (1.15-2.77) 1.98 (1.34-2.94)
1.00 (ref) 0.76 (0.43-1.32) 1.12 (0.58-2.17) 1.35 (0.94-1.94) 1.67 (1.06-2.63) 1.61 (1.05-2.47)
1.00 (ref) 0.73 (0.42-1.27) 1.04 (0.54-2.01) 1.23 (0.86-1.78) 1.57 (0.99-2.47) 1.46 (0.95-2.24)
Diseases of the circulatory system (309 cases) No history of sleep disturbance No current sleep disturbance Decreased sleep disturbance Increased sleep disturbance Stable moderate sleep disturbance Stable severe sleep disturbance
104 (34) 39 (13) 20 (6) 74 (24) 27 (9) 45 (14)
1.00 (ref) 1.17 (0.81-1.70) 1.45 (0.90-2.34) 1.13 (0.84-1.53) 1.02 (0.67-1.55) 1.38 (0.97-1.96)
1.00 (ref) 1.18 (0.82-1.71) 1.37 (0.85-2.22) 1.10 (0.81-1.48) 0.99 (0.65-1.52) 1.38 (0.97-1.96)
1.00 (ref) 1.13 (0.78-1.65) 1.26 (0.77-2.08) 1.06 (0.78-1.43) 0.96 (0.62-1.48) 1.12 (0.77-1.64)
1.00 (ref) 1.13 (0.77-1.64) 1.24 (0.75-2.04) 1.04 (0.77-1.41) 0.94 (0.61-1.46) 1.10 (0.75-1.61)
Diseases of the musculoskeletal system (1880 cases) No history of sleep disturbance No current sleep disturbance Decreased sleep disturbance Increased sleep disturbance Stable moderate sleep disturbance Stable severe sleep disturbance
491 (26) 184 (10) 121 (6) 522 (28) 193 (10) 369 (20)
1.00 (ref) 1.18 (1.00-1.40) 1.89 (1.55-2.31) 1.73 (1.53-1.96) 1.56 (1.32-1.84) 2.48 (2.17-2.84)
1.00 (ref) 1.19 (1.00-1.40) 1.83 (1.50-2.23) 1.67 (1.48-1.89) 1.53 (1.29-1.80) 2.19 (1.91-2.51)
1.00 (ref) 1.12 (0.94-1.33) 1.59 (1.30-1.96) 1.56 (1.38-1.77) 1.43 (1.20-1.69) 1.83 (1.58-2.13)
1.00 (ref) 1.08 (0.91-1.28) 1.47 (1.20-1.81) 1.44 (1.27-1.64) 1.34 (1.13-1.59) 1.68 (1.45-1.95)
Sleep history All causes (4,975 cases) No history of sleep disturbance No current sleep disturbance Decreased sleep disturbance Increased sleep disturbance Stable moderate sleep disturbance Stable severe sleep disturbance
Diseases of the nervous system (220 cases) No history of sleep disturbance No current sleep disturbance Decreased sleep disturbance Increased sleep disturbance Stable moderate sleep disturbance Stable severe sleep disturbance
The study sample included 25,639 participants (4,975 sickness absence cases), of which 9,649 reported no history of sleep disturbance, 3,087 no current sleep disturbance, 1,287 decreased sleep disturbance, 6,081 increased sleep disturbance, 2,470 stable moderate, and 3,065 stable severe sleep disturbance. Hazard ratios (HR) and their 95% confidence limits (CI) were derived from Cox proportional hazard models. P values for sex interaction 0.21-0.92. Model 1 adjusted for age, sex, and occupational status. Model 2: Model 1 + night/shift work, smoking, alcohol intake, body mass index, physical activity, psychological distress, anxiety, and physical and mental health at baseline. Model 3: Model 2 + physical and mental health between the sleep measurements. Ref, reference category. Table 4 continues on the following page SLEEP, Vol. 35, No. 4, 2012
566
Sleep Change and Work Disability—Salo et al
risk of all-cause work disability.12,14-18 In addition, we have previously reported that sleep disturbances at one time point were subsequently associated with an increased risk of very
long (≥ 90 days) work disability due to mental disorders, diseases of the circulatory, musculoskeletal, and nervous system, and injuries and poisonings.21 With the current data, however,
Table 4 (continued)—History of self-reported sleep disturbances based on measurements in 2000-2002 and 2004, and risk of subsequent work disability (statistically significant associations after all adjustments and correction for multiple testing are highlighted in gray) Risk of disability Sleep history Injuries and poisonings (524 cases) No history of sleep disturbance No current sleep disturbance Decreased sleep disturbance Increased sleep disturbance Stable moderate sleep disturbance Stable severe sleep disturbance Other causes (1,406 cases) No history of sleep disturbance No current sleep disturbance Decreased sleep disturbance Increased sleep disturbance Stable moderate sleep disturbance Stable severe sleep disturbance
No. of cases (%)
Crude HR (95% CI)
Model 1 HR (95% CI)
Model 2 HR (95% CI)
Model 3 HR (95% CI)
154 (30) 70 (13) 16 (3) 138 (26) 53 (10) 93 (18)
1.00 (ref) 1.43 (1.08-1.89) 0.78 (0.47-1.30) 1.43 (1.14-1.80) 1.35 (0.99-1.84) 1.94 (1.50-2.51)
1.00 (ref) 1.44 (1.08-1.91) 0.79 (0.47-1.31) 1.44 (1.14-1.81) 1.36 (0.99-1.85) 1.91 (1.47-2.47)
1.00 (ref) 1.38 (1.03-1.84) 0.71 (0.42-1.21) 1.37 (1.09-1.73) 1.28 (0.93-1.76) 1.71 (1.29-2.27)
1.00 (ref) 1.36 (1.02-1.81) 0.69 (0.41-1.17) 1.32 (1.04-1.67) 1.24 (0.90-1.71) 1.64 (1.23-2.18)
443 (31) 162 (12) 76 (5) 374 (27) 139 (10) 212 (15)
1.00 (ref) 1.15 (0.96-1.37) 1.30 (1.02-1.66) 1.36 (1.18-1.56) 1.23 (1.02-1.49) 1.54 (1.31-1.82)
1.00 (ref) 1.14 (0.95-1.36) 1.31 (1.03-1.68) 1.35 (1.18-1.55) 1.22 (1.01-1.48) 1.55 (1.32-1.83)
1.00 (ref) 1.05 (0.87-1.26) 1.12 (0.87-1.44) 1.26 (1.10-1.45) 1.11 (0.91-1.35) 1.28 (1.07-1.53)
1.00 (ref) 1.03 (0.86-1.24) 1.08 (0.84-1.39) 1.21 (1.05-1.39) 1.07 (0.88-1.31) 1.22 (1.02-1.46)
The study sample included 25,639 participants (4,975 sickness absence cases), of which 9,649 reported no history of sleep disturbance, 3,087 no current sleep disturbance, 1,287 decreased sleep disturbance, 6,081 increased sleep disturbance, 2,470 stable moderate, and 3,065 stable severe sleep disturbance. Hazard ratios (HR) and their 95% confidence limits (CI) were derived from Cox proportional hazard models. P values for sex interaction 0.21-0.92. Model 1 adjusted for age, sex, and occupational status. Model 2: Model 1 + night/shift work, smoking, alcohol intake, body mass index, physical activity, psychological distress, anxiety, and physical and mental health at baseline. Model 3: Model 2 + physical and mental health between the sleep measurements. Ref, reference category.
Table 5—Reclassification of predicted all-cause and diagnosis-specific disability riska, using 2 sleep measurements (2000/2002 and 2004, model 2)b versus 1 sleep measurement (2004, model 1)c Reclassificationd Cause of disability All causes Cases (n = 4,975) Noncases (n = 20,664) NRI (95% CI)e
Upwards
Downwards
Net correctly reclassified (%)
P value
2739 9957
2236 10707
10.1 3.6 13.7 (10.6-16.8)
< 0.0001
Mental disorder Cases (n = 918) Noncases (n = 24,721) NRI (95% CI)
442 9784
476 14937
-3.7 20.8 17.1 (10.6-23.7)
< 0.0001
Musculoskeletal disorder Cases (n = 1,880) Noncases (n = 23,759) NRI (95% CI)
877 9349
1003 14410
-6.7 21.3 14.6 (9.9-19.3)
< 0.0001
Injuries and poisonings Cases (n = 524) Noncases (n = 25,115) NRI (95% CI)
275 11134
249 13981
5.0 11.3 16.3 (7.6-24.9)
< 0.001
a
Disability after 2004, mean follow-up 323 days. bSleep categories based on measurements in 2000 and 2004 are “no history of sleep disturbance,” “no current sleep disturbance,” “decreased sleep disturbance,” “increased sleep disturbance,” “stable moderate sleep disturbance,” “stable severe sleep disturbance.” c Sleep categories based on one measurement (2004) are “no sleep disturbance,” “moderate sleep disturbance,” and “severe sleep disturbance.” dA higher predicted risk among cases (i.e., increased sensitivity) and a lower predicted risk among non-cases (i.e., increased specificity) indicate improvement in prediction. eNet reclassification improvement indicates the extent to which a model with 2 sleep measurements improves prediction among cases and noncases in combination, compared with a model with only 1 sleep measurement. CI, confidence interval; NRI, net reclassification improvement. a
SLEEP, Vol. 35, No. 4, 2012
567
Sleep Change and Work Disability—Salo et al
we were able to illustrate that although stable and increasing sleep disturbances do predict subsequent sickness absence due to several reasons, transient sleep disturbances do not. For the 2 most prevalent disease categories, i.e., mental disorders and the diseases of the musculoskeletal system, associations between sleep disturbances and subsequent sickness absence were particularly influenced by preexisting health problems (associations attenuated by 35%-78% for mental disorders and 23%-44% for diseases of the musculoskeletal system) and, to a lesser extent, by emerging health problems between the 2 sleep measurements (mental disorders 31%-50%, musculoskeletal 18%-33%). Importantly, all the observed adverse associations between sleep disturbance patterns and sickness absence due to the diseases of musculoskeletal system remained statistically significant after these extensive adjustments, and Bonferroni correction for multiple comparisons. Furthermore, the results were mainly replicated in a sensitivity analysis excluding participants with any indicator of physical or mental health problems. Therefore, it seems that, in addition to being a symptom of many conditions,42 sleep disturbances can precede the onset of a clinically significant manifest disease. Our results regarding mental disorders are consistent with the hypothesis that sleep disturbances may be a prodromal symptom of a disabling mental disorder, because increase in sleep disturbances was found to be a more powerful predictor of psychiatric sickness absence than stable and severe sleep disturbance. In the very healthy subsample, however, the role of stable severe sleep disturbance was emphasized. Whether or not sleep disturbances are the cause of an illness or an early marker of an undiagnosed or subclinical disease cannot be determined from these observational data, and further research is thus needed. Our study has notable strengths, tempered by some limitations. To our knowledge, this is the first study on work disability to examine the predictive utility of repeat measurement of sleep disturbances by using the net reclassification improvement, a formula that has been extensively used in relation to cardiovascular disease prediction.43-45 Our study also benefitted from a large sample size, which enabled the analysis of diagnosis-specific sickness absences in groups with different temporal patterns of sleep disturbances. Furthermore, we culled objective data on sickness absence from an independent national register that reliably covers all sickness absences lasting more than 9 days with physician-certified diagnoses, and were thus able to minimize potential bias due to self-reporting. Excluding shorter absences is unlikely to cause major bias because it has previously been shown that longer-term sickness absences rather than short absence spells are associated with more severe and chronic health outcomes, such as those leading to permanent work disability46 or death.32,47,48 Using both survey and register data, we performed extensive adjustments, including physical and mental health problems at baseline and new-onset problems between the sleep measurements. However, the association between sleep disturbance patterns and sickness absence may still be confounded by unobserved or imprecisely measured variables. For example, self-reported data on health behaviors may imprecisely define obesity, smoking habits, and alcohol consumption, despite their strong associations with objective indicators of these behaviors.33-35 Because of incomplete adjustment for illness, we SLEEP, Vol. 35, No. 4, 2012
cannot exclude the possibility of reverse causation (i.e., sleep disturbances may be a consequence rather than an antecedent of disease). We sought to reduce this limitation through sensitivity analyses, which revealed that the results were mainly replicated in a very healthy subsample of participants. Other drawbacks include the limited generalizability of our findings, as the study population exclusively comprised predominantly female (82%), racially homogeneous (white) Finnish public sector employees. In conclusion, in this large prospective cohort of Finnish public sector employees, we were able show that the use of repeated measurements of sleep disturbances may improve prediction of all-cause and diagnosis-specific work disability, as indicated by sickness absence lasting more than 9 days. Additional studies are needed to examine whether interventions designed to reduce sleep disturbances would alter the risk of work disability. ACKNOWLEDGMENTS This study was supported by the Academy of Finland (projects 124271, 124322, 129262, and 132944) and the participating organizations. Dr. Kivimäki is supported by the NIH/ National Institute on Aging (R01AG034454) and the National Heart, Lung, and Blood Institute (R01HL036310), USA; the BUPA Foundation, UK; and the New OSH ERA research programme. Dr. Hulvej Rod is supported by the Danish Medical Research Council [grant no. 271-06-0687]. The sponsors had no role in the design or conduct of the study; collection, management, analysis, or interpretation of the data; or preparation, review, or approval of the manuscript. DISCLOSURE STATEMENT This was not an industry supported study. Dr. Salo has financial interest in a small private sleep clinic in Turku, Finland. The sleep clinic had no involvement in this study. The other authors have indicated no financial conflicts of interest. REFERENCES
1. Ohayon MM. Epidemiology of insomnia: what we know and what we still need to learn. Sleep Med Rev 2002;6:97-111. 2. Colten HR, Altevogt BM, eds. Sleep Disorders and Sleep Deprivation: An Unmet Public Health Problem. Institute of Medicine (US) Committee on Sleep Medicine and Research, Washington, DC, National Academies Press, 2006. 3. Buysse DJ, Cheng Y, Germain A, et al. Night-to-night sleep variability in older adults with and without chronic insomnia. Sleep Med 2010;11:56-64. 4. Neckelmann D, Mykletun A, Dahl AA. Chronic insomnia as a risk factor for developing anxiety and depression. Sleep 2007;30:873-80. 5. Kronholm E, Partonen T, Laatikainen T, et al. Trends in self-reported sleep duration and insomnia-related symptoms in Finland from 1972 to 2005: a comparative review and re-analysis of Finnish population samples. J Sleep Res 2008;17:54-62. 6. Verbaan D, van Rooden SM, Visser M, Marinus J, van Hilten JJ. Nighttime sleep problems and daytime sleepiness in Parkinson’s disease. Mov Disord 2008;23:35-41. 7. Elwood P, Hack M, Pickering J, Hughes J, Gallacher J. Sleep disturbance, stroke, and heart disease events: evidence from the Caerphilly cohort. J Epidemiol Community Health 2006;60:69-73. 8. Mallon L, Broman JE, Hetta J. Sleep complaints predict coronary artery disease mortality in males: a 12-year follow-up study of a middle-aged Swedish population. J Intern Med 2002;251:207-16. 9. Phillips B, Mannino DM. Do insomnia complaints cause hypertension or cardiovascular disease? J Clin Sleep Med 2007;3:489-94.
568
Sleep Change and Work Disability—Salo et al
31. Kujala UM, Kaprio J, Sarna S, Koskenvuo M. Relationship of leisuretime physical activity and mortality: the Finnish Twin Cohort. JAMA 1998;279:440-4. 32. Vahtera J, Pentti J, Kivimäki M. Sickness absence as a predictor of mortality among male and female employees. J Epidemiol Community Health 2004;58:321-6. 33. Bes-Rastrollo M, Sabaté J, Jaceldo-Siegl K, Fraser GE. Validation of selfreported anthropometrics in the Adventist Health Study 2. BMC Public Health 2011;11:213. 34. Nyholm M, Gullberg B, Merlo J, Lundqvist-Persson C, Råstam L, Lindblad U. The validity of obesity based on self-reported weight and height: implications for population studies. Obesity 2007;15:197-206. 35. Harris TJ, Owen CG, Victor CR, Adams R, Ekelund U, Cook DG. A comparison of questionnaire, accelerometer, and pedometer: measures in older people. Med Sci Sports Exerc 2009;41:1392-402. 36. Holi MM, Marttunen M, Aalberg V. Comparison of the GHQ-36, the GHQ-12 and the SCL-90 as psychiatric screening instruments in the Finnish population. Nord J Psychiatry 2003;57:233-8. 37. Spielberger CD, Gorsuch RL, Lushene R, Vagg PR, Jacobs GA. Manual for the State-Trait Anxiety Inventory (form Y). Palo Alto, CA, Consulting Psychologists Press Inc, 1983. 38. Pencina MJ, D’Agostino RB Sr, D’Agostino RB Jr, Vasan RS. Evaluating the added predictive ability of a new marker: from area under the ROC curve to reclassification and beyond. Stat Med 2008; 27:157-172. 39. Pencina MJ, D’Agostino RB Sr, Steyerberg EW. Extensions of net reclassification improvement calculations to measure usefulness of new biomarkers. Stat Med 2011;30:11-21. 40. Harrell FE Jr, Lee KL, Mark DB. Multivariable prognostic models: issues in developing models, evaluating assumptions and adequacy, and measuring and reducing errors. Stat Med 1996;15:361-87. 41. Cook NR. Assessing the incremental role of novel and emerging risk factors. Curr Cardiovasc Risk Rep 2010;4:112-19. 42. Zammit GK. The prevalence, morbidities, and treatments of insomnia. CNS Neurol Disord Drug Targets 2007;6:3-16. 43. Polonsky TS, McClelland RL, Jorgensen NW, et al. Coronary artery calcium score and risk classification for coronary heart disease prediction. JAMA 2010;303:1610-6. 44. Woodward M, Brindle P, Tunstall-Pedoe H, SIGN Group on Risk Estimation. Adding social deprivation and family history to cardiovascular risk assessment: the ASSIGN score from the Scottish Heart Health Extended Cohort (SHHEC). Heart 2007;93:172-6. 45. Kivimäki M, Batty GD, Hamer M, et al. Using additional information on working hours to predict coronary heart disease: a cohort study. Ann Intern Med 2011;154:457-63. 46. Kivimäki M, Forma P, Wikström J, et al. Sickness absence as a risk marker of future disability pension: the 10-town study. J Epidemiol Community Health 2004;58:710-1. 47. Kivimäki M, Head J, Ferrie JE, Shipley MJ, Vahtera J, Marmot MG. Sickness absence as a global measure of health: evidence from mortality in the Whitehall II prospective cohort study. BMJ 2003;327:364. 48. Head J, Ferrie JE, Alexanderson K, Westerlund H, Vahtera J, Kivimäki M. Diagnosis-specific sickness absence as a predictor of mortality in the Whitehall II prospective cohort study. BMJ 2008;337:a1469.
10. Vgontzas AN, Liao D, Bixler EO, Chrousos GP, Vela-Bueno A. Insomnia with objective short sleep duration is associated with a high risk for hypertension. Sleep 2009;32:491-7. 11. Morphy H, Dunn KM, Lewis M, Boardman HF, Croft PR. Epidemiology of insomnia: a longitudinal study in a UK population. Sleep 2007;30:274-80. 12. Overland S, Glozier N, Sivertsen B, et al. A comparison of insomnia and depression as predictors of disability pension: the HUNT Study. Sleep 2008;31:875-80. 13. Sivertsen B, Overland S, Neckelmann D, et al. The long-term effect of insomnia on work disability: the HUNT-2 historical cohort study. Am J Epidemiol 2006;163:1018-24. 14. Eriksen W, Natvig B, Bruusgaard D. Sleep problems: a predictor of long-term work disability? A four-year prospective study. Scand J Public Health 2001;29:23-31. 15. Åkerstedt T, Kecklund G, Alfredsson L, Selen J. Predicting long-term sickness absence from sleep and fatigue. J Sleep Res 2007;16:341-5. 16. Westerlund H, Alexanderson K, Åkerstedt T, Magnusson Hanson L, Theorell T, Kivimaki M. Work-related sleep disturbances and sickness absence in the Swedish working population, 1993-1999. Sleep 2008;31:1169-77. 17. Ihlebaek C, Brage S, Eriksen HR. Health complaints and sickness absence in Norway, 1996-2003. Occup Med (Lond) 2007;57:43-9. 18. Sivertsen B, Overland S, Bjorvatn B, Maeland JG, Mykletun A. Does insomnia predict sick leave? The Hordaland Health Study. J Psychosom Res 2009;66:67-74. 19. Sivertsen B, Overland S, Pallesen S, et al. Insomnia and long sleep duration are risk factors for later work disability. The Hordaland Health Study. J Sleep Res 2009;18:122-8. 20. Grandner MA, Patel NP, Gehrman PR, et al. Who gets the best sleep? Ethnic and socioeconomic factors related to sleep complaints. Sleep Med 2010;11:470-8. 21. Salo P, Oksanen T, Sivertsen B, et al. Sleep disturbances as a predictor of cause-specific work disability and delayed return to work. Sleep 2010;33:1323-31. 22. Linton SJ, Bryngelsson I. Insomnia and its relationship to work and health in a working-age population. J Occup Rehabil 2000;10:169-83. 23. Daley M, Morin CM, Leblanc M, Grégoire JP, Savard J, Baillargeon L. Insomnia and its relationship to health-care utilization, work absenteeism, productivity and accidents. Sleep Med 2009;10:427-38. 24. Sjösten N, Vahtera J, Salo P, et al. Increased risk of lost workdays prior to the diagnosis of sleep apnea. Chest 2009;136:130-6. 25. Jenkins CD, Stanton BA, Niemcryk SJ, Rose RM. A scale for the estimation of sleep problems in clinical research. J Clin Epidemiol 1988;41:313-21. 26. Vahtera J, Kivimäki M, Hublin C, et al. Liability to anxiety and severe life events as predictors of new-onset sleep disturbances. Sleep 2007;30:1537-46. 27. Vahtera J, Pentti J, Helenius H, Kivimäki M. Sleep disturbances as a predictor of long-term increase in sickness absence among employees after family death or illness. Sleep 2006;29:673-82. 28. WHO Collaborating Centre for Drug Statistics Methodology. Guidelines for ATC Classification and DDD Assignment. Oslo, Norway, World Health Organization Collaborating Centre for Drug Statistics, 2004. 29. Statistics Finland. Classification of occupations. Helsinki, Finland, 2001. 30. Rimm EB, Williams P, Fosher K, Criqui M, Stampfer MJ. Moderate alcohol intake and lower risk of coronary heart disease: meta-analysis of effects on lipids and haemostatic factors. BMJ 1999;319:1523-8.
SLEEP, Vol. 35, No. 4, 2012
569
Sleep Change and Work Disability—Salo et al
Appendix 1—Disease categories of the work disability cases (sickness absence longer than nine days) among the Finnish public sector employees Work disability cases n
ICD-10 Code ICD-10 Category label C00-C97 C00-C75 C76-C80 C81-C96 C97
Malignant neoplasms Malignant neoplasms, stated or presumed to be primary, of specified sites, except of lymphoid, hematopoietic and related tissue Malignant neoplasms of ill-defined, secondary and unspecified sites Malignant neoplasms, stated or presumed to be primary, of lymphoid, hematopoietic and related tissue Malignant neoplasms of independent (primary) multiple sites
154 144 1 9 0
F00-F99 F00-F09 F10-F19 F20-F29 F30-F39 F40-F48 F50-F59 F60-F69 F70-F79 F80-F89 F90-F98 F99
Mental and behavioral disorders Organic, including symptomatic, mental disorders Mental and behavioral disorders due to psychoactive substance use Schizophrenia, schizotypal and delusional disorders Mood (affective) disorders Neurotic, stress-related and somatoform disorders Behavioral syndromes associated with physiologic disturbances and physical factors Disorders of adult personality and behavior Mental retardation Disorders of psychologic development Behavioral and emotional disorders with onset usually occurring in childhood and adolescence Unspecified mental disorder
918 0 4 9 440 415 48 1 1 0 0 0
G00-G99 G00-G09 G10-G13 G20-G26 G30-G32 G35-G37 G40-G47 G50-G59 G60-G64 G70-G73 G80-G83 G90-G99
Diseases of the nervous system Inflammatory diseases of the central nervous system Systemic atrophies primarily affecting the central nervous system Extrapyramidal and movement disorders Other degenerative diseases of the nervous system Demyelinating diseases of the central nervous system Episodic and paroxysmal disorders Nerve, nerve root and plexus disorders Polyneuropathies and other disorders of the peripheral nervous system Diseases of myoneural junction and muscle Cerebral palsy and other paralytic syndromes Other disorders of the nervous system
220 0 0 9 0 10 72 127 0 0 1 1
I00-I99 I00-I02 I05-I09 I10-I15 I20-I25 I26-I28 I30-I52 I60-I69 I70-I79 I80-I89 I95-I99
Diseases of the circulatory system Acute rheumatic fever Chronic rheumatic heart diseases Hypertensive diseases Ischemic heart diseases Pulmonary heart disease and diseases of pulmonary circulation Other forms of heart disease Cerebrovascular diseases Diseases of arteries, arterioles and capillaries Diseases of veins, lymphatic vessels and lymph nodes, not elsewhere classified Other and unspecified disorders of the circulatory system
309 1 0 40 29 7 34 18 3 176 1
M00-M99 M00-M25 M30-M36 M40-M54 M60-M79 M80-M94 M95-M99
Diseases of the musculoskeletal system Arthropathies Systemic connective tissue disorders Dorsopathies Soft tissue disorders Osteopathies and chondropathies Other disorders of the musculoskeletal system and connective tissue
1880 517 14 677 663 9 0 Appendix 1 continues on the following page
SLEEP, Vol. 35, No. 4, 2012
569A
Sleep Change and Work Disability—Salo et al
Appendix 1 (continued)—Disease categories of the work disability cases (sickness absence longer than nine days) among the Finnish public sector employees Work disability cases n
ICD-10 Code ICD-10 Category label S00-T98 S00-S09 S10-S19 S20-S29 S30-S39 S40-S49 S50-S59 S60-S69 S70-S79 S80-S89 S90-S99 T00-T07 T08-T14 T15-T19 T20-T32 T33-T35 T36-T50 T51-T65 T66-T78 T79 T80-T88 T90-T98
Injuries and poisonings Injuries to the head Injuries to the neck Injuries to the thorax Injuries to the abdomen, lower back, lumbar spine and pelvis Injuries to the shoulder and upper arm Injuries to the elbow and forearm Injuries to the wrist and hand Injuries to the hip and thigh Injuries to the knee and lower leg Injuries to the ankle and foot Injuries involving multiple body regions Injuries to unspecified part of trunk, limb or body region Effects of foreign body entering through natural orifice Burns and corrosions Frostbite Poisoning by drugs, medicaments and biologic substances Toxic effects of substances chiefly nonmedicinal as to source Other unspecified effects of external causes Certain early complications of trauma Complications of surgical and medical care, not elsewhere classified Sequelae of injuries, of poisoning and of other consequences of external causes
A00-B99 D50-D89 E00-E90 H00-H59 H60-H95 J00-J99 K00-K93 L00-L99 N00-N99 O00-O99 P00-P96 Q00-Q99 R00-R99 V01-Y98 Z00-Z99
Other causes Certain infectious and parasitic diseases Diseases of the blood and blood-forming organs and certain disorders involving the immune mechanism Endocrine, nutritional and metabolic diseases Diseases of the eye and adnexa Diseases of the ear and mastoid process Diseases of the respiratory system Diseases of the digestive system Diseases of the skin and subcutaneous tissue Diseases of the genitourinary system Pregnancy, childbirth and the puerperium Certain conditions originating in the perinatal period Congenital malformations, deformations and chromosomal abnormalities Symptoms, signs and abnormal clinical and laboratory findings, not elsewhere classified External causes of morbidity and mortality Factors influencing health status and contact with health services
SLEEP, Vol. 35, No. 4, 2012
569B
524 18 1 26 20 57 56 68 6 155 96 0 1 0 7 0 0 0 1 1 8 3 1406 56 142 37 77 26 317 211 61 164 127 4 7 139 0 38
Sleep Change and Work Disability—Salo et al