As ex- pected, the LP-residual of relatively intelligible speech has a much higher kurtosis value (e.g., for M14) than se- verely impaired speech (e.g., for F03).
USING ACOUSTIC MEASURES TO PREDICT AUTOMATIC SPEECH RECOGNITION PERFORMANCE FOR DYSARTHRIC SPEAKERS Kinfe T. Mengistu1, Frank Rudzicz1, Tiago H. Falk2
1
Department of Computer Science, University of Toronto, Toronto, Canada 2 Institute National de la Recherche Scientifique, Montreal, Canada
Abstract: There is growing evidence that clinicians are becoming more receptive to automated computerized tools that assist in treatment decisions and outcomes. Automatic speech recognition (ASR), for example, has had some degree of success as an assistive technology (AT) tool for individuals with mild or moderate dysarthria. Notwithstanding, for a large percentage of individuals with more severe levels of the disorder, ASR has yet to achieve acceptable levels. In this paper, we explore the use of several acoustic measures as correlates of ASR performance for dysarthric speakers. By automatically predicting the potential efficacy of ASR for a particular dysarthric speaker, health care costs and waiting lists may be reduced as may device abandonment rates. Experiments with the “Universal Access” database of dysarthric speech suggest that some of the proposed measures achieve correlations as high as 0.86 with ASR accuracy. I. INTRODUCTION Speech is an efficient modality of communication in human-to-human interaction and can also serve as a highcapacity medium in human-machine interaction. However, millions of individuals have severe motor impairments that make speech communication extremely difficult, or even impossible [3]. These neuro-motor impairments, collectively known as dysarthria, are characterized by uncoordinated and imprecise articulation, and atypical breathing, voicing, and prosody that result in a highly distorted and unintelligible speech. Dysarthria is often accompanied by other physical handicaps that inhibit other forms of physical activity making the use of one’s voice highly desirable. Recent advances in the automatic recognition of dysarthric speech have demonstrated that many individuals with speech disorders can be reasonably understood with specialized recognition software [4]. However, there remain many individuals with dysarthria for whom automatic speech recognition (ASR) remains insufficient, and for whom alternative forms of assistive technology (AT) need to be prescribed. Being able to accurately predict the success of ASR by automatically analyzing a patient’s speech signal would significantly expedite the AT prescription process, whilst also reducing device abandonment rates. This paper describes a number of acoustic measures which have been used in the past to objectively characterize the quality and intelligibility of both healthy [1] and dysarthric speech [2]. The goal is to explore the usefulness of each parameter as a correlate of ASR performance. It is known
that dysarthria affects articulation, breathing, voicing, and prosody, often resulting in unintelligible speech. Therefore, we consider acoustic features that characterize the atypical vocal tract shape, vocal source excitation, temporal dynamics, and prosody characteristics of dysarthric speakers. More specifically, we explore the use of internal features computed by the speech quality measurement algorithm ITU-T Rec. P.563, standardized by the International Telecommunications Union (ITU) [1]. While the algorithm has not been optimized for dysarthric speech, some of its internal features may be useful for this task as they measure parameters related to atypical vocal tract shapes as well as atypical linear prediction coefficient (LPC) distributions. Moreover, we explore the use of novel acoustic parameters proposed recently for the purpose of objective intelligibility prediction of spastic dysarthric speech [2]. These new parameters characterize atypical vocal source excitation, disordered temporal dynamics, and disrupted prosody, factors which are prominent in dysarthria. Here, we provide a brief description of the innovative features; the interested reader is referred to [2] for further details. Experiments with a publicly-available speech database show the acoustic measures investigated here as strong correlates of ASR performance on dysarthric speech. Such findings suggest that these measures can be used to predict the potential efficacy of ASR for disordered speakers, thus helping clinicians to better prescribe AT. II. METHODS A. Data Description For computing the acoustic measures, we use a subset of dysarthric speech from the publicly available Universal Access (UA) Speech database from the University of Illinois at Urbana-Champaign. These data consist of singleword utterances recorded from 9 speakers (2 female) with spastic dysarthria recorded with a seven-channel microphone array, sampled at 16 kHz and digitized with 16-bit precision. Since the ITU-T P.563 standard requires single-channel narrowband (i.e., 8 kHz sampled) speech data, we further downsample the UA-database and use data from the sixth channel in the microphone array. This microphone was selected as it was placed closer to the participant and had a higher signal-to-noise ratio. Each participant read 455 unique isolated words with some repetition totaling 765 utterances per participant. The prompts consisted of repetitions of English digits, the 26-word international radio alphabet, 19 word-processing commands, and the most common 100 words in the Brown corpus of written English. Each of these is repeat-
ed three times by each participant. In addition, 300 uncommon words selected from children's novels digitized by Project Gutenberg are also included [5]. B. Automatic Speech Recognition (ASR) Baseline ASR performance is evaluated using speaker-independent (SI) acoustic models trained via the leaveone-out method where data from all speakers except the test speaker are used for training. The trained model is then evaluated on data from the test speaker. Each SI model is trained on an average of over 8000 dysarthric utterances. The acoustic feature vectors consist of 13 Melfrequency cepstral coefficients (MFCCs) including the 0 th -order cepstral coefficient and their respective Δ and ΔΔ coefficients, giving 39 dimensions generated every 10 ms. Cepstral mean subtraction (CMS) is then applied. Acoustic models consist of 40 left-to-right, tri-state monophone hidden Markov models and a single-state short-pause model where state observation likelihoods are modeled by mixtures of 16 Gaussians. In each case, monophones are strung together into word networks according to the CMU pronunciation dictionary. A wordnetwork where every word is preceded and followed by a silence model is used as a language model/task grammar. During decoding, a modified Viterbi algorithm is used to select the most probable word. All ASR accuracy results are reported in terms of word accuracy. C. Acoustic Measures A number of salient acoustic measures have been previously shown to characterize the quality of natural speech [1] and the intelligibility of dysarthric speech [2]. Below, a brief description of the measures are given; the interested reader is referred to [1,2] for more details.
We also consider five alternate acoustic parameters which were recently shown to correlate with subjective intelligibility ratings of spastic dysarthric speakers. The measures are based on three so-called intelligibility dimensions, namely atypical vocal source excitation, perturbation in speech temporal dynamics, and prosodic disruptions, as described below. C.2. Vocal source excitation and vocal tract information Linear prediction analysis has been widely used in speech applications to separate vocal source excitation and vocal tract information from the produced speech signal. Linear prediction analysis assumes that the current signal sample can be predicted by a linear combination of p previous samples. Under this format, the linear prediction error (or LP residual) will correspond to the vocal source excitation signal [6]. It is known that for healthy voiced speech segments, glottal pulses will appear as impulse-like peaks in the LP-residual signal, thus rendering the LP-residual distribution with a higher kurtosis [7]. On the other hand, severely dysarthric speech exhibits more prominent noise-like excitation signals (due to vocal harshness, for example), thus lowering the kurtosis value of the LP-residual distribution [2]. For mild to moderate dysarthric speech, it is expected that the kurtosis of the LP-residual distribution will lie between that of a Gaussian and that of healthy natural speech. For the sake of completeness, the LP-residual kurtosis metric κ is computed according to: N
N ∑ r n −r 4 κ LP =
n=1 N
−3 ,
∑ r n −r
2 2
C.1 ITU-T P.563 Algorithm The ITU-T P.563 standard algorithm [1] was developed for narrowband telephone speech. As such, it detects and characterizes three major classes of telephone speech distortions, namely, background noise (both additive and multiplicative), temporal distortions (mute, clippings, interruptions) and unnaturalness (robotization and unnatural male and female speech). While the first two classes do not directly relate to dysarthric speech, we hypothesize that internal features computed by the algorithm and used to detect and characterize “unnatural speech distortions” may be useful for the task at hand. More specifically, the algorithm makes use of speech statistics for unnatural voice detection, such as higher-order statistical evaluation (kurtosis and skewness) of cepstral and linear prediction analyses. These are classical measures of the degree to which a statistical signal deviates from the Gaussian distribution. Kurtosis measures the ‘peakedness’ of a distribution and skewness measures the asymmetry of a distribution. Linear prediction analysis of order 21 is performed and kurtosis and skewness measures are computed for active speech.
n=1
where r indicates the sample average of the LP-residual signal r(n) and N is the number of active speech frames. C.3 Disturbances in temporal dynamics Both short- and long-term temporal dynamics measures are explored to investigate the effects of temporal disturbances of spastic dysarthric speech on ASR performance. Speech temporal disturbances are mainly due to improper placement of the articulators, slower speech rate, and rhythmic disturbances [8]. Here, a log-energy rate of change measure is used to characterize the short-term temporal dynamics of the speech signal. More specifically, the zeroth-order cepstral coefficient c0 is computed as a measure of short-term log-spectral energy and the zero th-order delta coefficient Δc0 is used as a measure of rate of change of log-energy [9]. In our simulations, c0 is computed over 32 ms frames with 10 ms frame shifts and Δc0 is computed using a window of size 7. Statistics of the Δc0 distribution are used to characterize disturbances in short-term (~100 ms) temporal dynamics. More specifically, the skewness computed from
C samples of Δc0 distribution (represented by xi in the equation below) is used: C
C ∑ x i − x 3 S Δ=
i= 1
,
C
∑ x i − x
2 3/2
i= 1
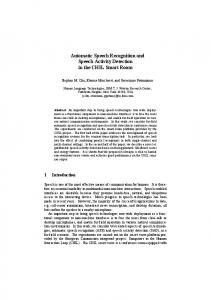
where x indicates the sample average of xi. Long-term temporal dynamics information, in turn, is characterized by the rate of change of long-term (between 512 and 1000 ms) speech temporal envelopes. Such representation is often termed “modulation spectrum” and characterizes slow energy fluctuations associated with the movement of the lips, the jaw, and other speech articulators. Most of the useful linguistic information is in modulation frequency components between 1 and 16 Hz, with spectral peaks around 4 Hz [11]. In [2] it was hypothesized that prolonged phonemes, slower speech rates, and impaired co-articulation would cause a shift of the modulation frequencies to below 4 Hz. With more intelligible speech, the modulation frequency would spread across higher modulation frequencies as observed with natural speech [12]. The ratio of modulation spectral energy at modulation frequencies less than 4 Hz to modulation frequencies greater than 4 Hz was used to measure longterm temporal dynamics [2]. This parameter, termed lowto-high modulation energy ratio (LHMR) in [2], takes into account temporal disturbances of irregular speech, namely prolonged phonemes, slower speech rates, and impaired co-articulation of dysarthric speech. In order to emulate psychoacoustic precepts, an auditory-inspired modulation spectral representation is used where a 23channel gammatone filterbank was used to emulate the processing of the cochlea and an 8-channel modulation filterbank was used to aggregate modulation frequencies into eight bands [12]. A complete detail of the signal processing steps involved in the computation of the LHMR measure can be found in [2]. C.4 Disordered prosody Prosodic disturbances are one of the distinguishing factors of dysarthria and we explore how these correlate with ASR performance. Here, the range and variance of the fundamental frequency (F0) [14] are used as acoustic parameters that characterize disordered prosody. Pitch estimates are computed using the robust adaptive pitch tracker algorithm [15]. III. EXPERIMENTAL RESULTS AND DISCUSSION Table 1 shows the correlation coefficients attained between the investigated acoustic measures and ASR percentage accuracy over all speakers. As can be seen, the acoustic features that characterize atypical vocal source excitation and unnaturalness of speech are highly corre-
lated with ASR performance on dysarthric speech. The LP-residual and LPC kurtosis, along with LPC skewness show strong positive correlations with ASR performance, with coefficients ρ ranging between 0.81 and 0.86. As expected, the LP-residual of relatively intelligible speech has a much higher kurtosis value (e.g., for M14) than severely impaired speech (e.g., for F03). By contrast, the short- and long-term temporal perturbation measures, namely SΔ and LHMR, show more modest correlations with ASR performance, achieving a coefficient of 0.62. Moreover, the range and variance of the fundamental frequency (F0), which are used to measure prosodic disturbances, are shown to be strongly negatively correlated with ASR performance. Dysarthric speech is commonly considered monotone and “robotic,” thus it would be reasonable to expect lower pitch variability and range in more severe cases of dysarthria (and consequently, lower ASR accuracy). The negative correlations, however, suggest otherwise. While these findings may seem counterintuitive, they corroborate those reported in [14] where the nature of prosodic disturbances was shown to vary with the severity of dysarthria. In particular, monotonicity was reported for mild dysarthric speakers only and higher pitch variation/range was observed for speakers with severe disorders. IV. CONCLUSIONS AND FUTURE WORK This work has demonstrated that the investigated acoustic measures can be indicative of the performance achieved with traditional isolated-word recognition systems. In particular, acoustic measures related to atypical vocal source excitation and unnaturalness were highly correlated with ASR performance. As such, these measures can be used to assist clinicians in assessing the potential utility of ASR systems for particular dysarthric patients. For example, if LPC analysis of a patient’s speech indicates LP coefficients with a high kurtosis, ASR systems are more likely to work as intended. In the future, a composite measure consisting of a weighted linear combination of these acoustic measures might further improve the predictive ability of this approach. Moreover, we are interested in further analysis of the relationships between specific motor disablements, spectral characteristics, and ASR performance. For example, prior research showed Pearson correlation coefficients of up to 0.95 between tongue motion and F2 formants for sonorants uttered by dysarthric speakers [4]. V. ACKNOWLEDGEMENTS This research project was funded by the Natural Sciences and Engineering Research Council of Canada and the University of Toronto. The authors thank Mark Hasegawa-Johnson for sharing the UA-Speech database.
Table 1. Correlation ρ between investigated acoustic measures and ASR accuracy for 9 dysarthric speakers. SΔ Speaker ID ASR LPLPC LPC LHMR F0-Range F0% Residual Kurtosis Skewness Variance Accuracy Kurtosis F03
7.99
0.19
0.47
0.07
0.08
8.60
144.51
38.06
F05
34.80
1.22
4.32
0.48
0.44
5.04
121.23
36.37
M01
7.11
0.56
1.38
0.15
0.59
6.81
148.04
32.18
M04
3.39
0.36
1.21
0.18
0.31
6.86
122.96
30.56
M05
35.91
0.77
1.93
0.35
0.94
5.07
54.9
11.51
M07
21.41
0.38
1.30
0.14
0.44
9.20
116.79
28.96
M08
61.94
0.98
4.51
0.81
0.93
5.91
73.97
18.81
M14
50.49
1.29
5.49
0.93
0.57
4.80
27.29
6.43
M16
33.39
0.80
1.73
0.14
0.23
6.46
129.55
30.34
0.81
0.84
0.86
0.62
-0.62
-0.76
-0.67
ρ coefficient
REFERENCES [1] ITU-T P.563, 2004. Single-ended method for objective speech quality assessment in narrow-band telephony applications. [2] Falk, T., Chan, W.-Y., Shein, F., 2011. Characterization of atypical vocal source excitation, temporal dynamics and prosody for machine measurement of dysarthric speech intelligibility. Speech Communication, in press. [3] Selouani, S-A., Yakoub, M.S., O’Shaughnessy, D., 2009. Alternative speech communication system for persons with severe speech disorders. EURASIP Journal on Advances in Signal Processing, Vol. 2009. [4] Rudzicz, F., 2011. Production knowledge in the recognition of dysarthric speech. PhD thesis, University of Toronto. [5] Kim, H., Hasegawa-Johnson, M., Perlman, A., Gunderson, J., Huang, T., Watkin, K., Frame, S., 2008. Dysarthric speech database for universal access research. Proceedings of INTERSPEECH 2008. [6] Deller Jr., J. R., Proakis, J. G., and Hansen, J. H. L., 1993. Discrete-Time Processing of Speech Signals. New York: MacMillan. [7] Gillespie, B., Malvar, H., Florencio, D., 2001. Speech dereverberation via maximum-kurtosis sub-band adaptive filtering. Proceedings of the IEEE International Conference on Acoustics, Speech, and Signal Processing, pages 3701—3704. [8] Duffy, J. R., 2005. Motor speech disorders. Substrates, differential diagnosis, and management (2nd ed.) . Mosby, St. Louis.
[9] Huang, X., Acero, A., Hon, H.-W., 2001. Spoken Language Processing: A Guide to Theory, Algorithm, and System Development. Prentice-Hall, New Jersey. [10] Picone, J., 1993. Signal modeling techniques in speech recognition. Proceedings of the IEEE Vol. 81, No. 9, pages 1215—1247. [11] N. Kanedera, N., Arai, T., Hermansky, H., Pavel, M., 1997. On the importance of various modulation frequencies for speech recognition. Proceedings of Eurospeech ’97, pages 1079—1082. [12] Drullman, R., Festen, J. , Plomp, R., 1994. Effect of reducing slow temporal modulations on speech reception. The Journal of the Acoustical Society of America, Vol. 95, No. 5, pages 2670—2680. [13] Dau, T., Puschel, D., Kohlrausch, A., 1996. A quantitative model of the effective signal processing in the auditory system. I – model structure. Journal of the Acoustical Society of America, Vol. 99, No. 6, pages 3615—3622. [14] Schlenck, K., Bettrich, R., Willmes, K., 1993. Aspects of disturbed prosody in dysarthria. Clinical Linguistics & Phonetics, Vol. 7, No. 2, pages 119 —128. [15] Talkin, D., 1995. A robust algorithm for pitch tracking (RAPT), in Speech Coding and Synthesis (W. B. Kleijn and K. K. Paliwal, eds.), pages 495— 518, Elsevier Science Publishers, Amsterdam.