Digital Object Identifier: 10.1109/ULTSYM.2008.0010
Using resolution enhancement compression to reduce variance of scatterer size estimates from ultrasonic backscattered signals Jose R. Sanchez, Darren Pocci, and Michael L. Oelze Department of Electrical and Computer Engineering University of Illinois at Urbana-Champaign Urbana,IL, 61801 Email:
[email protected]
estimates and the size of the ROI [2]. Furthermore, one of the most important factors reducing the effectiveness of QUS imaging techniques is the low contrast resolution between diseased tissues and normal tissues or between benign and malignant tumors. The contrast resolution of QUS images depends on the variance of QUS estimates. The variance of QUS estimates decreases with increasing bandwidth of the imaging system [3]. Therefore, an imaging system with higher bandwidth would yield lower variance in spectral estimates. In this work, a coded excitation and pulse compression technique, known as resolution enhancement compression (REC) [4], will be used to improve the bias and variance of ASD estimates. The REC technique increases the bandwidth of the ultrasonic imaging system without the presence of large sidelobes often observed with coding and pulse compression techniques. In addition to the bandwidth enhancement, the REC technique has the typical coded excitation benefits, such as deeper penetration which is due to increases in the echo signal-to-noise ratio (eSNR). Furthermore, a larger eSNR translates into a larger usable bandwidth of the imaging system. Usable bandwidth is defined as the segment of the backscattered power spectrum that is 6 dB above the noise floor. Chaturvedi and Insana [5] observed that the variance in scatterer property estimates was inversely proportional to the bandwidth of the imaging system. Therefore, the goal of this study was to combine the REC technique with QUS, which will be described as REC-QUS, and evaluate the improvements in variance of ASD estimates due to the enhanced bandwidth and gain in eSNR. Another goal was to extend the tradeoff of estimate variance and the spatial resolution of the parametric image (ROI size). Both a broadening of the bandwidth and gain in eSNR should yield improved QUS estimates, which in turn will improve the diagnostic capabilities of QUS imaging techniques for clinical applications.
Abstract—Quantitative ultrasound (QUS) imaging techniques based on ultrasonic backscatter have been used successfully to diagnose and monitor disease. A method for improving the contrast and axial resolution of QUS parametric images by using the resolution enhancement compression (REC) technique is proposed. REC is a coded excitation and pulse compression technique that improves the axial resolution and enhances the -6dB bandwidth of an ultrasonic imaging system. In this study, the improvements in variance of average scatterer diameter (ASD) estimates by using REC-QUS were quantified. Furthermore, RECQUS was used to extend the tradeoff between estimate variance and the spatial resolution of QUS parametric imaging using ASD estimates. Simulations and experimental measurements were conducted with a single-element transducer (f/4) having a center frequency of 10 MHz and a -6-dB bandwidth of 80%. Using REC, the -6-dB bandwidth was enhanced to 155%. In simulations, to monitor the improvements in contrast a software phantom with a cylindrical lesion was evaluated. In experimental measurements, a tissue mimicking phantom that contained glass spheres with different scatterer diameters was evaluated. Estimates of ASD in the simulations and experiments were obtained by comparing the normalized backscattered power spectra to theory. Improvements in REC-QUS over conventional QUS were quantified through estimate bias and variance, contrast-to-noise ratio and histogram analysis of QUS parametric images. Overall, a 51% increase in contrast and an 80% decrease in the variance of ASD estimates were obtained during simulations, while a reduction 93% was obtained in the variance of ASD for the experimental results.
I. I NTRODUCTION Quantitative ultrasound (QUS) imaging techniques based on ultrasonic backscatter have been used to characterize tissue and to successfully diagnose and monitor disease. The theoretical foundation for tissue characterization using spectral analysis was laid out by Lizzi et al. [1]. With QUS, the normalized backscattered power spectrum from some region of interest (ROI) can be parameterized and related to tissue microstructure. The size of the ROI corresponds to the spatial resolution of the parametric image and is dictated by the number of independent scan lines in the lateral extent and axially by the spatial distance delineated by a range gating function. By decreasing the size of the ROI, the spatial resolution of the parametric image is improved. Unfortunately, a tradeoff exists between the accuracy and precision of the scatterer property
978-1-4244-2480-1/08/$25.00 ©2008 IEEE
II. M ETHODS AND P ROCEDURES A. Simulations For the simulations, two types of phantoms were used. First, phantom S1, a simulated phantom with dimensions of 30 mm x 20 mm x 1 mm and with an average of 15 point scatterers
36
2008 IEEE International Ultrasonics Symposium Proceedings
per resolution cell volume that had an f 4 dependence on the backscatter power spectrum. However, to model soft tissue scattering and to obtain ASD estimates, the simulated phantom was modified by the spherical Gaussian form factor [7] with an aef f of 25 µm. The spherical Gaussian form factor was used to model soft tissue scattering which is described by
a)
FGauss (f ) = e
.
CP REC
ASD variance
ASD bias
250 4 2 0 CP REC
−2
−12.159f 2 a2ef f
b) 300
6
1
(1)
The propagation speed of the medium in phantom S1 was 1540 m/s. In addition, the backscattered data was reduced by the frequency-dependent attenuation corresponding to the distance of the scatterer from the source. The attenuation was set to 0.5 dB MHz−1 cm−1 . Phantom S1 was used to evaluate the effects that REC had on the spatial resolution of QUS images due to the increase in bandwidth. A second phantom, phantom S2, consisted of the same parameters of phantom S1 except that it contained a cylindrical lesion of 6 mm in radius that was centered in a background region with dimensions of 30 mm x 20 mm x 1 mm. Both, the lesion and the background region contained scatterers modeled using the spherical Gaussian form factor. The size of the scatterers were 25 µm and 20 µm for the lesion and background, respectively. Phantom S2 was used to evaluate the effects that REC had on the contrast resolution of QUS images due to the improvements in variance of ASD estimates. Both phantoms S1 and S2 were placed 40 mm from the simulated source which had a focal depth of 50 mm. The received RF backscatter data were sampled at a rate of 100 MHz and the transducer was translated laterally in increments of 0.31 mm (50% overlap). For phantom S2, the size of the ROI was selected by utilizing the optimal axial and lateral resolution for estimating scatterer properties [2]. Axially, individual scan lines were gated with a rectangular window of a length that would correspond to 5.5 CP axial pulse lengths. Laterally, a distance of five lateral beamwidths was used, which corresponds to 10 scan lines because data was acquired with a 50% beamwidth overlap between scan lines. Therefore, each ROI was a rectangle 1.52 mm x 4.15 mm. However, ROIs were overlapped both laterally and axially by 66%; therefore, the effective ROI size after averaging was 0.50 mm x 1.25 mm. For phantom S1, the size of the ROI was varied in the axial extent as the goal of this study was to evaluate the estimate bias and variance as a function of gate length. Estimates of ASD were obtained by approximating the measured power spectrum by a best-fit line technique [3].
3
5 7 9 11 13 15 CP Pulse Length
200 150 100 50 1
3
5 7 9 11 13 15 CP Pulse Length
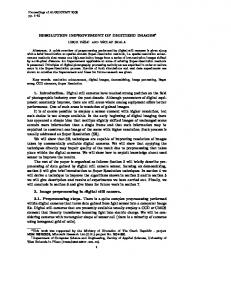
Fig. 1. a) Bias and b) variance of ASD estimates as a function of pulse length. Each tick mark on the abscissa is normalized to a CP pulse length of one, which corresponds to 0.28 mm. Therefore, one REC pulse length, which is 0.17 mm, would correspond to 0.61 CP pulse length.
155%. Measurements from a physical phantom were obtained to evaluate the performance of REC-QUS versus conventional QUS methods. The phantom was cylindrical with glass sphere scatterers that varied in diameter in the range of 45 µm to 53 µm [9]. The phantom had a nominal speed of sound of 1540 m/s and an attenuation of 0.5 dB MHz−1 cm−1 . The received RF backscatter data were sampled at a rate of 100 MHz and the transducer was translated laterally in increments of 0.33 mm (50% overlap). Axially, individual scan lines were gated with a rectangular window of a length that would correspond to 15 CP axial pulse lengths. Laterally, five lateral beamwidths were used, which corresponds to 10 scan lines because data was acquired with a 50% beamwidth overlap between scan lines. Therefore, each ROI was a rectangle 3.3 mm x 3 mm. However, ROIs were overlapped both laterally and axially by 66%; therefore, the effective ROI size after averaging was 1.1 mm x 1 mm. Estimates of ASD were obtained by minimizing the average squared deviation (MASD) as a function of ASD [10] where the theoretical backscatter coefficient was obtained from theory [11], [12]. In measurements, the phantom was placed in a tank of 20◦ C degassed water such that the front of the phantom was perpendicular to the beam axis of the transducer. Measurements of backscatter were obtained for three distances of R1 : 10 mm, 15 mm, and 20 mm. Each distance represents a shift in the placement of the focus within the phantom. QUS parametric images for experimental measurements were generated by compounding the estimates for all three distances listed above. Reference pulses were obtained by reflecting an R incident pulse off a Plexiglas° surface for both CP and REC. Because estimates require a normalization with a reference spectrum that is located at the center of the gate, reference pulses were obtained in increments of 500 µm that spanned the entire depth of focus.
B. Experiments Measurements were performed to validate the improvements afforded by the REC-QUS technique in an experimental setting. A single-element weakly-focused (f/4) transducer with a center frequency of 10 MHz was used to image phantoms by translating the transducer laterally. The transducer had a -6dB pulse-echo bandwidth of 80% along with a -6-dB pulseecho beamwidth of 0.67 mm. These parameters were measured using the wire technique [8] for transducer characterization. Using REC the -6-dB pulse-echo bandwidth was enhanced to
III. R ESULTS AND D ISCUSSION A. Simulations Simulations of phantom S1 consisted of obtaining estimates by varying the size of the axial gate. The axial gate lengths evaluated for CP and REC were dictated by the pulse length at -15 dB. The bias and variance of ASD estimates for phantom S1 are shown in Fig. 1. The bias results in Fig. 1a demonstrate
37
2008 IEEE International Ultrasonics Symposium Proceedings
b)
1.5 1 0.5
CP REC 1
3
25 20 15 10 5 0
5 7 9 11 13 15 CP Pulse Length
Axial Distance [mm]
2
% Histogram Overlap
CNR
2.5
CP CP REC
30
1
3
5 7 9 11 13 15 CP Pulse Length
CP
Axial Distance [mm]
Axial Distance [mm]
55
0
10 20 30 Lateral Distance [mm] 20
40
ASD [µm]
60
50
55 0
0
10 20 30 Lateral Distance [mm] 20
40
60
ASD [µm]
Fig. 4. Parametric images of effective ASD for the B-mode image in Fig. 3 for CP and REC. Actual scatterer diameters for lesion and background region are 60 µm and 50 µm, respectively.
40
45
50
55
Fig. 3.
50
45
REC
40
60 0
45
0
Fig. 2. a) CNR and b) HO as a function of pulse length. Each tick mark on the abscissa is normalized to a CP pulse length of one, which corresponds to 0.28 mm. Therefore, one REC pulse length, which is 0.17 mm, would correspond to 0.61 CP pulse length.
REC
Axial Distance [mm]
a) 3
10 20 Lateral Distance [mm]
30
45
obtained by using REC-QUS over conventional QUS. CNR allowed quantification of the improvement in contrast while HO was used to evaluate the overlap in intensity between QUS pixels in the lesion and background regions. In addition, HO allows quantification of the optimal gate length when examining the tradeoff between axial resolution and contrast resolution. HO as a function of pulse length for phantom S2 is shown in Fig. 2b. Observation from Fig. 2b indicates that for REC-QUS, HO reaches 0% for a gate length of 5.5 CP pulse length while for conventional QUS, HO reaches 0% for a gate length of 13 CP pulse lengths. These results indicate that the optimal axial gate length, where the parametric image using REC yielded a optimal contrast, was 5.5 CP pulse length. By using REC-QUS with a gate length of 5.5 CP pulse lengths as opposed to conventional QUS with a gate length of 13 CP pulse lengths a gain of 136% in axial resolution in the parametric image was achieved. Conventional B-mode images for the phantom S2 evaluated are shown in Fig. 3. The CNR for the B-mode images of CP and REC shown in Fig. 3 was 0.14. QUS estimates of ASD were obtained for a gate length equivalent to 5.5 CP pulse lengths (nine REC pulse lengths). The parametric images for this scenario are shown in Fig. 4. Examination of the REC parametric image reveals that by using REC-QUS the lesion is more clearly observed when compared to conventional QUS methods. For CP, the bias of ASD estimates for the lesion was 0.80 µm and the bias of ASD estimates for the background region was 11.14 µm. The variance of ASD estimates for CP was 42.64 and 169.34 for the lesion and background regions, respectively. For REC, the bias of ASD estimates for the lesion was 1.20 µm and the bias of ASD estimates for the background region was 0.72 µm. The variance of ASD estimates for REC was 8.22 and 12.9 for the lesion and background regions, respectively. By using REC-QUS, the percent decrease in variance of ASD estimates for the lesion and the background regions were 81% and 70%, respectively. Moreover, the CNR for the CP parametric image was 1.39, which corresponds to an improvement of 892% in image contrast of the B-mode image; however, the improvement obtained with REC was far superior with an increase in contrast over the conventional B-mode image of 1378% (a CNR of 2.07). Furthermore, histogram
50
55
60 0
10 20 Lateral Distance [mm]
30
B-mode images of phantom S2 for CP and REC
that REC-QUS obtained improved estimates when compared to conventional QUS methods using CP. Additionally, the variance results in Fig. 1b provide evidence that the bandwidth enhancement generated by using REC resulted in significant improvements in estimation error. For ROIs of axial pulse lengths of one and two a decrease of 70% and 77% in variance were obtained by using REC. Furthermore, by using REC over CP an approximate 80% decrease in the variance of ASD estimates was obtained for ROIs with axial pulse lengths greater than three. Simulations of phantom S2 consisted of obtaining ASD estimates for the target lesion and the background region. The purpose of this simulation was to evaluate the quality of RECQUS parametric images when two simulated tissues have a small difference in ASD. For this study, the image quality metrics of contrast-to-noise ratio (CNR) [6] and histogram overlap (HO) were generated by assessing the lesion and background regions of the QUS parametric images. Evaluating CNR for the optimal axial length [2] of 15 REC pulse lengths, which is equivalent to 2.54 mm, the CNR was 1.77 for CP and 2.80 for REC. Comparisons of CNR as a function of CP pulse lengths for phantom S2 are shown in Fig. 2a. Fitting the data of Fig. 2a with a line in the least-squares sense provided a slope of 0.15 and an intercept of 0.39 for CP while a slope of 0.25 and an intercept of 0.64 was obtained for REC. These results suggests that a greater increase in contrast occurs using REC with a minimal loss in QUS parametric image axial resolution as opposed to conventional QUS performed with CP. In fact, REC-QUS parametric images achieved an average of 51% increase in contrast when compared to the conventional QUS parametric images generated using CP. Histogram analysis further highlights the improvements
38
2008 IEEE International Ultrasonics Symposium Proceedings
IV. C ONCLUSION Simulations and experiments were used to establish the usefulness of the REC-QUS technique in reducing the estimate variance. Simulations results clearly indicated that with RECQUS substantial improvements in axial resolution and contrast resolution of QUS images can be achieved. CNR estimates improved considerably by using REC-QUS over conventional QUS methods. In simulations the HO between the background and the target region was significantly reduced for smaller gate lengths than conventional QUS. Furthermore, simulations and experimental measurements suggest that REC-QUS was an effective tool for reducing estimate bias and variance as a function of penetration depth. The culmination of all these results provides sufficient evidence that REC-QUS has the potential to improve the diagnostic capabilities of QUS imaging techniques for clinical application.
Fig. 5. B-mode images of physical phantom for CP and REC. Each B-mode image has a parametric image overlay of ASD a)
b)
140 CP REC
120
ASD variance
ASD
100
200
80 60 40
CP REC
150 100
ACKNOWLEDGMENT
50
The authors would like to thank Steven G. Kanzler, Roberto J. Lavarello and Dr. William D. O’Brien Jr. for the useful discussions. This work was supported by a grant from the National Institutes of Health (R21 EB006741).
20 0
50 55 60 65 Axial Distance [mm]
50 55 60 65 Axial Distance [mm]
Fig. 6. a) ASD and b) variance of ASD estimates of physical phantom as a function of depth. The range of scatterers is indicated by solid lines across as a function of depth.
R EFERENCES [1] F. L. Lizzi, M. Greenebaum, E. J. Feleppa, M. Elbaum, and D. J. Coleman, ”Theoretical framework for spectrum analysis in ultrasonic characterization,” J. Acoust. Soc. Am., vol. 73, pp. 1366-1373, Jan 1983. [2] M. L. Oelze and W. D. O’Brien, Jr., ”Defining optimal axial and lateral resolution for estimating scatterer properties from volumes using ultrasound backscatterer,” J. Acoust. Soc. Am., vol. 115, pp. 3226-3234, Jun 2004. [3] M. L. Oelze, J. F. Zachary, and W. D. O’Brien, Jr., ”Characterization of tissue microstructure using ultrasonic backscatter: theory and technique optimization using a Gaussian form factor,” J. Acoust. Soc. Am., vol. 112, pp. 1202-1211, 2002. [4] M. L. Oelze, ”Bandwidth and resolution enhancement through pulse compression,” IEEE Trans. Ultrason. Ferroelect. Freq. Control, vol. 54, pp. 768-781, Apr 2007. [5] P. Chaturvedi, and M. F. Insana, Error bounds on ultrasonic scatterer size estimates, J. Acoust. Soc. Amer., vol. 100, pp.392399, 1996. [6] M. S. Patterson, and F. S. Foster, ”The improvement and quantitative assessment fo B-mode images produced by an annular array/cone hybrid,” Utrason. Imag., vol. 5, pp. 195-213, 1983. [7] M. F. Insana, R. F. Wagner, D. G. Brown, and T. J. Hall, ”Describing small-scale structure in random media using pulse-echo ultrasound,” J. Acoust. Soc. Am., vol. 87, pp. 179-192, 1990. [8] K. Raum, and W. D. O’Brien, Jr., ”Pulse-echo field distribution measurement technique for high-frequency ultrasound sources,” IEEE Trans. Ultrason. Ferroelect. Freq. Contr., vol. 44, pp. 810-815, 2006. [9] K A.Wear, T. .A Stiles, G. .R. Frank, E. L. Madsen, F. Cheng, E. J. Feleppa, C. S. Hall, B. S. Kim, P. Lee, W. D .O’Brien, Jr., M. L. Oelze, B. I. Raju, K. K. Shung, T. A. Wilson, J. R. Yuan, ”Interlaboratory comparison of ultrasonic backscatter coefficient measurements from 2 to 9 MHz,” J. Ultrasound Med., vol. 24, pp. 1235-1250, 2005. [10] M. F. Insana, and T. J. Hall, ”Parametric ultrasound imaging from backscatter coefficient measurements: Image formation and interpretation,” Ultrason. Imaging, vol. 12, pp. 245-267, 1990. [11] J. J. Faran, ”Sound scattering by solid cylinders and spheres,” J. Acoust. Soc. Am., vol. 23, pp. 405-418, 1951. [12] R. Hickling, ”Analysis of Echoes from a Solid Elastic Sphere in Water,” J. Acoust. Soc.Am., vol. 34, pp. 1582-1592, 1962. [13] S. G. Kanzler, and M. L. Oelze, ”Improved scatterer size estimation using backscatter coefficient measurements with coded excitation and pulse compression,” J. Acoust. Soc. Am., vol. 123, pp. 4599-4607, Jun 2008.
analysis indicates that an overlap of 10.7% existed between the background and lesion region for CP while no overlap existed for REC-QUS. Note that analysis of the overlap regions does not contain ROIs that are near the perimeter of the lesion. The lack of overlap along with the smaller variance in estimates associated with the REC method leads to improved detection and differentiation of the lesion from the background when compared to CP. B. Experiments B-mode images for CP and REC along with a parametric image overlay for the physical phantom is shown in Fig. 5. Furthermore, the ASD and variance of ASD estimates as a function of depth is shown in Fig. 6. The ASD results in Fig. 6a demonstrate that REC-QUS has a better ability to obtain improved estimates when compared to conventional QUS methods obtained with CP. In fact, 93.4% of conventional QUS ASD estimates fell out of the 45 µm to 53 µm bounds in contrast to 61.3% of ASD estimates obtained with REC-QUS. The ASD from combining all QUS estimates was 65.6 for CP and 54.1 for REC. The variance of all QUS ASD estimates at each depth was 116.2 for CP and 7.8 for REC. Overall, as the penetration depth increased, the improvements in the variance of ASD estimates using REC increased as shown in Fig 6b. This improvement was due to the increase in eSNR by using coded excitation and the increase in the usable bandwidth. REC-QUS resulted in more accurate ASD estimates as RECQUS obtained a larger percentage of estimates that were within the true range of scatterer diameters.
39
2008 IEEE International Ultrasonics Symposium Proceedings