REVIEW OF SCIENTIFIC INSTRUMENTS
VOLUME 72, NUMBER 4
APRIL 2001
Thermal deformation measurement of electronic packages using the atomic force microscope scanning moire´ technique Y. G. Lu,a) Z. W. Zhong, and J. Yu Precision Engineering and Nanotechnology Centre, School of Mechanical and Production Engineering, Nanyang Technological University, Nanyang Avenue, Singapore 639798
H. M. Xie Sensor and Actuator Strategic Research Program, School of Mechanical and Production Engineering, Nanyang Technological University, Nanyang Avenue, Singapore 639798
B. K. A. Ngoi Precision Engineering and Nanotechnology Centre, School of Mechanical and Production Engineering, Nanyang Technological University, Nanyang Avenue, Singapore 639798
G. B. Chai and A. Asundi Sensor and Actuator Strategic Research Program, School of Mechanical and Production Engineering, Nanyang Technological University, Nanyang Avenue, Singapore 639798
共Received 26 September 2000; accepted for publication 2 January 2001兲 In this article, the feasibility of atomic force microscope 共AFM兲 scanning moire´ on a cross-line diffraction grating has been studied. The AFM scanning moire´ technique has been applied to measure the thermal deformation of electronic packages successfully. This technique is convenient to perform the mismatch method, also it could obtain a higher resolution than any other moire´ method. © 2001 American Institute of Physics. 关DOI: 10.1063/1.1350641兴
I. INTRODUCTION
Electronic packaging is the technology dealing with the protection of a silicon chip from the environment, as well as both electrical and mechanical connections to the surrounding components. The package contains various conducting or insulating materials that have different coefficients of thermal expansion 共CTE兲; these differences of CTE lead to thermally induced mechanical stresses within the package when the package is powered on. As the components and structures in electronic packages become smaller and more complicated, the thermal gradient may increase and the strain concentration becomes more serious. The moire´ technique is a whole field in situ method to measure the in-plane deformation. Its excellent abilities, such as high displacement measurement sensitivity, high spatial resolution, and high signal-to-noise ratio, made it ideal for measuring complex geometry. Han has made a thorough review of this technique and its application to deformation measurement in microelectronic devices.1 The scanning probe microscope 共SPM兲 was developed in the 1980s for its high spatial resolution. It has found many applications in a broad range of fields, including microelectronics. As one of the most popular members of SPM family, the atomic force microscope 共AFM兲 has been used extensively to perform dimensional measurements such as Z dimensions, roughness, and critical dimensions in the semiconductor industry where the sizes of circuit elements are steadily shrinking.2 The AFM moire´ technique was also developed to measure deformation in a very small scale as a兲
Author to whom correspondence should be addressed; electronic mail:
[email protected]
compared with microscopic moire´ interferometries. Chen, Liu, and Lee demonstrated the feasibility of using AFM to form moire´ fringe patterns.3 The AFM scanning lines were used as the reference grating and the specimen grating could be prepared by various methods. Xie et al. had successfully applied the AFM moire´ technique to measure nanodeformation of mica and high-orientated pyrolytic graphite 共HOPG兲 in which the atomic lattice of mica and HOPG was used as the specimen grating.4 In this article, the AFM moire´ technique was applied to measure the thermal deformation of quad flat pack 共QFP兲 packages. The AFM scanning lines were used as the reference grating and a diffraction grating attached to the specimen was used as the specimen grating. The results have proven that AFM moire´ is a suitable technique for such applications. ´ ON DIFFRACTION GRATING II. AFM MOIRE
The AFM measurement principle is well known since it is now widely used. The probing tip at the end of a cantilever scans and collects data in a raster pattern. A constant force, either van der Waals or Coulombic, keeps the cantilever deflected at a preset amplitude. A laser beam is focused on the cantilever and is reflected to a photodiode detector array, effectively measuring the height of the cantilever. This height information is then transferred back to the controller as a feedback signal to adjust the voltage applied to a piezotube so that the force between the scanning tip and sample features is constant. By recording the voltage applied to the piezotube, the topography of a sample can be mapped. While topography measurement is common knowledge, the raster movement pattern of the scanner is similar to the
0034-6748/2001/72(4)/2180/6/$18.00 2180 © 2001 American Institute of Physics Reuse of AIP Publishing content is subject to the terms at: https://publishing.aip.org/authors/rights-and-permissions. Download to IP: 155.69.24.171 On: Sat, 03 Sep 2016 08:32:32
Rev. Sci. Instrum., Vol. 72, No. 4, April 2001
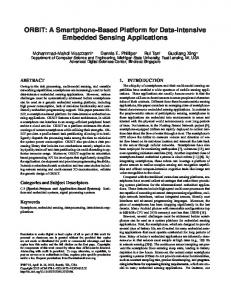
FIG. 1. AFM image of the cross-line diffraction grating 共1200 lines/mm兲.
scanning lines of a TV camera in the scanning moire´ proposed by Morimoto and Hayashi5 in the early 1980s. The scanning movement of the AFM scanner can also be taken as a parallel grating to form the scanning moire´. When the scanning lines were taken as the reference grating, they may interfere with a matching specimen grating to generate scanning moire´ fringes. The AFM moire´ technique is novel compared with traditional moire´ technologies, false moire´ fringes may emerge due to several unidentified factors. For new specimen gratings, the feasibility of forming moire´ fringes should be confirmed before the measurements are carried out. The feasibility of AFM moire´ has been shown using a scanning electron microscope generated parallel grating,3 mica, and a HOPG lattice.4 However, in traditional moire´ techniques, diffraction grating is much more popular. Figure 1 shows the topography of a standard cross-line 1200 lines/mm diffraction grating. In this study, this grating was tested to form AFM moire´ fringes. Uniformity of this grating was examined by AFM and its error was within 0.5%. The reference and specimen grating are schematically illustrated in Fig. 2. The AFM scanner scans and collects data in a raster pattern, as shown in Fig. 2共a兲, the scanning
Thermal deformation measurement
2181
FIG. 2. Schematic diagram of reference and specimen gratings. 共a兲 Raster pattern motion of AFM scanner. 共b兲 Schematic diagram of diffraction grating.
lines can be taken as the reference grating while the diffraction grating is taken as the specimen grating. AFM moire´ fringes were formed by the overlapping of the two gratings, as shown in Fig. 3. In order to verify that the captured fringes are really interfered with by the specimen grating and reference grating, the scanning lines were rotated slightly with respect to the specimen grating since moire´ fringes should also rotate following Eq. 共1兲:6
FIG. 3. Schematic diagram of moire´ fringe formation. Reuse of AIP Publishing content is subject to the terms at: https://publishing.aip.org/authors/rights-and-permissions. Download to IP: 155.69.24.171 On: Sat, 03 Sep 2016 08:32:32
2182
Lu et al.
Rev. Sci. Instrum., Vol. 72, No. 4, April 2001
FIG. 4. Moire´ fringe patterns at various scan angles.
sin共 ⫺ 兲 p s ⫽ ⫽C, sin pr
共1兲
where and are the moire´ fringe rotation angle and specimen grating rotation angle with respect to the reference grating, i.e., scanning lines, respectively; p s and p r are pitch values of the specimen grating and reference grating, respectively, as shown in Fig. 3. In this feasibility test, all images were captured by using 128 scanning lines in a 100 m scanning range. Hence, p r ⫽100/128⫽0.78125 m, p s ⫽1000/1200⫽0.83333 m, and C⫽ p s / p r ⫽1.0667. For convenience of verifying experimental and analytical results, the specimen grating was carefully aligned so that the grating was parallel to the 0° scan angle of the scanner. Then, the scan angle was changed from ⫺4° to 4° with a step of 1°. AFM moire´ fringes were captured with a 100 m scan size, as shown in Fig. 4. The maximum scan size kept dropping as the scan angle increased, otherwise more images at various angles could have been captured. Table I shows the analytical and experimental results of the AFM moire´ test; the experimental results coincide well with the analytical values. Another verification method is to change the frequency of the reference grating when is kept fixed. Adjusting the AFM scan size changed the reference grating frequency. When was 0°, the interfringe spacing varied with the changes of the scan size. The experimental results also coincide well with those of theoretical analysis. The conclusion can be made that the moire´ fringes are really AFM moire´ fringes formed by the specimen and refTABLE I. Analytical and experimental results of moire´ fringe angles.
a
T a
E b
⫺4 ⫺3 ⫺2 ⫺1 0 1 2 3 4
45.27 37.57 27.42 14.64 0 ⫺14.64 ⫺27.42 ⫺37.57 ⫺45.27
44.57 37.19 27.38 14.55 0 ⫺14.88 ⫺28.45 ⫺37.65 ⫺44.68
erence grating and can be applied to the deformation measurement. III. STRAIN MEASUREMENT BY USING THE AFM MOIRE´ TECHNIQUE
The frequency of the reference grating depends on the scan size L and number of scanning lines N. Because AFM scanners usually cannot scan a size beyond 150 m, and there are only several options for the number of scanning lines 共64, 128, 256, 512兲, attention should be paid to choose a proper scan size. Supposing that in a scan size of L there are two fringes, then the frequency of reference grating can be taken as4 f r⫽
1 N ⫽ pr L
共 N⫽64, 128, 256, 512兲 ,
共2兲
where N is the number of scanning lines. And the strain can be defined as y⫽
兩 p s⫺ p r兩 p s ⫽ . pr L
共3兲
From Eqs. 共2兲 and 共3兲 the scan size can be defined as L⫽ p s 共 N⫿1 兲 .
共4兲
Similarly, when in the scanned area there are l orders of moire´ fringes, the strain y can be defined as y⫽ as
兩 p s ⫺ p r 兩 l⫺1 p . ⫽ pr L s
共5兲
From Eqs. 共2兲 and 共5兲, the scan size can be determined L⫽p s 关 N⫿ 共 l⫺1 兲兴 .
共6兲
From Eq. 共6兲, a null field could be obtained for an ideal reference grating and specimen grating if the scan size and number of scan lines were carefully chosen. However, due to imperfection of reference and specimen gratings and in some cases the need to eliminate the strain induced by other factors such as temperature variation, a virtual strain is usually required for better measurement accuracy. For example, instead of using a 107 m scan size to produce a null field, a 100 m scan size could produce a desired number of moire´ fringes before deformation.
T : theoretical analysis results. E : experimental results. Reuse of AIP Publishing content is subject to the terms at: https://publishing.aip.org/authors/rights-and-permissions. Download to IP: 155.69.24.171 On: Sat, 03 Sep 2016 08:32:32 b
Rev. Sci. Instrum., Vol. 72, No. 4, April 2001
Thermal deformation measurement
2183
When the carrier moire´ was used to measure the in-plane deformation, the virtual normal strain in the y direction can be measured as 0y ⫽
v 0y ps ⫽ 0 , y Syy
共7兲
where the U and V fields are the moire´ pattern in the x and y directions, and S 0y y is the spacing between the two adjacent fringes in the V-field initial moire´ pattern. After exerting a load and using the same scan size and number of scan lines in the initial moire´ pattern, the normal strain in the y direction can be measured as 1y ⫽
v 1y ps ⫽ 1 , y Syy
共8兲
where v 1y , 1y are the displacement and normal strain in the y direction after deformation, respectively. S 1y y is the spacing between two adjacent fringes corresponding to the deformed V-field moire´ pattern. Strain introduced by the load can be determined as y ⫽ 1y ⫺ 0y ⫽
v 1y v 0y ps ps ⫺ ⫽ 1 ⫺ 0 . y y Syy Syy
共9兲
In this study, the cross-line diffraction grating was taken as two identical parallel gratings orthogonal to each other 共as shown in Figs. 1 and 2兲. By simply rotating the scan angle to 90°, the U-field moire´ pattern could record similarly, and the normal strain in the x direction can be measured as x ⫽ 1x ⫺ 0x ⫽
u 1x u 0x p s p s ⫺ ⫽ 1⫺ 0 , x x S xx S xx
共10兲
then the shear strain can be determined as
␥ xy ⫽
ps ps ps u1 v1 u0 v0 ps ⫹ ⫺ ⫺ ⫽ 1 ⫹ 1 ⫺ 0 ⫺ 0 , y x y x S xy S yx S xy S yx
FIG. 5. Schematic diagram of QFP 共the package contains various materials that have different CTE兲.
The cross-line diffraction grating 共shown in Fig. 1兲 with a frequency of 1200 lines/mm was heated with the package, and the grating was made on an ultra-low-expansion substrate so that it will not change with temperature. Both the package and the grating were kept at the elevated temperature long enough to ensure the same temperature and proper relaxation. Then, the grating was transferred to the ground surface at 100 °C and cooled down to 25 °C immediately. The specimen was thus subjected to an isothermal loading of ⌬T⫽⫺75 °C. The grating deformed with the specimen during the cool-down process. The deformed package was carefully mounted onto the AFM stage using adhesive plastic, with its longer sides parallel to the y axis of the stage, as shown in Fig. 6. Due to the symmetry of the package deformation, adjustments were carefully made to find the neutral point O located approximately at the center of the cross section. This was done when uniform parallel moire´ fringes were observed with a 0° scan angle, as shown in Fig. 7. One of the most interesting areas where cracks tend to initiate was the corner of the silicon die. Six points along the y axis just out of the die attach to the corner were observed, both U- and V-field moire´ images were captured. Examples are shown in Figs. 8 and 9. Using Eqs. 共3兲–共11兲, the normal strain and shear strain can be calculated. Figure 10 shows the distribution of normal strain dV/dy values at the die corner. It can be seen that this normal strain decreases gradually while the corner experienced the highest
共11兲 where u and u are the displacement components in the x direction before and after deformation, respectively; S 0xy is the spacing between the adjacent U-field moire´ fringe in the y direction before deformation, S 0yx is the spacing between the adjacent V-field moire´ fringes in the x direction before deformation, and S 1xy and S 1yx are the spacing between the adjacent U and V fields in the y and x directions, respectively. The sign of normal strain can be determined by rotating the scan angle. When the moire´ fringes rotate in the same direction, the normal strain is tensile; otherwise, it is compressive. Note that in this study, the AFM rotates in the clockwise direction when the scan angle increases. 0
1
´ APPLICATION TO ELECTRONIC IV. AFM MOIRE PACKAGES
In this study, a quad flat pack package was cleaved in half to expose the internal components and then polished flat to a fineness 0.02 level to attach a diffraction grating. Figure 5 schematically shows the cross section of the QFP package.
FIG. 6. Schematic diagram of specimen orientation 共the specimen was mounted parallel to the y axis to find the neutral point兲. Reuse of AIP Publishing content is subject to the terms at: https://publishing.aip.org/authors/rights-and-permissions. Download to IP: 155.69.24.171 On: Sat, 03 Sep 2016
08:32:32
2184
Lu et al.
Rev. Sci. Instrum., Vol. 72, No. 4, April 2001
FIG. 7. Parallel moire´ pattern at point O.
FIG. 9. V-field moire´ fringes.
strain from the isothermal loading. The moire´ fringes tend to be sparser away from the corner. Figure 11 shows the shear strain distribution along the die corner. The shear strain decreases in a similar manner to that of the normal strain.
sured values were compared with known dimensions. However, due to several factors in the calibration work, such as resolution of display monitor, human error, plus the standard sample error, the lateral and vertical error can be as high as 3%. In this study, the diffraction grating was taken as two parallel gratings orthogonal to each other, so both the U- and V-field moire´ fringes can be recorded by switching the scan angle between 0° and 90°. Since the linearity of the x and y axes was only calibrated at 0°, the linearity at 90° was then examined before the measurements were carried out. It was found to be fairly good. However, later when the piezotube was replaced and recalibrated, the linearity was poor when the scan angle was changed to 90°. The linearity changed, probably because this G scanner was designed for topography measurement, so large sizes were seldom scanned at the 90° scan angle if it could be done at 0°. If the linearity was poor at 90°, then the only way to record both the U- and V-field moire´ fringes in such cases was to rotate the sample 90° after the U- or V-field fringes were captured. It is also well known that the scanner moves in a different manner between scanning downward and upward, and the linearity may change significantly if the slow axis direction changes. Because the SPM system used in this study was calibrated when scanning downward, all the moire´ fringes above were captured in the same manner.
V. DISCUSSION
In this study, a Digital Instrument Dimension 3000 SPM equipped with a ‘‘G’’ scanner was utilized. This scanner has a typical maximum scan size of 90 m. However, some piezomaterials were damaged and after replacement and recalibration, it can now scan a size as large as 109 m. Then, a null field can be obtained when the scan size is 107 m and the number of scanning lines is 128 for the 1200 lines/mm diffraction grating. A. Calibration of scanner and measuring error
For any moire´ technique, accuracy is always most important. Before this experiment, the scanner was calibrated using a VLSI standard sample 共STR10-1800兲. This standard sample has a nominal error within 2%. Linearity and sensitivity were both finely calibrated for the x and y axes at 0° to ensure an error of less than 1%. Linearity calibration determines the uniformity of the reference grating; sensitivity calibration determines the pitch of the reference grating. Calibration parameters for scanner were adjusted while mea-
B. Advantage and adaptability of the AFM moire´ technique
SPM can achieve a scan size in a range from several nanometers to 150 m or more. Thus, the AFM moire´ technique can observe very tiny deformation in the nanoscale as
FIG. 8. U-field moire´ fringes. FIG. 10. Normal strain distribution along the y axis. Reuse of AIP Publishing content is subject to the terms at: https://publishing.aip.org/authors/rights-and-permissions. Download to IP: 155.69.24.171 On: Sat, 03 Sep 2016 08:32:32
Rev. Sci. Instrum., Vol. 72, No. 4, April 2001
Thermal deformation measurement
2185
FIG. 11. Shear strain distribution along the y axis.
well as in the macroscale. Since the sensitivity of moire´ techniques is determined by the specimen grating, the sensitivity can be greatly improved if a specimen grating of higher frequency is used. For the AFM used in this study, the scan size can be smaller than 1 m. If 512 scan lines are used, the frequency of the specimen grating can reach as high as 512 000 lines/mm. Traditional moire´ interferometers cannot use 3600 lines/mm specimen grating due to diffraction limitation. Thus, if a proper matching specimen grating is used, a much higher resolution can be achieved than that with the traditional optical moire´ interferometer. However, in this study, the 1200 lines/mm specimen grating could only achieve a sensitivity of 0.833 m per fringe order. Further experiments could be done with 2400, 3600, and 4800 lines/mm gratings. The disadvantage of the AFM moire´ method is the mismatch between the reference grating and the specimen grating if the scan size is not properly chosen. Usually, the scanning lines of the AFM have only several options, such as 64, 128, 256, and 512. For an image with better resolution, 256 lines are usually required. Using 256 scan lines, in this application, the pitch value of the reference grating is less than half that of the specimen grating even though the scan size goes up to 100 m. This renders the moire´ fringes very hard to form when the scan size is limited. In this study, hardly any moire´ fringes were observed when the scan size was 80 m or less. A 2400 lines/mm grating would be much better. Whereas for 512 scan lines, a 4800 lines/mm specimen grating would be preferred. However, the cost will be much greater. C. AFM moire´ fringes under different modes
All the moire´ fringes shown above were captured while collecting height data information. However, when the AFM
FIG. 12. Moire´ fringes captured by collecting height and friction data 共another group of fringes appears when collecting friction data兲.
is working under other modes such as the lateral force mode, the scanning lines are formed in a similar manner, and better fringe patterns have been reported.4 In this study, both height and friction data were captured to form moire´ fringes, as shown in Fig. 12. It is interesting that under lateral force mode another group of moire´ fringes emerge. Though it is possible that subtractive and additive moire´ fringes could exist in the same picture, extensive studies proved that the new fringe group could be neither subtractive nor additive. Further work should be done to explain their appearance.
ACKNOWLEDGMENT
The authors would like to express their sincere appreciation for the support from Nanyang Technological University.
1
B. Han, Exp. Tech. 38, 278 共1998兲. T. V. Vorburger, J. A. Dagata, G. Wilkening, and K. Lizuka, CIRP Ann. 46, 597 共1997兲. 3 H. Chen, D. Liu, and A. Lee, Exp. Tech. 24, 31 共2000兲. 4 H. Xie, S. Kishimoto, A. Asundi, G. B. Chai, N. Shinya, J. Yu, and B. K. A. Ngoi, Nanotechnology 11, 24 共2000兲. 5 Y. Morimoto and T. Hayashi, Exp. Mech. 24, 112 共1984兲. 6 Q. X. Cao, Principle and Application of High-frequency Grating Moire´ 共Tsinghua University, Beijing, 1983兲. 2
Reuse of AIP Publishing content is subject to the terms at: https://publishing.aip.org/authors/rights-and-permissions. Download to IP: 155.69.24.171 On: Sat, 03 Sep 2016 08:32:32