Circe W. Tsui ,BBA a,b , Tim T. Morris, BS a , Iris E. Smith, PhD c a Research and Health Sciences IT Division, Emory University, Atlanta, GA b School of Health ...
Using Social Network Image Animator to Visualize Transformation of the Atlanta Clinical and Translational Science Institute’s Collaboration Network Circe W. Tsui ,BBA a,b , Tim T. Morris, BS a , Iris E. Smith, PhD c a Research and Health Sciences IT Division, Emory University, Atlanta, GA b School of Health Information Sciences, University of Texas, Houston, TX c Rollins School of Public Health, Emory University, Atlanta, GA Abstract Emory University partnering with Morehouse School of Medicine and Georgia Institute of Technology formed the Atlanta Clinical Translational Science Institute. One of the institute’s challenges is to transform its collaboration network to foster transdisciplinary and multiorganizational research. To evaluate this transformation, Social Network Image Animator (SoNIA) is used to project the working relationships among researchers into social network graphs and an animated movie. This helps the ACTSI to identify its network’s strengths and opportunities for improvement. Introduction Emory University, partnering with Morehouse School of Medicine (MSM) and Georgia Institute of Technology (GA Tech), was awarded the Clinical and Translational Science Award (CTSA) in September 2007. One of the ACTSI’s challenges is to increase the amount of transdisciplinary research as well as crossorganization collaborations. The ACTSI Tracking and Evaluation program (T&E) is charged with continuously monitoring the ACSTI’s progress toward its goals and providing timely and informative feedback to the ACTSI leadership. Method Lists of research projects supported by the Institute at four different time points over a period of two years were provided to the T&E group. For each research project, the principal investigators (PI), the coPIs, and the coinvestigators were identified and classified according to their primary academic appointment. Using Social Network Image Animator (SoNIA) 1 a series of four social network graphs and an animation 2 were generated based on a modified KamadaKawai (KK) 3 algorithm. Each investigator was represented as a node in the diagram and colored differently depending on the investigator’s affiliation. Two investigators would be tied in an arc if they participated in one or more research projects together. Results
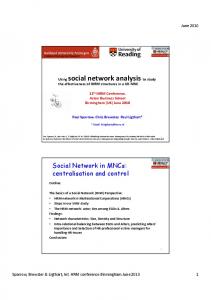
Figure 1 (from left to right) time 0, time 1, time 2, time 3.
The diagrams in figure 1 show considerable cohesiveness and relatively short paths between nodes which are typical of a smallworld network. 4 Playing the animation back and forth shows MSM and GA Tech investigators moving into the network signifying the increasing amount of cross organizational collaborations. The movie also reveals the clusters that are most active in interdisciplinary and multiorganizational projects. Conclusion This paper describes an approach for the T&E program to use working relationships as the basis for the ACTSI collaboration network analysis for examining trends in transdisciplinary and multi organizational research. The approach uses an animation produced by SoNIA to visualize transformations of the collaborative research network. The animation is shown to be extremely useful in assessing longitudinal changes in the collaborative relationships of individual investigators, which would be otherwise very difficult to accomplish using statistical methodologies. This approach can be adopted for other evaluative tasks which longitudinally examine largescaled collaboration networks with multiple dimensions. References 1. BenderdeMoll S, McFarland DA. The art of science of dynamic network visualization. J of Social Structure 2006:7(2). 2. The movie is available at this web URL http://userwww.service.emory.edu/~ctsui2/ctsa_col/netwo rkb2.mov 3. Kamada K, Kawai S. An algorithm for drawing general undirected graphs. Information Processing Letters 1989;31:715. 4. Milgram S. The smallworld problem. Psychology Today. 1967;1:61617.