Mine Water and the Environment (2007) 26: 60–69 © IMWA Springer-Verlag 2007
Technical Article
Using the GRAM Model to Reconstruct the Important Factors in Historic Groundwater Rebound in Part of the Durham Coalfield, UK
L. Kortas1 and P. L. Younger2
1Laboratory of Engineering Geophysics, Dept of Geology and Geophysics, Central Mining Institute, Pl Gwarków 1, 40-166 Katowice, Poland; 2Institute for Research on Environment and Sustainability, Devonshire Bldg, Univ of Newcastle Upon
Tyne, NE1 7RU, UK; corresponding author’s e-mail:
[email protected] Submitted February 6th 2007; accepted May 18th 2007
Abstract: Modeling of mine water rebound in the southernmost zone of the Durham Coalfield has been undertaken in an attempt to reproduce observed water level recovery, since the 1970s, within five coal blocks south of the Butterknowle Fault. The lumped parameter model GRAM (groundwater rebound in abandoned mineworkings) was chosen to perform the simulations since it overcomes, to a large extent, a common problem found in such studies, namely a lack (especially concerning historic hydrogeological records) and superabundance of various kinds of data. The results obtained from this approach are satisfying and closely resemble the observed pattern of mine water rebound for the mining blocks studied. Such research indicates the critical dependence of predictions on factors such as the volume of water flowing into the system, the percentage runoff, and the value of storage coefficient assigned to the old workings. Model predictions are most useful as a tool for improving the conceptual understanding of abandoned mine systems and as a basis for evaluating alternative possibilities of coalfield behaviour, rather than as a strict quantitative assessment for all management purposes. Key Words: Durham Coalfield; GRAM model; mine hydrology; rebound Introduction
The first recorded coal mining in County Durham was reported in the 12th century but it wasn’t until some 600 years later, after the invention of the pumping engine by Newcomen in 1712, that the Durham Coalfield became extensively exploited. Its heyday was the beginning of the 20th century when 304 pits were mining 41 Mt of coal per annum. Mining continued until the early 1970s when coalfield closures took place. After the cessation of pumping in the abandoned workings in the southern zone of the coalfield, the process of ground water rebound began, and led to the migration of a polluted mine water plume into the overlying Magnesian Limestone aquifer (Younger et al. 2007). The progress of pollutants has been documented in a number of reports and papers (Neymeyer 2001; Williams 2003; Younger et al. 2007) and a Technical Advisory Group has recently been set up to conduct new modeling investigations of plume migration, as it is approaching some nearby public water supply wells and threatening the maintenance of a potable water supply.
This paper reports preliminary modeling of groundwater rebound within the abandoned collieries of the southern zone of the Durham Coalfield using GRAM (groundwater rebound in abandoned mine-
workings, Sherwood 1997). The main objective of the work was to reproduce the observed water levels while helping to understand the rebound process, and gain experience on implementing such modeling, before applying it to other coalfields where rebound may occur after mine flooding and cessation of pumping. The results can also be used in the development of a new conceptual model of the area, and to support future modeling work planned by the local water company.
Modeling has not previously been performed in the southern zone of the Durham coalfield, although an application of GRAM to the northern part of the coalfield, described by Sherwood and Younger (1994), included the north-east corner of the current study area. Parkin and Adams (1998) used MODFLOW and the catchment model SHETRAN to simulate groundwater-surface water interactions within the Durham Coalfield (Bishop Auckland area) while Lancaster (1995) used MODFLOW to simulate the catchment area and flow system of a polluted spring, originating from mine water flow following the cessation of regional dewatering, in County Durham. GRAM has also successfully been applied to the South Yorkshire coalfield by Burke and Younger (2000) and Burke et al. (2005).
Study Area
61
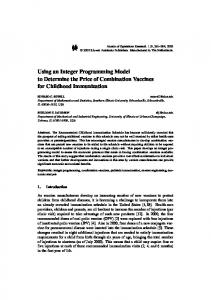
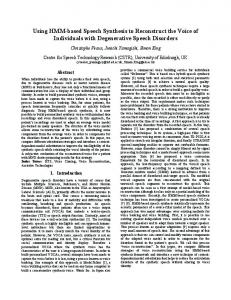
The study area comprises the southernmost zone of the Durham Coalfield, which is located in the North East of England, UK (Figure 1). It is defined by the area of mine workings which are overlain by the Magnesian Limestone aquifer, and the adjacent exposed coalfield, which is potentially interconnected (Figure 2). The northern boundary of the conceptual model is defined by the Butterknowle Fault, which has a maximum displacement to the south of nearly 300m, while the southern boundary is taken to be the general incrop to the Magnesian Limestone in the east and the outcrop to the surface of the Coal Measures in the west. The study area is dissected by the River Gaunless, which rises on the eastern slopes of the Pennines and flows generally north-eastwards to join the River Wear at Bishop Auckland. The total modeled area covers approximately 111 km². The study focuses on the five mined coal blocks or ‘ponds’ within the southern zone of the Durham Coalfield: the Laydysmith/Woodhouses/Etherly Lane Block, the North Eldon Block, the Eldon Block, the Chilton Block and the Fishburn/Mainsforth/Thrislington Block. Exact locations of the blocks are shown in Figure 2. Figure 1. Location of the study area within NE England
Prior to coalfield closures, the study area had a total of 17 working collieries and 9 pumping stations, which were pumping a total of 18×106 m³ of water to the surface per annum, with an output of saleable coal of 8.3 million tons/year (NCB 1964). Large feeders of
Figure 2. Study area showing major geological features, mining blocks, monitoring and water abstraction sites (WYG Report, 2006)
62 Recharge 1
Recharge 2
Connections between ponds WL
pipe flow WL
POND 1
POND 2
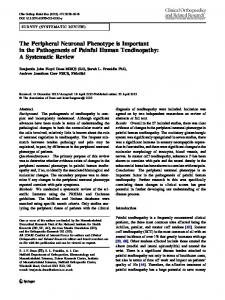
Figure 3. Diagram of two ponds and their connections (after Sherwood, 1997)
water, on the order of 30×106 m³/yr, arise from very shallow workings in the west and the Magnesian Limestone in the east. Pumping rates for each colliery, during operation, are given in Table 1. Geological and Historical Overview
The Durham Coalfield is made up of Carboniferous Westphalian Coal Measures which have a total thickness of approximately 900 m. South of the Butterknowle Fault the Coal Measures are strongly folded with the fold axes aligned parallel to the fault (Minett 1987). To the west of a line through Ferryhill (Bishop Auckland) and Boldon (near South Shields) the coalfield is exposed on the surface. To the east the Coal Measures are overlain by Permian Basal Sands (BPS), Marl Slate and Magnesian Limestone, which dip gently in a south easterly direction. The BPS lies at the base of the Permian and consists of loosely consolidated sands whose thickness varies from less than 1m to over 20m. Overlying the BPS is the Marl Slate – a thin (< 0.6m but in some places > 3m) dolomitic shale with low permeability. Above the Marl Slate lies the Lower Magnesian Limestone which has a thickness of about 60m. The Basal Permian Sands and Magnesian Limestone represent major aquifers.
Extensive mining began in the region in the 18th century with the shallow workings in the most western part of the exposed coal field later propagating under the Permian cover. Pumping led to large scale drawdown of the water table which was maintained during mine operations in much of the coalfield. When coal production finally ceased in the early 1970s, after about 250 years of industrial-scale mining, pumping of ground water was discontinued. This led to the process of water level recovery commonly called ‘rebound’ (e.g. Younger and Adams 1999) which describes the rapid rise of water levels in a short period of time after which stabilization generally occurs (as shown in Figure 5). Following the commencement of rebound, periodic pumping was undertaken until 1976 (Cairney and Frost
1975) but after this time water levels were allowed to rise unabated. As a result, apart from the flooding of old workings, the water level also started to rise in the Magnesian Limestone aquifer, eventually leading to a rise in water level of over 10m in the Magnesian Limestone over much of the study area (Younger 1995). Hydrochemical sampling of observation boreholes in the area revealed that much of the water making up the increased volume in storage in the aquifer was heavily contaminated with sulphate, with concentrations reaching 800 mg/l near Ferryhill (Younger and Adams 1999). The sulphates are derived from the oxidative weathering of pyrite, present within Coal Measures, during the period in which the mine voids were exposed to oxygen (Younger and Adams 1999).
In terms of environmental impacts caused by the rebound process, there is a fear that groundwater pollution could contaminate the Basal Permian Sands and Magnesian Limestone aquifers which represent a large part of the public water supply in the area. From a geotechnical point of view a subsidence risk also exists when rising water levels reach the old bord-andpillar workings. GRAM Model
GRAM (groundwater rebound in abandoned mineworkings) is a lumped parameter model which conceptualizes a coalfield as a series of ponds connected by pipes. The model was first applied to the Durham Coalfield in 1993 (Younger and Sherwood 1993) and was subsequently refined (Sherwood and Younger 1994, 1997). A detailed description of the model has already been given by Burke and Younger (2000), Sherwood (1997), and Sherwood and Younger (1997), so only a brief summary is given here.
GRAM is based upon the concept of ponds, which can be defined as discrete areas of interconnected workings, typically separated by unworked coal or major faults. It is assumed that the hydraulic gradient is flat within each pond and that hydraulic conductivity is large enough to allow the water table to conform to a flat gradient. The model calculates water balances over a daily time step for all defined ponds in a multiple-pond mined system. The water balance consists of: recharge from precipitation and/or inflow from the overlying water body, flow between ponds through discrete connections and dewatering. Inter-pond flow and discharge to the surface is modeled using equations for pipeflow which give a realistic method of representing the nature of the flow (in reality mainly through roadways) in such environments. A schematic picture of the interaction between two ponds is shown in Figure 3.
GRAM predicts water level rise on the basis of the percentage of the pond volume occupied by floodable volume. As stated above the model assumes that the water level within each pond is horizontal and that the flow along the connections is roughly turbulent. This has the advantage of making GRAM a non-Darcian flow model and avoids difficult assumptions concerning permeability. It also results in GRAM having the ability to run very fast on common computers. The other advantage is that input data requirements are comparatively modest (Sherwood and Younger 1997) which overcomes, to a large extent, common problems regarding lack of appropriate data (Sherwood 1997). The main input parameters are as follows: • recharge rates (rainfall, overlying body) • aerial extent of ponds
• measured groundwater levels
• measured pumping rates at collieries (uniform or time varying) • levels and locations of connections between ponds
• estimates of storage coefficient (uniform or depth varying) • levels and locations of surface discharge points In addition, GRAM outputs the following: • water level in each pond
• water balance consisting of comparison of the change in storage volume and the difference between the volume of water entering and leaving the system • time to first flow from each surface discharge point • the volume of each surface discharge over time
• average volume of flow from each surface discharge.
Application of GRAM to the Study Area Conceptual Model
As stated above, one of the biggest problems in modeling groundwater rebound in abandoned mines is the lack of historical records concerning changes in water level over time, while there tends to be an abundance of recent data. Although the modest data requirements of GRAM overcome this problem, to
63
some extent, it is still seen as a potential source of error. The primary data sources used in this study were a report by White Young Green on ”Mine Water Contamination of the Permian Aquifer South of the Butterknowle Fault” written for The Coal Authority (WYG 2006), and the National Coal Board report “Durham Coalfield. Underground Water Survey” (NCB 1964). The latter provided water level data ‘before rebound’ with the assumption that the water level did not change significantly between 1964 and the beginning of the simulations (1968) (personal comm.,Younger 2006 ). An additional significant source of data was a report by the local water authority “Report on survey of water resources” (Northumbrian River Authority 1973).
The five partially interconnected collieries comprising the southern zone of the Durham Coalfield can be represented by ponds and pipes; therefore, the coalfield can be modeled using GRAM. Due to a lack of separate data for the North Eldon and Eldon Blocks, the number of ponds was reduced to four when constructing the conceptual model. They are in order from west to east:
• The Laydysmith/Woodhouses/Etherley Lane Block: Pond 1 (later called LWE)
• The North Eldon Block together with Eldon Block: Pond 2 (later called Eldon) • The Chilton Block: Pond 3 (later called Chilton)
• The Fishburn/Mainsforth/Thrislington Block: Pond 4 (later called FMT)
Some of the major pond boundaries were reported by Minett (1987), who divided the entire groundwater system south of the Butterknowle Fault into 45 ponds. Figure 4 shows the extent of the current ponds under study along with the hydraulic connections between them. In general the direction of flow between the ponds was from west to east. Model Calibration
During the model calibration process, several key parameters were adjusted, including the amount of water inflow from aquifers or other mines, the percentage runoff, and the storage coefficient for both the Coal Measures and the overlying Permian strata. The model proved to be most sensitive to the latter parameter, even to small changes in its value. Since the storage coefficient is a measure of the percentage void space within the workings it is extremely difficult to estimate, especially given the limited available data. Similarly, little data exists on inflow to the workings from the Permian strata and percentage runoff. Along
64
Figure 4. Extent of the ponds, locality of the mining blocks south of the Butterknowle fault and hydraulic connections between them
with storage coefficient, these are seen as the greatest sources of error.
The extent of worked Coal Measures within each pond was taken from the 6 inch to 1 mile mine plans of the Hutton (L), Busty (Q) and Brockwell (S) Seams given by NCB (1964). By overlaying the extent of workings in each seam an outline of the maximum extent of workings was produced for each colliery. This was taken to represent the pond boundaries (Figure 4) from which the area of each pond, in square meters, was calculated.
Recharge (from rainfall) into each pond was calculated from daily rainfall data over the past 40 years, obtained from the Environment Agency for several monitoring stations across the Northumbria area. The two stations closest to the study area, New Winning and Thrislington, were chosen to provide the rainfall input data. Since GRAM requires a single column of ASCI data for rainfall, the average daily rainfall for the two sites over the simulation period was calculated. It was assumed that the entire pond area receives natural recharge (Table 1). In addition, GRAM allows recharge to be attenuated over several days; in this case, it was assumed to take 2 days for recharge to reach the water table with a fraction of 0.5/day. The annual average evaporation rate was taken to be 400 mm while the percentage runoff for each pond was calibrated during preliminary simulations (Table 1).
Additional inflow was assumed to occur into those ponds which are overlain by Magnesian Limestone (Ponds 3 and 4 and part of Pond 2). For Pond 1, which
is in the exposed part of the coalfield, inflow from the western part of the coalfield and the River Gaunless, which crosses the pond, was estimated to be 10,000 m³/d, with a relatively low percentage runoff of 20%. An increased inflow into Pond 2, which has partial Permian cover (approximately 50%), was assumed with a value of 25,000 m³/d and a percentage runoff of 35%. The remaining two ponds, which receive seepage from the overlying Magnesian Limestone, had inflows of 38,000 m³/d and 40,000 m³/d respectively (Sherwood and Younger, 1994) and a greater percentage runoff of 50% and 85% respectively.
The initial water levels in each pond were taken from the 6 inch to 1 mile National Coal Board coalfield plans (NCB 1964). The data was reported relative to the mine survey datum of 10,000 ft below sea level, which was converted to meters above ordnance datum (AOD) for each colliery. The average water level for each pond was determined for model input (see Table 1).
Pumping rates varied in each pond over time but, given the limited available data, it was decided to use only two time periods: before and after cessation of pumping. A constant pumping rate for each pond, taken from NCB (1964), was assumed from day 0 of the simulation (1968) until the cessation of pumping (see Table 1), which was assumed to occur after 2555 days of the simulation (in 1974). Thereafter, the pumping rate was set at 0 m³/day in all ponds.
With the exception of Pond 1, which is not overlain by Permian strata and therefore can be assumed to have a
65
Table 1. Pond properties and data for separate collieries within them, before rebound (in 1964)
Pond No
1
Name Colliery/Block Whole LWE
Area [m2] 48,322,416
Laydysmith Etherleylane Woodhouses New Shildon Randolph Adelaide Rush Shildon Lodge 2
3
4
Water Runoff [%] level [m AOD] -17.73 -13.41 no data no data 0.00 13.11 -63.40 57.30 -100.00
Whole Eldon
16,196,862
-75.90
North Eldon Eldon Block
6,306,764 9,890,098
no data no data
22,739,075
-171.81
Chilton 22,739,075 Dean and Chapter Leasingthorne
-198.12 -134.11 -183.18
Whole FMT
-127.30
Whole Chilton
Mainsforth Thrislington Fishburn
20
24,648,969
-171.91 -65.23 -144.78
uniform storage coefficient, the storage coefficient was chosen to be vertically varying in each pond, with two zones representing the Coal Measures and the Permian respectively. As the water level in each pond rises into a new zone the storage coefficient is changed accordingly. Since this is one of the most sensitive parameters a large part of the calibration process focused on changing the value of storage coefficient. The values and heights for the two storage zones in each pond are given in Table 1.
In terms of hydraulics, flow between ponds was calculated using the Prandtl-Nikuradse equation for turbulent flow. GRAM allows the user to choose between that and the Colebrook-White equation but the first approach does not require time-consuming iterations which keeps the calculation time to a minimum. The only assumption here is that flow occurs in the roughly turbulent zone, which is consistent with evidence from underground observations (Younger and Adams 1999).
The elevation of pond connections and their lengths were estimated from the 6 inch to 1 mile mine plans
Pumped MW [m3/day] 22,846.38 9,819.36 no data no data 1,112.86 3,273.12 3,600.43 1,767.48 3,273.12
35
2,291.18 no data no data
50
19,671.45 11,390.46 2,225.72 6,055.27
85
36,069.78 16,954.76 4,058.67 15,056.35
Storage Coeff. w/height
Inflow [m3/day]
-20m: 0.025 -200m: 0.025
10,000
-20m: 0.017 -200m: 0.010
25,000
-20m: 0.038 -200m: 0.010
38,000
-20m: 0.018 -200m: 0.010
40,000
(NCB, 1964). The calibrated values, together with the roughness coefficient for each connection (taken from Gandy and Younger [2006]), are as follows: • Pond1 to Pond2 • Pond2 to Pond3 • Pond3 to Pond4:
24.4 m AOD, 65m, 0.012 m 45.7 m AOD, 70m, 0.012 m
-158.5 m AOD, 80m, 0.22 m 0.0 m AOD, 50m, 0.22 m 20.0 m AOD, 30m, 0.008 m
The connection ‘pipe’ diameters were adjusted during calibration according to WYG (2006).
The exact locations of possible surface discharges from each pond were not determined during the current study but potential elevations of discharges were entered into the model, estimated from surface topography maps and the observed water level plots (Figure 5; WYG, 2006). In general, their elevations correspond with the height at which water levels in each pond stabilized and are as follows (in units of m AOD): Pond 1: 105 m, Pond 2: 91 m, Pond 3: 80 m,
66
Figure 5. Measured water levels recovery; from WYG (2006)
Figure 6. Results for Pond1-4 of GRAM modeling of rebound in the 1970’s
Pond 4: 67 m. The roughness coefficient was set to 30 mm for all of the discharges, which is a typical value used in previous GRAM simulations (Gandy and Younger 2006). The length and diameter of discharge ‘pipes’ did not appear to have a significant influence on the simulation results. Results and Discussion
The model simulation was carried out for a period of 7300 days (20 years), from 1968 to 1988. The modeled water level rise in each pond is shown in Figure 6.
As can be seen, ground water rebound is predicted to have taken place relatively rapidly, particularly in Pond 1 (LWE), where the modeled water levels stabilized after only 745 days (2.04y) following the cessation of pumping, which corresponds to 3300 days (9.04y) from the start of the simulation. Even in the most eastern pond, Pond 4 (FMT), groundwater rebound was complete 3700 days (3.14y) after the pumps were turned off. In Ponds 2 (Eldon) and 3 (Chilton), it is predicted that water levels reach the surface after 3450 days of the simulation, although with different elevations of discharges. Such rapid rebound has potential environmental impacts, in particular concerning the presence of nearby public water supply wells.
67
A comparison between the observed and modeled water levels shows that GRAM is capable of reproducing the process of ground water rebound in this part of the Durham Coalfield. Observed water level data is available for Ponds 1, 3 and 4, which are shown in Figure 7 together with the modeled water levels in each pond. For Pond 1, the measured water level is represented by Laydysmith and Woodhouses monitoring sites, whose levels are almost identical (Figure 5). Unfortunately, there are no historic records of water level in Pond 2 while only one monitoring station exists for Pond 3, the NCB 22 borehole. Pond 4 contains three monitoring sites at Mainsforth, Thrislington and Fishburn. A good correlation can be seen between observed and modeled water levels in each pond, particularly for Pond 1. In Pond 4, the modeled water level corresponds to the average observed water level between the three monitoring stations in that Pond. The only discrepancy between observed and modeled data is the historic water level, in the period before cessation of pumping (days 02555), in Pond 3. This is due to what is believed to be erroneous data used by WYG (2006) to draw the plot. The water level used in modeling was taken as an average of three water levels recorded in the NCB report (NCB, 1964) in Chilton, Dean and Chapter, and Leasingtrone collieries (-172 m AOD, details in Table 1), whereas the data in WYG (2006) shows the water
Figure 7. The results of GRAM rebound modeling overlaid with real water level recovery plots from WYG (2006)
68
level to be at an elevation of +65 m AOD in 1968. However, following cessation of pumping, observed and modeled water level in Pond 3 are very similar. The whole rebound process took about 4 y to complete.
It can be seen in Figure 7 that the modeled water levels appear as relatively straight lines. This is due to the assumption within GRAM of a flat hydraulic gradient, as mentioned earlier. In reality, the shape of the rebounding water levels should be curved as voids initially fill due to rapid flows under high gradient near to the edges of the dewatered zone. This means that predictions in the initial stages of a simulation may be slightly inaccurate but, overall, the model prediction represents an accurate prediction of observed water levels with the advantage over standard groundwater models of a massive saving in computation. Conclusions
The main problem in modeling groundwater rebound is a lack of appropriate data, particularly concerning historic water levels. The lumped parameter model GRAM, described here, helps to overcome some of the uncertainty that could be encountered while using offthe-shelf groundwater models for modeling rebound in abandoned mines.
The application of GRAM to groundwater rebound in the southern zone of the Durham Coalfield has produced satisfying results, with a good correlation shown between observed and modeled water levels. The use of GRAM for predicting water level recovery in abandoned mines can help to quickly determine the timings and sequence of polluted mine water discharges, therefore allowing appropriate actions to be undertaken for water treatment or the maintenance of pumping schemes in other coalfields across the world. It is fair to conclude that GRAM is one of the best tools for fast “first approximation” applications of real problems of ground water rebound. Model results are not a quantitative answer for all management questions but rather a qualitative approach to evaluate the alternative possibilities of coalfield behavior. Acknowledgements
This study was one of the first author’s major tasks during a placement within the Institute for Research in Environment and Sustainability at Newcastle University. The placement was funded under the aegis of the WaterNorm Program (MTKD-CT-2004-003163 EU), which falls under the Marie Curie Host Fellowships of the 6th EU Framework Program. Newcastle University is one of the partners of the Central Mining Institute in Katowice, Poland (first author’s institution of origin) within WaterNorm. The
first author worked within the HERO group under the supervision of Prof. Paul L. Younger. The authors would like to thank Dr. Catherine J. Gandy (Newcastle University) for valuable advice on setting up the model and editorial issues and Sally Gallagher (Environment Agency) for providing the rainfall data. References
Burke SP, Younger PL (2000) Groundwater rebound in the South Yorkshire coalfield: a first approximation using the GRAM model, Quarterly Journal of Engineering Geology and Hydrogeology, 33, pp. 149160
Burke SP, Potter HAB, Jarvis A (2005) Groundwater rebound in the South Yorkshire Coalfield: A review of initial modeling, Proceedings of 9th International Mine Water Congress, Oviedo, Spain, pp. 223-227 Cairney T, Frost RC (1975) A case study of mine water quality deterioration, Mainsforth Colliery, County Durham, Journal of Hydrology 25, pp. 275-293
Gandy CJ, Younger PL (2006) Groundwater rebound in the South Yorkshire Coalfield: Application of GRAM, Report to UK Coal Ltd, Hydrochemical Engineering Research and Outreach, Institute for Research on Environment and Sustainability, University of Newcastle Upon Tyne, pp. 1-22
Lancaster D (1995) Delineating the catchment area and flow system of a major polluted spring in County Durham – MSc Thesis, University of Newcastle, Dep. Of Civil Eng., pp. 92
Minnet S (1987) The hydrogeology of parts of the Northumberland and Durham Coalfield related to opencast mining operations – PhD Thesis, University of Newcastle, Dep. Of Civil Eng., pp. 186-302 Neymeyer A (2001) Modelling Pollution Migration in the Magnesian Limestone Aquifer in County Durham – MSc Thesis, University of Newcastle, Dep. Of Civil Eng., pp. 131 w/15 maps
National Coal Brand (1964) Durham Coalfield. Underground water survey, NCB Gateshead, pp. 34, w/ 4 plans Northumbrian River Authority (1973) Report on survey of water resources, NRA Water Resources Act 1963 Sect. 14, pp. 191, w/ 3 maps
Parkin G, Adams R (1998) Using catchment models for groundwater problems: evaluating the impacts of mine dewatering and groundwater abstraction,
Hydrology in Changing Environment, Volume II, no. 27, British Hydrological Society, Ed. Wheater H, Kirby C, pp. 269-279
Sherwood JM, Younger PL (1994) Modeling groundwater rebound after coalfield closure: an example from County Durham, UK, Proceedings of 5th International Mine Water Congress, Ed. Reddish DJ, Univ. of Nottingham and IMWA, pp. 769-777
Sherwood, JM, PL Younger (1997) Modelling groundwater rebound after coalfield closure, Proc. XXVII Congress of the International Association of Hydrogeologists, Groundwater in the urban environment, Volume 1: Problems, processes and management, Nottingham, UK, A A Balkema. Sherwood JM (1997) Modeling minewater flow and quality changes after coalfield closure – PhD Thesis, University of Newcastle, Dep. Of Civil Eng., pp. 241
White Young Green (2006) Mine Water Contamination of the Permian Aquifer South of the Butterknowle Fault, for the Coal Authority, pp. 39.
69
Williams R (2003) Pollution of the Permian Limestone Aquifer by Rebounding Coal Measures Groundwater Co. Durham, England – MSc Thesis, University of Newcastle, Dep. Of Civil Eng., pp. 82
Younger PL (1995) Hydrogeology, In: Johnson GAL Robson’s Geology of North East England, Transactions of the Natural History Society of Northumbria, Vol. 56, (5), pp. 353-359 Younger PL, Adams R (1999) Predicting mine water rebound, Environment Agency RandD Technical Report W179, Bristol, UK, pp.108
Younger PL, Sherwood JM (1993) The cost of decommissioning a coalfield: Potential Environmental Problems in County Durham, Mineral Planning, Vol.57, pp. 26-29
Younger PL, Neymeyer A, Williams R, (2007) Migration of polluted mine water in a public supply aquifer, submitted to Quarterly Journal of Engineering Geology and Hydrogeology, pp. 22