Using the Journalistic Metaphor to Design User Interfaces That Explain Sensor Data Martin Molina1, Enrique Parodi 1, and Amanda Stent2 1 Department of Artificial Intelligence Technical University of Madrid, Spain
[email protected],
[email protected] 2 AT&T Labs - Research Florham Park, NJ, USA
[email protected]
Abstract. Facilitating general access to data from sensor networks (including traffic, hydrology and other domains) increases their utility. In this paper we argue that the journalistic metaphor can be effectively used to automatically generate multimedia presentations that help non-expert users analyze and understand sensor data. The journalistic layout and style are familiar to most users. Furthermore, the journalistic approach of ordering information from most general to most specific helps users obtain a high-level understanding while providing them the freedom to choose the depth of analysis to which they want to go. We describe the general characteristics and architectural requirements for an interactive intelligent user interface for exploring sensor data that uses the journalistic metaphor. We also describe our experience in developing this interface in real-world domains (e.g., hydrology). Keywords: Intelligent user interface, multimedia presentation, interactive data exploration, user interface for web applications.
1 Introduction Today, organizations are collecting large quantitative datasets from distributed sensors including GPS devices, RFID tags, and point of purchase devices. There exist advanced visualization systems to help domain experts analyze, interpret and understand data from sensor networks [5][11]. Non-expert users can also benefit from analyses of sensor network data. Web-based systems that automatically construct textual, spoken or multimedia explanations of the meaning of sensor data using nontechnical language can facilitate access by non-expert users and consequently increase the utility of sensor network infrastructures. An example of this situation in the hydrological domain is sensor network with real time data about water levels, water flows and other meteorological information. In contrast to a specialized system that only presents graphics and quantitative results of analyses to expert hydrologists, an interactive web application with additional text and multimedia explanation capabilities is potentially useful to a wide range of non-expert users (e.g., municipalities, civil protection, engineering consultants, and educators). P. Campos et al. (Eds.): INTERACT 2011, Part III, LNCS 6948, pp. 636–643, 2011. © IFIP International Federation for Information Processing 2011
Using the Journalistic Metaphor to Design User Interfaces That Explain Sensor Data
637
Other examples of large quantitative datasets potentially useful for different communities of users are environmental data from ship traffic [23], crime statistics [22], and wildlife tracking data [18]. The addition of text explanations to visualizations of sensor data can facilitate better understanding and more effective use of the data. The automatic generation of presentations combining text and graphics is a well-known but complex problem [6][7][12]. In this paper we analyze two particular questions: (1) what presentation style (combining text and graphics) can be used to help non-expert users analyze sensor data, and (2) what techniques can be used to support the automatic generation of this type of presentation. Our answer to the first question is to use the journalistic metaphor, because the journalistic layout and presentation style are widely understood. Our answer to the second question is a general design that combines and adapts techniques from multimedia presentation systems and intelligent data analysis. In the following sections, we first describe our concept of an user interface following the journalistic metaphor. Then, we describe the main components of a general architecture to support this type of interface. Finally, we describe applications that we developed to evaluate our approach, and a comparison with related work.
2 A User Interface Based on the Journalistic Metaphor Journalists, who face the challenging task of presenting complex situations to nonexperts in a way that quickly and effectively promotes understanding, have converged on practical guidelines for effective communication to wide audiences. We use these journalistic guidelines to design a user interface that explains sensor data to wide audiences. In general, the journalistic style uses non-technical language understandable by general users and follows guidelines such as the following: •
•
•
Writing using the inverted pyramid. A news story is usually structured to put essential information first, with supporting information following in order of diminishing importance. The headline captures the user’s attention and quickly communicates the main idea of the story. Then, the text body develops the headline. The text body is structured to put essential information first, with supporting information following in order of diminishing importance. It is structured so that the user can stop at any point with a high-level understanding, or continue to read to get more detailed analysis. Effective use of graphics to elaborate on the text. A feature story is often accompanied by illustrations including 2D maps and timelines, bar charts, line charts, pie charts, and images. Figure captions summarize the content of the figure. Figure legends explain the meaning of certain symbols and act as quick references to subsets of the data identified during data analysis. The text body also explains the meaning of the data analyses displayed in the graphics. Page layout to organize related information. A newspaper organizes news stories into different sections, with the most important stories on the first page. Graphics and text may be presented in a one-column layout (with graphics located near the relevant text), or in multi-column layouts (with graphics running parallel to the text).
638
M. Molina, E. Parodi, and A. Stent
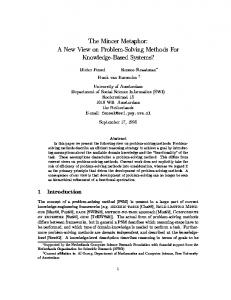
The Polar Star research vessel goes to the Arctic ocean every summer The page is automatically generated by analyzing sensor datasets
The user can click hypertext links to change figures, change views of figures, or to show other pages
Reporting data for 6 years The Polar Star goes to the Arctic ocean every summer and to the Atlantic ocean every winter (Fig. 2). The Polar Star recorded temperature data for the last 6 years (Fig. 3). The vessel recorded values for air temperature that ranges from -26 C to 19 C with an average of 3 C. Values for dew point temperature range from -26.7 C to 18.4 C with an average of -6.88 C. Values for sea surface temperature range from -1.5 C to 18.12 C with an average of 5.54 C. Values for wind speed range from 0 Km/h to 99 Km/h with an average of 6.73 Km/h. Values for visibility range from 91 Km to 98 Km with an average of 97.43 Km. Values for sea pressure range from 0 to 999.5 with an average of 15.93. The recruiting country for the Polar Star research vessel (Fig. 1) and its registered country is the United States of America. Its call sign is WAGB-10, the speed is 15 knots and the type is Heavy Icebreaker. The length of the Polar Star is 122 m, the displacement is 13,194 long tons, and its rage is 28,275 nmi.
Figure 1. The Polar Star research vessel.
Figure 2. The Pola r Star goes to the Arctic ocean.
Figure 3. The Pola r Star recorded tempera ture data for the la st 6 years.
The user can manipulate some figures to explore more details
The user can select some subsets of data points to generate new presentations
Fig. 1. Example presentation for interactive exploration of sensor datasets
Figure 1 shows an example presentation in a user interface that we developed following the journalistic metaphor. This presentation is based on a large set of environmental information collected by ships over the last ten years as part of the international VOSclim project [23]. This data set includes tens of measures for each of hundreds of thousands of events for hundreds of ships. Our web-based, interactive interface works as a virtual newspaper that automatically generates multimedia news stories that highlight and explain analyses of sensor data.
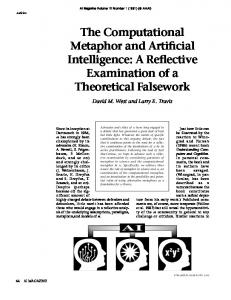
3 Automatic Generation of Presentations To implement a user interface that explains sensor data using the journalistic metaphor, we need to simulate tasks that human journalists perform to construct presentations. These tasks are: analyze the data and find the important elements, create a plan to present the information to the reader, generate the text in natural language using general terminology, generate graphics that complement the text, and generate a logically consistent layout for the presentation. In order to automatically perform these tasks, we have designed a general architecture that combines and adapts solutions from the fields of multimedia presentation systems and intelligent data analysis. Figure 2 shows the main components of our architecture. This architecture shares some general components of multimedia presentation systems [1] (e.g, content planning and presentation generation). Some original contributions of our design are: (1) data analysis of large spatio-temporal datasets, i.e. we automatically analyze large datasets with spatio-temporal information to find patterns and perform aggregations (e.g., spatial and temporal aggregations), (2) explanatory multimedia descriptions, i.e. we automatically construct complex descriptions (with multi-paragraph natural language summaries and graphics) with
Using the Journalistic Metaphor to Design User Interfaces That Explain Sensor Data
639
informative and persuasive discourses that summarize and explain the sensor data (here, we follow the journalistic metaphor which provides a guide to structure the presentation), and (3) interactive exploration, i.e. our user interface supports a mixedinitiative approach to interactive data exploration. Our architecture includes a database that efficiently stores sensor data (thousands or millions of events) and the results of data analyses. The database represents raw sensor readings as observed events, each characterized by a set of attribute values. Our architecture also includes a component for data analysis to find abstractions over the input sensor data. The data analyzer uses general data mining algorithms to cluster, analyze trends, and describe the data in terms of the most common feature values, example instances, and exceptions. The automatic application of geospatial, temporal and domain-specific knowledge bases to the observed events produces extended and aggregated events, with new attribute values corresponding to abstractions of the observed attribute values. User
Web Browser
User Query
Hypermedia presentation
Content Planner Data Analyzer
Analysis Goals Discourse Planner
Presentation Generation Discourse Plan
Natural Language Generator
Graphic Generator
Database: Sensor Data & Abstractions
Fig. 2. Main components of our architecture for automatic generation of news from sensor data
In order to generate multimedia descriptions using the journalistic metaphor, our system must select from numerous potential ways of describing the input data. Therefore, it is not practically possible to use a few templates that help to generate these descriptions. Instead, we use a more flexible solution with a discourse planner in combination with natural language generation and graphics generation. Our discourse planner is conceived as a knowledge-based hierarchical planner. The knowledge base includes partial discourse patterns in the journalistic style, together with conditions for selecting each discourse pattern. The generated discourse plan includes information about the rhetorical structure of the discourse (with rhetorical relations [13]) and information about propositions in the discourse, represented as references to subsets of the input data (Figure 3). In our architecture the discourse planner operates in a loop with the data analyzer. The discourse planner invokes specific prefixed data analysis functions using the knowledge base of discourse patterns and the results of previous data analyses to progressively construct the discourse plan. The component for presentation generation receives as input the discourse plan output by the discourse planner. The presentation generator generates interactive
640
M. Molina, E. Parodi, and A. Stent
hypermedia presentations (in HTML and JavaScript) accessible by remote web browsers through the Internet. Our user interface supports a mixed-initiative approach to interactive data exploration. Some data analysis tasks are chosen and performed automatically by the system, and presented to the user as an inter-connected collection of multimedia stories through which the user can browse. The user can invoke other tasks herself by clicking on hyperlinks in a story or selecting subsets of the data via manipulation of a graphic. Summarize
1
2-7
List
2-3
Summarize
C2
Elaborate
G2
2
6-7
4-5
Elaborate Summarize
Elaborate
List
3
5
4
G3
C3
Elaborate Summarize
Elaborate
7
6
G1
C1
Headline: [1] The Polar Star research vessel goes to the Arctic ocean every summer Text body: [2] The Polar Star goes to the Arctic ocean every summer [3] and to the Atlantic ocean every winter. [4] The Polar Star recorded temperature data for the last 6 years [5] The vessel recorded values for air temperature […] [6] The recruiting country for the Polar Star research vessel [7] and its registered country is the United States […] Captions: [C1] Figure 1: The Polar Star research Vessel [C2] Figure 2: The Polar Star goes to the Arctic Ocean [C3] Figure 3: The Polar Star recorded temperature data for the last 6 years Graphics: [G1] Picture [G2] Space-time cube [G3] 2D graphic with time bar
Fig. 3. Discourse structure of the presentation (simplified example)
The generation process involves picking elements off of the discourse plan and invoking text or graphics generation components accordingly. The text generator produces natural language text using two components, sentence planning and surface realization [20]. The figures that accompany texts are constructed on the fly by the graphics generator. The graphics generator can make use of several publicly available graphics tools, such as Google Charts, Dygraphs, SIMILE Widgets, and OpenStreetMaps.
4 Applications and Related Work We developed a real-world application in the domain of hydrology following the user interface design described in this paper, using sensor data from a national information system (SAIH: Spanish acronym for Automatic Information System in Hydrology) in Spain. The application generates 20-30 pages of news every hour summarizing 44,736 sensor readings across Spain. For example, Figure 4 shows one of the generated pages with a headline (light rain at a few places in the Guadiana basin), text body (with hyperlinks), and two graphics: an animated illustration (the movement of a storm),
Using the Journalistic Metaphor to Design User Interfaces That Explain Sensor Data
641
and an interactive map. We evaluated the practical utility by comparing our application with existing web applications that present hydrological sensor data. The results of this evaluation showed that, with this system, users take up to 4.45 hours less to confirm the information in a summary of the hydrological data than they do given other existing systems for this data (with an average value of 3:45 hours for typical emergency scenarios).
Fig. 4. Example presentation in hydrology
The application in the hydrologic domain followed the journalistic style described in this paper. It also included a preliminary version of our architecture with domain specific knowledge bases and abstraction methods (more details about this application domain can be found at [16]). We have also applied our design partially to other domains: ship data from the VOSclim project [23], Twitter data with measures of sentiment [4], general geographical movements [17], and aircraft data [15]. As a result of these applications, we generalized some components of our design as they are described in this paper. We are currently working on a complete implementation of this design using different domains for evaluation with spatio-temporal data from sensors. Our solution is related to multimedia presentation systems such as WIP [2], COMET [14], Autobrief [9], and Dartbio [3]. Compared to these systems, our system is original in the following aspects: (1) it is designed for a different problem (generation of descriptions about the meaning of sensor data), (2) it follows the journalistic style and constructs complex multi-page presentations, (3) it includes complex and interactive graphics (animations, maps, etc.), and (4) it has been evaluated in real-world domains (e.g., hydrology).
642
M. Molina, E. Parodi, and A. Stent
Our system also shares architectural elements with other data-to-text generation systems (for weather forecasting [21], or medicine [10]). However, we use a different data analysis approach, directed by the discourse planning process; and we produce multimedia presentations. Our system can also be related partially to user interface generation using high level models [8]. Compared to this, our solution also uses high level models (discourse plans with rhetorical relations) to generate output presentations. Our proposal is also related to the field of computational journalism. In this field, our solution can be compared to research work related to automatic generation of news (e.g., [19]). In this type of solution, news is generated using text-to-text summarization techniques and web mining. In contrast, our system creates news stories from quantitative measures of sensor data, and automatically generates coordinated presentations of text and interactive graphics.
5 Conclusions In this paper we have described an intelligent user interface, conceived as an automatically generated virtual newspaper, for interactive exploration of sensor datasets that combine text summaries and graphics. We have adopted the journalistic metaphor to make the results of data analyses easily understandable by non-expert users. This metaphor provides general criteria to automatically construct presentations (with headlines, types of discourse patterns, illustrations and specific page layouts). To support this type of interface, we have identified the main components of a general architecture combining and refining solutions from multimedia presentation systems and intelligent data analysis. We have applied this solution to real-world domains and shown its practical utility. This type of user interface is an effective solution to improve the utility of sensor networks. The implementation of our architecture uses general-purpose reusable components. However, it also requires the development of certain domain-specific components, more specifically, domain-specific discourse patterns, knowledge bases and data analysis methods. Our future work includes the generalization of these domainspecific elements to facilitate reuse, as well as evaluation in different domains. Acknowledgements. The research leading to these results has received funding from the European Union Seventh Framework Programme (FP7/2007-2013) under grant agreement PIOF-GA-2009-253331 (Project INTERACTIVEX). This work was also partially supported by the Ministry of Science and Innovation of Spain within the VIOMATICA project (TIN2008-05837).
References 1. André, E.: The generation of multimedia presentations. In: Dale, R., Moisl, H., Somers, H. (eds.) A Handbook of Natural Language Processing: Techniques and Applications for the Processing of Language as Text, pp. 305–327. Marcel Dekker Inc., New York (2000) 2. André, E., Rist, T.: The design of illustrated documents as a planning task. In: Maybury, M. (ed.) Intelligent Multimedia Interfaces, pp. 94–116. AAAI Press, Menlo Park (1993)
Using the Journalistic Metaphor to Design User Interfaces That Explain Sensor Data
643
3. Bateman, J., Kleinz, J., Kamps, T., Reichenberger, K.: Towards Constructive Text, Diagram, and Layout Generation for Information Presentation. Computational Linguistics 27(3) (2001) 4. Barbosa, L., Feng, J.: Robust sentiment detection on Twitter from biased and noisy data. In: 23rd International Conference on Computational Linguistics, COLING (2010) 5. Card, S.K., Mackinlay, J.D., Shneiderman, B. (eds.): Readings in Information Visualization – Using Vision to Think. Morgan Kaufmann, San Francisco (1999) 6. Carenini, G., Moore, J.: A strategy for generating evaluative arguments. In: First Int’l Conf. on Natural Language Generation (2000) 7. Demberg, V., Moore, J.: Information presentation in spoken dialogue systems. In: 11th Conf. European Chapter of the Association for Computational Linguistics (2006) 8. Falb, J., Kavaldjian, S., Popp, R., Raneburger, D., Arnautovic, E., Kaindl, H.: Fully automatic user interface generation from discourse models. In: 14th International Conference on Intelligent User Interfaces (2009) 9. Green, N., Carenini, G., Kerpedjiev, S., Mattis, J., Moore, J., Roth, S.: AutoBrief: an Experimental System for the Automatic Generation of Briefings in Integrated Text and Information Graphics. International Journal of Human-Computer Studies 61(1), 32–70 (2004) 10. Hunter, J., Gatt, A., Portet, F., Reiter, E., Sripada, S.: Using natural language generation technology to improve information flows in intensive care units. In: 5th Conf. on Prestigious Applications of Intelligent Systems (2008) 11. Keim, D.A.: Information visualization and visual data mining. IEEE Trans. on Visualization & Computer Graphics 8(1), 1–8 (2002) 12. Kopp, S., Tepper, P., Cassell, J.: Towards integrated microplanning of language and iconic gesture for multimodal output. In: 6th Int. Conference on Multimodal Interfaces (2004) 13. Mann, W., Thompson, S.: Rhetorical Structure Theory: Toward a functional theory of text organization. Text 8(3), 243–281 (1988) 14. McKeown, K.R., Feiner, S.K.: Interactive multimedia explanation for equipment maintenance and repair. In: DARPA Speech and Language Workshop (1990) 15. Molina, M., Parodi, E., Stent, A.: Combining text and graphics for interactive exploration of behaviour datasets. In: 22nd Int. Conference on Tools with Artificial Intelligence (2010) 16. Molina, M., Flores, V.: A presentation model for multimedia summaries of behavior. In: 13th International Conference on Intelligent User Interfaces (2008) 17. Molina, M., Stent, A.: A knowledge-based method for generating summaries of spatial movement in geographic areas. International Journal on Artificial Intelligence Tools 19(4), 393–415 (2010) 18. Obis-Seamap, http://seamap.env.duke.edu/ 19. Radev, D.R., Otterbacher, J., Winkel, A., Blair-Goldensohn, S.: NewsInEssence: Summarizing online news topics. Communications of the ACM 48(10), 95–98 (2005) 20. Reiter, E., Dale, R.: Building Natural Language Generation Systems. Cambridge University Press, Cambridge (2000) 21. Reiter, E., Sripada, S., Hunter, J., Yu, J., Davy, I.: Choosing words in computer-generated weather forecasts. Artificial Intelligence 67(1-2), 137–169 (2005) 22. UCR, Uniform Crime Reports, http://www.fbi.gov/ucr/ucr.htm 23. VOSclim, http://www.ncdc.noaa.gov/oa/climate/vosclim/vosclim.html