INTERNATIONAL JOURNAL OF INTELLIGENT CONTROL AND SYSTEMS VOL. 13, NO. 3, SEPTEMBER 2008,214-221
Using the Wavelet Transform in an Indirect Predictive Approach to Monitor the Surface Quality in Grinding Lotfi NABLI, Mohamed Walid SASSI and Hassani MESSAOUD Abstract- Production systems are currently under high constraints of availability, productivity, quality and flexibility. Therefore, it is a necessary to monitor and to keep operational the entities of the manufacturing process. In this paper, we are interested in solving some problems with the temporal component, like the periods to change used tools, in order to optimize the tasks on line. For this reason, a set-up of indirect predictive monitoring strategy online has been realized to followup the evolution of surface quality of the workpiece. In fact, the detection of the workpiece state after grinding in real time can help to avoid production downtime during the quality control, exhaustive damage of machined quality workpiece and machining system. In addition, a frequent change tool or plate not monitored induces additional costs. In this context, several studies have been conducted to propose methods and techniques for monitoring surface quality of the machined workpiece. In the most of cases, the developed approaches have used indirect measures of the state of the cutting tool. The measured signals will be analyzed later by the different techniques of signal processing to extract the information about the state of the cutting tool. In second stage, a correlation between the state of the cutting tool and the machined surface quality is established. However this double treatment can generate errors which can be at the origin of a divergence between the acquired signal by the sensor and the real state of the surface quality. It is in this context that the work presented in this paper is to develop a unique treatment to establish a direct correlation between the signals obtained by a sensor of cutting force in grinding and the surface quality of the workpiece. The wavelet decomposition is used in this paper to treat these signals. Index Terms—Indirect monitoring, Detection, discrete wavelet transform, grinding, the cutting force in grinding
defects that constitute the diagnostic phase. This type of monitoring is commented by Racoceanu [2] as the traditional monitoring. Racoceanu treated another type of monitoring called the dynamic monitoring also named predictive. As for the traditional monitoring, the predictive monitoring is composed of predictive detection (dynamic) and the predictive diagnosis, also called prognosis. The first phase consists in predicting a future failure. In other words, the aim of predictive detection is to detect degradation instead of a failure and second is to identify the causes and to locate the component that involves a particular degradation. Our target is to identify the degradations, related to the qualitative or quantitative variation of intrinsic aptitudes of a grinding process. This identification is carried out by the analysis of the deviations on the surface quality of the products. Nabli [3] presented in its work a systemic analysis of the monitoring function on which we will base ourselves for the indirect predictive monitoring. 2. A SUGGESTED MONITORING APPROACH In general, a good monitoring approach is based on four principal components: the follow-up of system evolution by extraction signals that are pertinent to the monitoring, the detection of the drifts, the diagnosis and prognosis (Fig1). External data
1.
INTRODUCTION
Actually, it is essential that the performances, the indicators and the characteristics of the system are monitored in order to detect any abnormal operation. Achieving this objective requires the enhancement of the monitoring function in industry. Indeed, in the context of preventive conditional predictive maintenance, the basic principle of monitoring is to evaluate the behaviour of a degraded system by monitoring the disruption generated on the products. In this context, we present a set of the means used in monitoring to observe the state of the quality of the machined surface (in real time) in order to cope with the alias of the system during the grinding process. Generally, monitoring function is defined by Basseville [1] as a combination of two phases: detection and diagnosis; the first is based on the acquisition of the data sensors from the system and provides to the operator more or less elaborate information according to the detection system. The second phase includes the location and identification of Manuscript received November 15, 2007; revised March 11, 2008. This work was supported by the National school Engineers of Monastir, Unit of Automatic, Signal processing and Imaging (ATSI). Nabli Lotfi (e-mail:
[email protected]), Sassi Mohamed Walid (e-mail:
[email protected]) and Massaoud Hassani (e-mail:
[email protected]) are with Unit of Automatic, Signal processing and Imaging (ATSI), National school Engineers of Monastir, Road of Kairouan, Monastir 5000, Tunisia. (corresponding author, phone: 0021698503487; e-mail:
[email protected])
System evolution Data filtered
Drift detection Brutal Deviation
Symptom
Diagnosis
Prognosis
Defaulting Elements Degradations Fig. 1. A global approach for monitoring
In majority of work the follow-up of system evolution is divided into two stages; in the first step, to extract information concerning the state of a cutting tool from the signals taken on sensors and in the second step to establish a correlation between the state of the cutting tool and the surface quality of the machined workpiece. In the case of grinding process, several techniques were developed in the literature in order to follow-up the system evolution. These techniques are based on: Intelligent system
INTERNATIONAL JOURNAL OF INTELLIGENT CONTROL AND SYSTEMS, VOL. 13, NO. 3, SEPTEMBER 2008 215
[4,5 and 6], soundd emission [7,88] and vibratioon [9]. Mokbeel and Makksoud [10], Suusic and Grabeec [11], applieed the techniqque of the acoustic a emisssion to show that t we can usse it to monitoor the state of the grinnding stone diamond durring the ceraamics o hand, thhe establishmeent of a correllation grindding. On the other betw ween the state of the grindinng stone and the surface quuality makee it possible to t use this tecchnique like indirect i monittoring meanns of the surfaace quality. Monnitoring by inntelligent systtems is the subject s of sevveral studiies. Lezanski [12] used thhe neural nettworks and fuzzy fu logicc for the monnitoring of thee state of the grinding stonne in exterrnal cylindrical grinding. This T system has h an advanntage whenn the numberr of variabless of entry is important, buut it preseents a limitation comparedd to the neural networks from f the point p of view reliability r of innformation. Hasssui et al. [13]] showed that the quadratic average off the signaal of vibrationn of the machhined part preesents the weaar of the grinding g stonee. They exam mined in anothher work [14]] the capaacity of the siggnal of vibratiion to follow the change off the roughness of surfa faces of the machined m surfaace. Howeverr this doubble treatment can generate errors that caan be at the orrigin of a divergence beetween the acqquired signal by the sensorr and the real state of the surface quallity (Fig 2).
Monitoring Techniques c currently used
Doublee Treatmeent
Highh risk of e errors
Fig.. 2. The follow-upp of system evoluution
The surface qualitty obtained byy this processs depends on some param meters such as: a cutting foorce, absorptivve power andd the state of the grindding stone. The cutting foorce in grindiing is brokken up into twoo principal com mponents: norrmal grinding force Fn annd tangential grinding forcce Ft. Indeed, it was shownn that the normal compponent has an a influence upon the suurface deforrmation and roughness off the workpieece, the tangential compponent controls the power consumption, c the heat flux at the contaact zone between the grindiing wheel and the workpiece, the gradiient of the reesidual stress and the weaar of the abrrasive grainns [15]. In thiis paper, the monitoring m appproach consists in deveeloping a sinngle treatmennt able to establish e a direct d correelation betweeen the measurred signals obbtained by a sensor of cuutting force of type Kistller 9257B in grinding andd the micro-geometricall quality of the surfaces finished byy this proceess. Then, in the t case of thee detection of a drift on the level of measurement, m d decline in thee quality micrro geometry of o the surfaace, we suppoose that it is reelated to the state s of the cuutting tool. We define in this casee a measurem ment indicatoor of perfoormance whicch is compared to the allowable a inteervals repreesenting the surface qualityy, in order to detect degraddation in the state of the cutting c tool. The tool most used for thhe treatment of the signal iss the Fourrier transform m. Thus, the siignal can be transformed from f the time domainn to the freequency dom main. Often, the c be easily seen in thee time-domainn can inforrmation that cannot be seeen in the freqquency domain. For a non--stationary siggnal,
the signal param meters (frequenncy content etc.) evolve over time. The standaard Fourier Transform iss not useful for yzing the signnal, like our caase. It is very difficult to teell us analy when n detecting degradation d inn the state off the cutting tool from m the frequenccy domain. Inn recent year, another approoach, calleed Wavelet Transform, was develop ped in orderr to deco ompose the siignal into vaarious compon nents at diffeerent time windows annd frequencyy bands [16, 17 and 18]]. In hining, this teechnique was applied for th he detection of the mach cutting tool failurre, especially tool breakagee [19, 20], andd for a of maachine tool vibbration. the analysis 2.1 The T discrete wavelet w transsform The wavelet transform off a signal is defined as a the integ gral over timee of multtiplied by the scaled and shhifted versiions of the waavelet functionn . This transform generates g coefficients C (a, b) called “The ollows [16]: waveelet coefficiennts” that are exxpressed as fo ,
(1)
√
wherre a is the scalling parameter and b the sh hifting parameter. For the numericaal signals , we use the discrete waavelet follows [16]: transsform which is defined as fo C j,k C a,b \a 2j, b k2j (2) The wavelet coeffficients C j, k represent th he amplitudes of o the mposition of the signal; these waveelet used inn the decom coeff fficients can be b divided intto two parts: the approxim mation coeff fficients (cA) and the detaail coefficients (cD). By using thesee wavelet coefficients, c we can reb build the oriiginal signaal . Thesse coefficientts can be exp pressed as foollows [16]:: cAjj= ∑ wherre
,
cDj Dj= ∑ wherre
∑
,
reppresents the sccale function. ∑
, ,
(3)
(4)
reppresents the w wavelet functio on.
The index j repreesents the levvel of the deccomposition in i the t Thhe choice of the t suitable leevel j discrrete wavelet transform. depeends on the leength of the ssignal and thee task to be caarried out. On each leveel j, we build the approxim mation called Aj by ng account off the “low freqquencies” of the t preceding level takin of the t approxim mation and the detail called Dj which w correesponds to thee “high frequeencies”. (Fig 3) 3 f(n) D1(n)
A1 1(n)
D2(n)
A2(n)
D3 3(n)
A3(n)
Fig 3. 3 Structure of thee signal decompo osition
This decompositioon can be iterrated, the app proximations being b deco omposed successively: this is called the multilevel waavelet deco omposition.
216 Nabli et al: Using the Wavelet Transform in an Indirect Predictive Approach to Monitor the Surface Quality in Grinding
2.2 Statistical S An nalysis The statistics are used forr analyzing annd interpretinng the data contained in the signals. At A the beginniing, we note that t it s is difficult to estaablish a correllation between the rough signal t cutting force and the roughnness of grinnding of the surfaaces. After the decompoosition of thhe signal, seeveral statisstical parametters are used and compareed to highlighht the existtence of this correlation. The parameeters used aree the averaage, the standdard deviationn, the absolutte deviation of o the mediian and of thee average. Theese parameterrs are describeed by the following f equaations:
a cooling with thhe air) before carrying out the grinding tests. The material used is a stainless steel austenitiic X5CrNiMo18-08. The general algorithm a of tthis transformaation is repressented g 4. in fig Experimental design d completee
Acquisition off grinding forcee siggnal
2.2.11. The averagee F a data seet, the averagee is describedd as the sum of For o all the observations o d divided by thee number of observations. o I the In case of the siggnal of grindding force, the average was t detail coeffficients of thee maximum leevel j estabblished from the (giveen according to the signaal size). It is expressed byy the folloowing expressiion: ∑ ( (5)
Signal decom mposition with Discrete Wavvelet Transform
Statisticaal Analysis
2.2.22. The standarrd deviation The standardd deviation is measured from the average diffeerence betweeen the valuess of the dataa in the set. It is expreessed as follow ws: ∑
The roughness measures
Establishmentt of correlation between rougghness and the signal of cutting force
(6)
2.2.33. The absolutte deviation The absolute deviation of an element of o a data set is i the absolute differencce between thhis element and a a given point. p Typiically the valuue of the poiint from whicch the deviatiion is meassured, is the value v of eitheer the averagee or the median of the data d set. The average absollute deviationn of a set {cD Dj (1), cDj (2) ( ... cDj (N)} is expressedd by: ∑ (7)
Validdation Fig. 4. Algoriithm for the decoomposition of the grinding force.
Th he experimentss were realizedd according to o an experimenntal deesign of 54 tessts for which tthe factors and d their associatted leveels are given inn the grindingg stone used is a type of 95A A60H
Wheere cDj (K) is an element off the detail cooefficients at leevel j and is the meaasurement of the t average orr the median of o the detaiils coefficientss at the level j. j 3.
Table 1. Summary S table off the factors and their t levels
EXPERIM MENTAL PROT TOCOL AND AL LGORITHM OF F W WAVELET DEC COMPOSITION N
The machine used T u is a planne grinding machine m SR RT600 R havinng two autom mated axes (vertical ( and horizontal) and a a transsverse axis at constant speeed. The fluid of o lubricationn used is the “SMILAX 89” (concenttration 20% and a 80% of water). w t stone wass ensured by a single diam mond. The dressing of the Trannsverse speed correspondinng at the speeed of risingg was varieed by using a motor step by b step. To obbtain the signaals of grindding force, a dynamometer Kistler 9257B 9 with three compponents was used u to measuure the three components of o the forcee. This dynam mometer has a high rigiditty and thereffore a high frequency; the high ressolution makkes it possible to e The siggnal emitted by b the meassure the least variations of effort. dynaamometer is amplified ussing a chargee amplifier which w transsforms the siggnals of the dyynamometer innto output volltages proportional to thhe forces appplied. Then, these efforts are acquuired on a PC. The samples are prismatic form of dimension 15 × 15 × 50mm m and have undergone u a heat treatmennt of relievving (maintainns with 1100°°C during onee hour followeed by
Leevel 1 Leevel 2 Leevel 3
Grain off the grinding stonee # 60 60 60
Table speed [m/mn] Vw
Speed of raising [m/s] Vd
1 8 14
8.2 4 2
Depth of cut [µm] a 5 10 20
Nuumbers o cut of Np 10 20 -
In th his study, the discrete waveelet transform m employs thoose of Daub bechies [19] for f the multileevel signal decomposition of o the cuttin ng force. 4..
RESULTS A AND DISCUSSIO ON
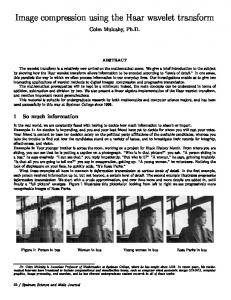
In I this study, we record thee 54 tests (sig gnals) starting from the normal n compoonent Fn of thee grinding forcce (considerinng this comp ponent has ann influence on the surface deformation d annd the surfaace quality of the rectified pparts). Fig 5 sh hows the signnals of somee tests n°5-11-49 obtaiined under various grinnding cond ditions. We note n that durring grinding g, the presencce of several peaks in thhe signals whiich are not constant and duue to a a greatt variation of amplitude.
INTERNATIONAL JOURNAL OF INTELLIGENT CONTROL AND SYSTEMS, VOL. 13, NO. 3, SEPTEMBER 2008 217
signal. In addition, this wavelet is orthogonal what makes it possible to make a multi level analysis of the various signals of the cutting force. The scale function and the wavelet function for db3 are shown in fig 6. (a) Scaling function
(b) Wavelet function
Test N°05: Vw: 1 m/mn; Vd: 8,2 m/s; a: 20µm; Np:10. Fig. 6. The wavelet db3 (a) the scaling function
; (b) the wavelet function
Fig 7 shows the structure of the signal decomposition in several levels. We choose test N°17 as example, the sample size (n) during the recording of this signal is 5000. According to the sample size, we can reach the level 9 in the decomposition of this signal without any loss of information. Beyond this level, there has a risk which we cannot find information concerning the surface quality of the rectified parts. .
cD1
cA1
cD2
cA2
cD3
cA3
cD4
cA4
cD5
cA5
cD6
cA6
Fig. 5. Examples of cutting force signals measured under various grinding conditions
cD7
cA7
These variations do not indicate anything like useful information on quality rectified coins, for example starting from the signals of fig 5 it is difficult to know, after grinding, if the coins have same surface quality or not. Indeed, these signals indicate only the point of engagement of the tool in the matter which is translated by an increase in the signals and the point of release which is represented by a reduction. To draw more information starting from these signals, a treatment is necessary in this case. The characteristic of these signals is that they are not stationary. As the traditional techniques are not able to treat this kind of signals, we chose to use the technique of the discrete wavelet transform. In our case, Daubechies wavelet of order 3 (db3) is used since it detects better the abrupt changes of frequency in the
cD8
cA8
cD9
cA9
Test N°11: Vw: 1 m/mn ; Vd: 4 mm/s; a : 20µm ; Np :10.
Test N°49: Vw: 14 m/mn; Vd: 2 m/s; a: 5µm; Np:10.
Fig. 7. Structure of the signal decomposition of cutting force
Fig 8 shows an example of signal decomposition of a cutting force; which is the test n° 17 (Parameters of cut: Vw: 1 m/mn; Vd: 2 m/s. a: 20µm Np: 10).
218 Nabli et al: Using the Wavelet Transform in an Indirect Predictive Approach to Monitor the Surface Quality in Grinding
(a)
(b)
Fig 8. Test N°17
(c)
(a) The cutting force signal (Parameters of cut: Vw: 1 m/mn; Vd: 2 m/s; a: 20µm; Np:10) (b) The coefficients of details at different levels (c) The coefficients of approximations at different levels. Let’s note that the approximations indicate the points of input/output of the tool in the workpiece, they correspond to the low frequencies of the components signal of grinding force. The variation of the signals due to the difference between the surfaces quality, if it is detectable by the wavelet decomposition can appear only on the coefficients of details. Indeed, the variation of the coefficients of approximation seems to be controlled only by the signal amplitude. Thereafter, we will carry out a statistical analysis of the coefficients of details in order to establish a correlation, if there exists,
between the statistical parameters and the micro geometrical characteristics of rectified surfaces (Rt and Ra). “Rt” characterizes the most important difference in level between the highest summit of a peak and the lowest of a hollow realized by the grinding stone in contact with surface and “Ra” represents the arithmetic mean of the absolute values of the differences between the peaks and the hollows. For that, these measurements will be recorded independently of the signals of cutting force with a roughmeter of stylet Hommel Tester T1000. The results are represented in table 2.
INTERNATIONAL JOURNAL OF INTELLIGENT CONTROL AND SYSTEMS, VOL. 13, NO. 3, SEPTEMBER 2008 219
Table 2. The calculation of the statistical parameters and the roughness parameters #: Cut grains of the grinding stone; Vw: Speed in advance [m/mn]; Vd: Speed of raising [m/s] a: Depth of cut [µm]; Np: Numbers of cut; Rt: Roughness [µm]; S: standard deviation of the coefficients of details
Test N°
#
Vw
Vd
a
Np
Rt [µm]
14 13 1 2 7 8 9 10 16 3 4 15 5 17 18 11 6 12 32 50 19 31 49 25 38 20 43 33 27 26 44 28 52 34 21 30 36 22 39 45 29 35 37 51 24 23 40 46 54 47 53 48 41 42
60 60 60 60 60 60 60 60 60 60 60 60 60 60 60 60 60 60 60 60 60 60 60 60 60 60 60 60 60 60 60 60 60 60 60 60 60 60 60 60 60 60 60 60 60 60 60 60 60 60 60 60 60 60
1 1 1 1 1 1 1 1 1 1 1 1 1 1 1 1 1 1 8 14 8 8 14 8 14 8 14 8 8 8 14 8 14 8 8 8 8 8 14 14 8 8 14 14 8 8 14 14 14 14 14 14 14 14
2 2 8,2 8,2 4 4 4 4 2 8,2 8,2 2 8,2 2 2 4 8,2 4 2 2 8,2 2 2 4 8,2 8,2 4 2 4 4 4 4 2 2 8,2 4 2 8,2 8,2 4 4 2 8,2 2 8,2 8,2 8,2 4 2 4 2 4 8,2 8,2
5 5 5 5 5 5 10 10 10 10 10 10 20 20 20 20 20 20 5 5 5 5 5 5 5 5 5 10 10 5 5 10 10 10 10 20 20 10 10 10 20 20 5 10 20 20 10 10 20 20 20 20 20 20
20 10 10 20 10 20 10 20 20 10 20 10 10 10 20 10 20 20 20 20 10 10 10 10 20 20 10 10 10 20 20 20 20 20 10 20 20 20 10 10 10 10 10 10 20 10 20 20 20 10 10 20 10 20
2,43 2,20 3,10 3,30 3,10 3,30 3,40 4,00 4,09 4,63 4,83 3,11 4,73 4,26 4,30 4,26 6,36 4,30 4,32 4,64 5,53 4,45 4,55 4,63 9,64 9,00 5,40 5,18 5,50 5,33 5,56 5,86 6,40 6,38 11,12 6,70 6,86 11,60 12,90 6,46 6,73 6,26 8,54 6,96 9,60 8,12 13,20 8,30 8,53 10,91 10,41 11,65 15,80 17,30
Statistical parameters
Ra [µm]
Roughness parameters
Factors
cD j
S
Median AD
Average AD
0,3 0,6 0,43 0,5 0,9 0,5 0,4 0,4 0,4 0,7 0,8 0,33 0,87 0,5 0,63 0,5 0,63 0,53 0,57 0,73 1,17 0,5 0,7 0,67 1,73 1,37 0,9 0,73 0,8 0,7 0,97 1 0,97 0,77 1,4 1,57 1,67 1,87 3 1,23 1,33 1,17 1,83 0,8 2,9 2 3,07 1,4 1,27 1,4 0,93 1,47 3,37 3,47
0,3651 0,2197 0,0194 - 0,9244 - 0,1735 - 0,3276 0,0675 - 0,0524 1,823 1,481 - 0,147 - 2,294 2,603 - 1,34 - 2,684 - 0,8826 - 1,89 2,477 - 3,131 0,3138 1,994 6,076 - 0,2802 5,886 - 7,002 - 4,044 - 4,783 9,96 10,09 - 1,172 2,482 6,818 3,75 - 6,806 - 7,748 4,592 13,2 - 7,526 - 2,842 - 14,68 17,24 16,65 7,699 3,627 - 0,9332 1,206 6,14 3,187 - 19,79 - 27,33 - 17,02 4,766 22,05 18,86
1,735 2,186 2,542 2,773 2,885 3,061 3,962 4,054 4,197 4,258 4,646 5,457 7,523 7,964 8,223 9,093 9,121 10,06 10,08 11,09 11,34 12,54 14,09 15,09 19,64 19,72 20,46 21,19 22,22 23,04 25,44 29,51 30,59 30,77 31,74 32,88 33,85 34,95 35,57 37,92 38,57 39,02 39,61 39,96 42,81 53,29 56,26 57,1 58,12 76,26 83,66 84,93 122,6 124,4
0,6841 0,7932 0,5146 0,6866 1,075 0,536 1,276 0,7797 0,8873 1,912 1,902 1,053 2,679 2,61 3,208 2,769 2,164 3,127 0,5962 0,8478 0,3489 3,12 0,4159 3,736 0,7587 0,7347 0,6332 2,019 5,603 0,858 0,8318 0,6258 0,4937 0,847 1,22 2,359 1,963 1,005 1,617 1,036 6,046 8,625 0,8629 1,153 2,277 1,553 1,164 1,487 1,226 2,131 2,316 1,871 0,746 1,29
1,132 1,458 1,492 1,926 1,75 1,743 2,428 2,521 2,878 3,026 2,996 3,945 5,656 5,019 6,166 5,368 6,397 7,283 7,127 5,676 6,311 9,337 7,16 9,621 13,77 13,36 11,4 13,5 16,22 12,53 13,48 16,14 16,59 21,48 22,22 18,47 22,79 23,95 18,28 26,04 25,16 25,75 21,71 21,27 24,54 27,6 29,33 29,29 39,78 54,36 45,56 43,39 67,3 67,92
The curves in fig 9 represent the roughness parameters Ra and Rt according to the number of the grinding tests.
Interval I Interval II
Interval III
Interval IV
Interval V
Interval VI
220 Nabli et al: Using the Wavelet Transform in an Indirect Predictive Approach to Monitor the Surface Quality in Grinding
(a) The Average surface roughness (Ra) at different cutting conditions
Ra (µm)
4 3 2 1 0
1
4
10 13 16 19 22 25 28 31 34 37 40 43 46 49 52
7
Standard deviation
(c) The Standard deviation of detail coefficients at last level under different cutting conditions 140 120 100 80 60 40 20 0 1
5
9
13
17
21
25
Test N°
20
10,000
10
Mean
Rt(µm)
30
15,000
5,000 9
0 -101
5
9
13
(a) Mean absolute deviation of detail coefficient at last level under different cutting conditions Mean absolute deviation
49
53
17
21
25
29
33
37
41
45
49
53
-30
Fig. 10. Representation of the statistical parameters
After the calculation of the different statistical parameters, different curves representing these indices are plotted for the various tests (fig 10).
80 60 40 20 9
45
Test N°
Fig. 9. Representation of the roughness parameters
5
41
-20 13 17 21 25 29 33 37 41 45 49 53 Test N°
0 1
37
(d) The average of detail coefficients at last level under different cutting conditions
20,000
5
33
Test N°
(b) The surface roughness (Rt) at different cutting conditions
1
29
13
17
21
25
29
33
37
41
45
49
53
Test N°
The comparison between the statistical parameters and the roughness parameters, given by fig 9 and 10, shows that the curves of the standard deviation and the average deviation (Fig 10.a and 10.c) are sensitive to the variations of roughness surface Rt (Fig 9.b) for the majority of the tests carried out. Indeed, an increase in the surface roughness is followed by an increase in the standard deviation and vice versa in the case of the reduction. The standard deviation shows a sensitivity to the variations of the grinding force signal which are due to the variations of the surface roughness Rt. The results of these experiments are represented in table 3. These results are validated for 70% of the tests on workpiece under various grinding conditions (table 2). Table 3. Variation of the standard deviation of the coefficients of details of cutting force signal compared to measurements of the surface roughness Rt
Median absolute deviation
(b) Median absolute deviation of detail coefficients at last level under different cutting conditions
Intervals
10 8 6 4 2 0 1
5
9
13
17
21
25
29
33
Test N°
37
41
45
49
53
I II III IV V VI
Standard deviation “S” 1.5 2.5 2.5 4 4 20 20 30 30 40 50 60
Rt (µm) 2 3 4 5 6 8
3 4 5 6 7 9
INTERNATIONAL JOURNAL OF INTELLIGENT CONTROL AND SYSTEMS, VOL. 13, NO. 3, SEPTEMBER 2008 221
5. CONCLUSION The work presented in this paper proposes an indirect predictive monitoring method to predict in real time the surfaces roughness (Rt) of the rectified parts. As it is difficult to measure this surface parameter in real time, it is often given in an indirect way through the measurement of another parameter more easily measurable. In the literature, we found several techniques in the phase of the follow-up of system evolution like the use of sound emission, vibration signals or electric output consumed by the process. However, these techniques do not give access to necessary information on the value of the surface roughness. For this reason, a methodology is developed which is based on the analysis of the cutting force signals by the wavelet transform and the establishment of correlation between roughness (Rt) and the coefficients of details. The follow-up of system evolution obtained by the exploitation of the wavelet transform made it possible to achieve a double target: the follow-up of the deterioration of the quality of the rectified piece, and the evaluation of the cutting tool state during the grinding process. The most outstanding results of this study can be summarized as follows: 9 The Daubechies wavelets of order 3 are largely necessary to carry out the multi level analysis of the cutting force signals in grinding. 9 The variation of the signals caused by the micro geometrical state of rectified surfaces appears in the coefficients of details. 9 The statistical indices like the standard deviation and the average deviation vary in the same way that surface roughness (Rt) 9 The roughness values (Rt) predicted from the cutting force signals correspond in 70% of the cases to the measured values on the machined piece under the tests conditions of the experimental design.
ACKNOWLEDGEMENT The authors would like to thank the comments provided by the anonymous reviewers and editor, which help the authors improve this paper significantly. Dr. khaled KOUISS (PhD in French Institute of Advanced Mechanics) for his helpful comments. REFERENCES [1]
[2]
[3]
[4]
[5]
M. Basseville, M.O. Cordier, « Surveillance et diagnostic de systèmes dynamiques : approches complémentaires du traitement du signal et de l’intelligence artificielle », INRIA report n °2861, 1996. D. Racoceanu, « Contribution à la surveillance des Systèmes de Production en utilisant les Techniques de l’Intelligence Artificielle », Habilitation thesis, 2006. L. Nabli, « Surveillance Préventive Conditionnelle Prévisionnelle Indirecte d’une Unité de Filature Textile : Approche par la Qualité », PhD thesis, University of Sciences and Technologies of LILLE, 2000. L. Nabli, A. Toguyeni, E. Craye, M. Annabi, “A monitoring method based on fuzzy sets application: the follow-up of a thread quality in a spinning unit”, Computational Engineering in Systems Applications, IMACS-IEEE, Vol.3 (1998) 650-655. F. Ly, A. Toguyeni, E. Craye, “A detection approach applied to production flows deviation in flexible manufacturing systems”, Computational Engineering in Systems Applications, IMACS-IEEE, Vol.3 (1998) 95-99.
[6]
[7]
[8]
[9]
[10]
[11]
[12]
[13]
[14]
[15]
[16] [17] [18] [19] [20]
F. Ly, A. Toguyeni, E. Craye, “A Real Time diagnosis method of production flows deviation, in Flexible Manufacturing Systems”, 4th Workshop on Discrete Event Systems (1998) 343-348. H.Y. Kim, S.R. Kim, J.H. Ahn, S.H. Kim, “Process monitoring of centerless grinding using acoustic emission”, Journal of Materials Processing Technology 111 (2001) 273- 278. H.K. Tönshoff, M. Jung, S. Männel, W. Rietz, “Using acoustic emission signals for monitoring of production Processes”, Ultrasonics 37 (2000) 681-686. T. Yamamoto, I. Fukumoto, H. Kinjo, “Process sensing of abnormal grinding condition caused by loading chips using ADF”, International Journal of Japan Society for Precision Engineering 26 (4) (1992) 296– 301. Dr. Amin, A. Mokbel, Dr T.M.A. Maksoud, “Monitoring of the condition of diamond grinding wheels using acoustic emission technique”, Journal of Materials Processing Technology 101 (2000) 292-297. E. Susic, I. Grabec, “Characterization of the grinding process by acoustic emission”, International Journal of Machine Tools & Manufacture 40 (2000) 225–238. P. Lezanski, “An intelligent system for grinding wheel condition monitoring”, Journal of Materials Processing Technology 109 (2001) 258-263. A. Hassui, A.E. Diniz, J.F.G. Oliveira, J. Felipe Jr., J.J.F. Gomes, “Experimental evaluation on grinding wheel wear through vibration and acoustic emission”, Wear 217 (1998) 7–14. A. Hassui, A.E. Diniz, “Correlating surface roughness and vibration on plunge cylindrical grinding of steel”, International Journal of Machine Tools & Manufacture 43 (2003) 855- 862. N. B. Fredj, R. Amamou, “Improved method for grinding process control based on neural network”, Advanced Manufacturing Technology 31 (2006) 18-23. A. Graps, «An introduction to wavelets», IEEE Computational Science and Engineering, vol.2, num. 2, 1995. http://perso.wanadoo.fr/michel.hubin/physique/signal/chap_si1.htm http://www.wavelet.org B.Y. Lee, Y.S. Tarng, “Milling cutter breakage detection by the discrete wavelet transforms”, Mechatronics 9 (1999) 225-234. B.Y. Lee, Y.S. Tarng, “Application of the Discrete Wavelet Transform to the Monitoring of Tool Failure in End Milling Using the Spindle Motor Current”, International Journal Advanced Manufacturing Technology 15 (1999) 238-243.
Lotfi NABLI received his Mastery of Sciences and DEA from ENSETTunis - Tunisia in 1989 and 1991 respectively. In 2000, he obtained his doctorate degree in Industrial automation: Automatic and Industrial computing from University of the sciences and the technologies of Lille France. He is currently Assistant professor of Electrical Engineering at National School of Engineers of Monastir (ENIM)- Tunisia and a Master of conference candidate. His research interests include Modeling, Control, and Monitoring and command Manufactory systems. Mohamed Walid SASSI is a Ph.D. student in Electrical Engineering at the research group on Automatic, Signal Processing and Imaging at National School of Engineers of Monastir (ENIM) - Tunisia. His actual research topics are Modeling, Control, and Monitoring Manufactory systems. Mail:
[email protected]