Using three-dimensional geological mapping methods to inform sustainable groundwater development in a volcanic landscape, Victoria, Australia Bruce Gill, Don Cherry, Michael Adelana, Xiang Cheng & Mark Reid
Hydrogeology Journal Official Journal of the International Association of Hydrogeologists ISSN 1431-2174 Hydrogeol J DOI 10.1007/ s10040-011-0757-7
1 23
Your article is protected by copyright and all rights are held exclusively by SpringerVerlag. This e-offprint is for personal use only and shall not be self-archived in electronic repositories. If you wish to self-archive your work, please use the accepted author’s version for posting to your own website or your institution’s repository. You may further deposit the accepted author’s version on a funder’s repository at a funder’s request, provided it is not made publicly available until 12 months after publication.
1 23
Author's personal copy
Using three-dimensional geological mapping methods to inform sustainable groundwater development in a volcanic landscape, Victoria, Australia Bruce Gill & Don Cherry & Michael Adelana & Xiang Cheng & Mark Reid Abstract This study investigated the use of three-dimensional (3D) geological methods to provide better groundwater resource estimates for the Spring Hill area in central Victoria, Australia. Geological data were gathered in 3D geological software, which was utilised to derive fundamental dimensional parameters of the groundwater system in the study area. Mining industry software and hydrogeological methods were combined to give volumetric determinations of the basalt aquifer that were used to improve estimates of the groundwater resource. The methods reduce uncertainty about the physical attributes of the aquifer systems and greatly improve conceptual understanding of their behaviour. A simple numerical water-balance model was developed to refine the estimates of aquifer volume and fluxes to approximate observed water-level behaviour in the area. This enabled a much better comparison of groundwater resource use to the natural inputs and outputs for the area. A key conclusion was that the main issues for sustainable development and use in the study area are more to do with the physical aspects of the aquifer system, rather than simply the volume of water pumped. Visualisations of the area’s hydrogeology also
Received: 29 October 2010 / Accepted: 17 June 2011 * Springer-Verlag 2011 B. Gill ()) Future Farming Systems Research, Department of Primary Industries, Ferguson Road, Tatura, Victoria, Australia 3616 e-mail:
[email protected] D. Cherry : M. Adelana : M. Reid Future Farming Systems Research, Department of Primary Industries, Epsom, Victoria, Australia 3554 X. Cheng Future Farming Systems Research, Department of Primary Industries, PO Box 4166, Parkville, Victoria, Australia 3052 B. Gill Environmental Geoscience, La Trobe University, Bundoora, Australia 3086 Hydrogeology Journal
provide improved hydrogeological understanding and communication for groundwater users and administrators. Keywords Australia . Groundwater management . Threedimensional geological mapping . Sustainable yield . Volcanic aquifer
Introduction Three-dimensional (3D) geological mapping methods for hydrogeological purposes are now becoming more widely used. A growing global community of users is exploring how to exploit 3D computational and visualisation methods used by the minerals and hydrocarbon geologists for groundwater purposes. The evolution of 3D visualisation of geological information has been worked on by many groups around the world for many years (e.g. Turner 1991; Berg et al. 2009). Key information, including a comprehensive coverage of the history and current activities in this field, is provided by the Illinois State Geological Survey (2011) website (McKay 2011). Robins et al. (2004) discuss the role of 3D visualisation of groundwater systems as an analytical tool preparatory to numerical modelling. Through a couple of case studies, they demonstrate its role and value. A key assertion they make is that it is in the initial conceptualisation stage that most problems arise, so if the conceptual model of the physical configuration and behaviour of the aquifer system is wrong, subsequent numerical modelling will also be incorrect. They also found that a 3D approach could be of assistance in conceptual model preparation by providing a check on the logic of the hydrogeological conceptualisation. This is especially the case if the 3D conceptual model is coupled with a simple water-balance model. Bredehoeft (2002) likewise makes a similar finding that the conceptual model is the foundation of any numerical groundwater model. With advances in digital technology and a growing base of users/scientists wanting to see their subsurface project in a 3D portrayal, improved conceptualisation of complex geological settings can aid in better understandings of an otherwise invisible realm. Other key references that describe case studies on how 3D mapping and visualisations have DOI 10.1007/s10040-011-0757-7
Author's personal copy been used to improve hydrogeological characterisation include: Artimo et al. (2003), Ross et al. (2005) and Nury et al. (2010). This study has sought to further explore how these methods can be used in a practically focussed study that aims to improve the fundamental groundwater resource assessment of the study area, support subsequent technical analysis and provide relevant information for groundwater resource-management processes. The proposition this study tests is that 3D hydrogeological methods provide significant advantages when conducting groundwater resource assessments, which lead to improved resource-management outcomes. By applying these new tools and methods to a case study area, this report describes what was found in regard to the aforementioned proposition. The report explores the use of the 3D geological data sets to build visualisations and virtual constructs of the aquifers in the study area. The 3D software is then used to calculate the size of the aquifers and the area of critical cross sections to estimate the quantities of water within and moving through the study area. The size of the aquifer provides the core component of a water-balance model, to which the recharge and loss volumes then relate. This provides a better context in which to understand the behaviour of the aquifer against which the sustainability of groundwater usage in the study area can be considered.
Background Water resource pressures facing south-east Australia A key reason for exploring the potential of 3D geological groundwater-resource-assessment methods is the increasingly water-stressed situation that affects much of Australia (NWC 2006; Kiem and Verdon-Kidd 2010). There is strong interest in testing whether 3D-based hydrogeology methods can yield more robust, re-useable and evolvable hydrogeological results that enable groundwater resources to be better managed, especially during water-stressed times. There is also an ever-pressing need to improve understanding of surface water and groundwater interactions to support a more precise total water-resource-management framework. Further interest lies in the ability to integrate 3D geological and hydrogeological conceptual-model development with numerical modelling packages to improve predictive capability to respond to future climate variability challenges. Artimo et al. (2003) recognised that developing physically based and numerical models in parallel provides a process of feedback and incremental improvement as the two evolve in tandem. Improved analysis of landscape- and catchment-scale water-movement processes will also give better understanding of other hydrologically driven issues such as land-salinity occurrence, groundwater base flow to streams or protection of groundwater-dependent ecosystems.
Climatic influence on groundwater levels Most of southern Australia has experienced a decline in rainfall over the past decade. Kiem and Verdon-Kidd Hydrogeology Journal
(2010) undertook an extensive review of stream flow and rainfall data across Victoria in order improve understanding of the hydroclimatic change that has occurred in the past decade. They concluded that a step change in annual rainfall was apparent from 1994 onwards. This was caused by a reduced reliability of late autumn rains arising from changes in the frequency and timing of the synoptic weather patterns that drive the Victorian climate. The impact of this step change in rainfall has also manifested in groundwater observation bore records throughout Victoria. Particularly seen in bores installed during the 1980s for land salinity monitoring, the vast majority have recorded a decline in groundwater level corresponding to the reduced rainfall and recharge over the past decade.
State groundwater-resource management processes In Victoria, the state government established there was a need for groundwater management plans in the 1990s, when declining groundwater levels and high development densities became apparent in some aquifers around the state. Recognising that a trigger was required to ascertain where and when management plans were needed, a simple, rapid empirical approach was developed to estimate the available annual resource (DNRE 1996). The term initially used to describe the annual available resource was ‘permissible annual volume’ (PAV), which was essentially analogous to ‘safe groundwater yield’. It was used as the basis for setting initial groundwater pumping limits in Victorian groundwater management areas (GMAs) and identifying where allocations may be in, or approaching, excess. The approach developed to derive PAVs involved several calculations that were based upon the readily available data and geological interpretations of each groundwater management area. As a matter of some urgency, the initial PAV assessments were carried out rapidly, did not seek new data and were relatively simple assessments. An audit (Reid and Cherry 2004) of the PAV values derived for 35 of the 60 GMAs in Victoria, identified a range of issues with both the approach used and the PAV estimates proposed, although it was acknowledged that it provided a starting point for implementing groundwater-management plans around Victoria. A number of over-arching groundwater-management considerations were also identified. These included such things as aquifer definition or inclusiveness, adequacy of GMA boundaries, aquifer storage, groundwater declines, groundwater quality risks, groundwater monitoring and interaction with surface-water bodies and the sea. Overall, the audit identified that the major deficiency was in geological and hydrogeological information upon which to base these calculations. This meant only very low confidence ratings could be applied to the PAV values. The PAV calculations were based on several different methods, but primarily relied upon a determination of the recharge as an analogue for sustainable yield. Many noted practitioners have demonstrated that this principle is incorrect (e.g., Theis 1940; Brown 1963; Bredehoeft et al. 1982; Alley et al. 1999; Sophocleous 2000; Bredehoeft DOI 10.1007/s10040-011-0757-7
Author's personal copy 2002; Kalf and Woolley 2005). They argue that the size of the sustainable groundwater development should instead be based upon how much groundwater can be safely captured by the development. As such, this ‘safe capture’ is not dependent on recharge, but rather on how the aquifer system responds to the development, how long it takes and where the impacts occur (Bredehoeft 2002). It is therefore important to closely monitor and model the aquifer’s response to development and manage the resource in a more flexible manner in tune with the aquifer dynamics. Development can and does in many cases safely exceed average annual recharge by virtue of large aquifer storages, disconnection from streams and a combination of aquifer characteristics and strategic bore development that helps to minimise detrimental impacts on the environment and groundwater resources. The amount of groundwater that can be safely captured, or intercepted, in terms of aquifer and environmental sustainability is influenced by a number of factors to do with aquifer extent, storage and other hydraulic properties. This amount may vary from year to year with climate and the dynamic status of the groundwater system. Although it is considered that ‘safe capture’ should be the key concept upon which to ultimately base groundwater management, it is recognised that a whole-of-aquifersystem water balance is an essential component in understanding sustainable groundwater resource use and the development of a management strategy. A detailed water-balance analysis that assesses the major inputs and outputs to the aquifer storage is necessary not only to gauge the size and annual volumetric potential of the extractable resource but also to help understand the nature of the aquifer, its recharge and discharge processes, its inertia and its connection to sensitive environmental areas and surface-water resources. The PAV audit (Reid and Cherry 2004) revealed an often-incomplete analysis of the water balance, including a deficiency in accounting for hydraulic connection to streams and estimates of through-flow. Most of the attempted through-flow analyses were incomplete in that they did not account for all flow into, or in some cases even within, the GMA aquifer system. These deficiencies underscored the need to build, as complete as possible, renditions of the available geological data for each area upon which the hydrogeological conceptual model can be based. It is against this background that the need for a more complete and reliable method for estimating the groundwater resources of an area was realised. In some parts of the state, local opposition and challenge to the PAVs occurred, with significant criticism being levelled at the technical veracity of the approach employed. After further independent technical analysis, one groundwater management area was successful in gaining an increase of 7,000 million litres (ML)/year in the PAV, whereupon a subsequent auction of the increased volume was held. While the process set in motion by the initial PAV estimation approach was a successful catalyst for establishing groundwater resource-management plans, there has since been little improvement in the ability to define or Hydrogeology Journal
estimate the permissible yield, or as it is termed in Victoria now, the Permissible Consumptive Volume (PCV). It is with this in mind that 3D hydrogeology methods have been developed and tested in the Spring Hill area.
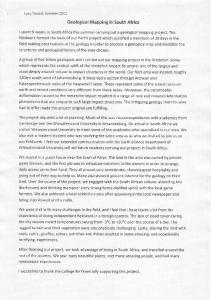
Study area The Spring Hill Groundwater Supply Protection Area (GSPA) is 253 km2 in area and lies at the southern end of the Loddon River catchment in central Victoria, Australia. Figure 1 shows its location in relation to the nearest large town of Creswick, the State of Victoria and the Australian continent.
Geology The geology of the study area comprises an uplifted and dissected Palaeozoic bedrock landscape with the palaeovalleys in-filled with Tertiary-aged sediments overlain or interrupted by a thick sequence of Neogene-aged basalt flows and volcanic eruption points. Figure 2 shows the geology of the study area, with a number of other features also shown such as the observation bore locations (red stars), the four water trading zones within the groundwater management plan area (delineated by the green lines) and the cross section A–A’ (pink line). In more detail, the geology of the study area comprises folded Ordovician age (435–500 million years, Ma) sediments comprising thinly bedded shale and sandstone units that underlie most of the study area (Douglas and Ferguson 1988). These low-grade meta-sedimentary rocks form a poorly transmissive, fractured rock aquifer from which only very small yields can be obtained for stock and domestic purposes. Water salinity is also generally too high for most uses and drilling data nearly always identify a meter or more of clay immediately above bedrock. Evidence indicates that the aquifer has only a minor overall influence on the groundwater in the overlying volcanic sequence and essentially forms the basal confining layer of the GSPA groundwater system. Major orogeny occurred during the Devonian period (345–395 Ma) in the vicinity of the study area, resulting in formation of gold-bearing quartz veins, locally known as “reefs”. Subsequent erosion during the Oligocene–Pliocene period (26–2 Ma) produced gold-bearing alluvial deposits that in-filled the palaeo-valleys of the upper Loddon River catchment. A period of volcanism from around 2 million years to less than 30,000 years ago filled the valleys and covered these alluvial deposits. These deposits of gravel, sand, silt, clay and minor lignite along the valleys were extensively mined for alluvial gold during the 1850s to 1900, where they outcrop in the Creswick area. The deposits were followed under the basalt by the early miners, who coined the term ‘deep leads’ for them. At least 15 eruption points formed small cones in and adjacent to the study area. Scoria, ash and tuff deposits formed in the vicinity of cones, and weathering periods between eruptions are DOI 10.1007/s10040-011-0757-7
Author's personal copy
Fig. 1 The Spring Hill Groundwater Supply Protection Area in the state of Victoria, Australia, which lies on the southern margin of the Murray-Darling Basin watershed
identified as clay layers between basalt flows in many drilling logs. The basalt sequence is up to 100 m thick over the palaeo-valley and the volcanic cones are up to 200 m above the present valley (DME 1983). The volcanic materials form the major aquifer of the study area. Well developed and productive soils cover the basalts, especially around the volcanic cones, where the dominant crop is potatoes.
Drilling data Gold mining commenced in the 1850s, with initial surface working of regolith and alluvial deposits proceeding to deeper reef mining and deep lead mines until the turn of the century. Specifically in the study area, extensive boring (or drilling) through the basalt to locate the deep lead deposits was well documented and of great value in building the 3D geology data set for this study. These historical records, often overlooked in groundwater studies, provide a greater density of bore data than would otherwise be available if the area had not had the gold mineral wealth. While 720 bores have been recorded in the study area, only 200 mining bores and 20 more recent groundwater bores were greater than 50 m deep and had Hydrogeology Journal
adequate records suitable for building the 3D geology model of the study area. This equates to a bore density of approximately two bores per square kilometre.
Groundwater-resource development in the Spring Hill area Expansion of farming followed the decline of gold mining and forest clearing in the district in the 1880s. Potato cropping became a local specialisation due to the presence of suitable soils on the volcanic parent material. Water boring and irrigation-pump-technology developments after the Second World War enabled groundwater to be obtained in sufficient volumes for irrigation use and this enabled the area to become a significant potato farming area (LCC 1980). During the late 1990s, groundwater development had reached sufficient levels to start causing localised seasonal declines in groundwater depth (Fig. 3). Part of this development included development of bores for urban supply, Fig. 2 Map of the study area, showing surface geology, place names, cross section A–A’, the Spring Hill Groundwater Supply Protection Area (GSPA) boundary and the four named zones within the GSPA DOI 10.1007/s10040-011-0757-7
Author's personal copy
Hydrogeology Journal
DOI 10.1007/s10040-011-0757-7
Author's personal copy
Hydrogeology Journal
The study area is at the uppermost end of the Loddon River catchment, which drains northwards into the Murray River. The highest elevations in the area are volcanic cones with elevations ranging from 650 to 700 m above Australian Height Datum (AHD). The land slopes gently to the north, with the north-west corner being about 380 m above AHD. Figure 4 shows annual rainfall variability since 1889, the long-term mean rainfall of 575 mm/year and cumulative deviation from the mean. The latter shows a rising trend from 1946 to 1997, and a steeply falling trend since.
Annual rainfall Cummulative departure from mean
1200
1000
1000
500
800
0 600 -500 400
-1000
2009
0 2001
-2000 1993
200
1977
-1500
Annual rainfall (mm)
Long-term mean rainfall (1889-2009)
1500
1985
Existing groundwater resource estimates in the Spring Hill area The permissible annual volume adopted by government for the Spring Hill Groundwater Management Plan was calculated using the methods described in DNRE (1996). In this case, it was primarily based upon an estimate of the potential annual recharge over the whole area, as a percentage of rainfall. It assumed 7% of the average annual rainfall of 625 mm recharged the aquifer over the volcanic cone areas and 2% of rainfall over the plains areas. Over the total area of 253 km2, this equated to 5,139 ML/year. An alternative estimate, using a hydrograph fluctuation method, gave an annual estimate of 10,140 ML/year. An estimate of the total aquifer storage was also made. It assumed an average aquifer thickness of 20 m and a porosity of 5% for the whole of the 253 km2 area, giving a volume of 253,500 ML.
Topography and rainfall
1969
especially because of reduced surface-water reliability in the recent decade. This has resulted in some tension between irrigation and urban use and puts increased pressure on the water authorities to define sustainable development. In the study area, the State Minister responsible for water legislation established a locally based consultative committee in 1999. This committee, in consultation with the responsible water authority, prepared a groundwater management plan for the Spring Hill Groundwater Supply Protection Area (GMW 2001). Although there was no evidence of severe stress on the groundwater resources of the area in total, it was recognised that some parts would be stressed if all existing water licenses were fully utilised on a regular basis. There was limited monitoring of the aquifer up until then, so priority was given to establishing a monitoring program. No new licenses were issued, temporary trading rules were established, meters were installed on irrigation bores and small volume bores required registration under the plan.
1953
Year
Fig. 3 Time series plot of rest groundwater levels (RWL) above the Australian height datum (AHD) for four observation bores in the Spring Hill area. Note that only bore B116382 is continuing to decline, whereas the other three appear reasonably stable over the last 3 years. Data sourced from the Victorian Water data warehouse (DSE 2011)
1961
2010
2008
2006
2004
2002
2000
1998
1996
1994
520
1945
525
1929
530
1937
535
1921
540
1905
RWL (m AHD)
545
The current groundwater situation The majority of active groundwater usage occurs on the slopes around Spring and Forest Hills (the two scoria cones in the Forest Hill Zone, see Fig. 2). These are where the most suitable soils for cultivation and low salinity, high yielding aquifer locations coincide. Groundwater behaviour in the study area is variable. The greatest decline in groundwater level coincides with the area of greatest groundwater extraction intensity. Groundwater levels in some areas recover to pre-pumping levels following winter while some areas are showing long-term decline (Fig. 3). Notable among the areas that recover is the Blampied Zone, whereas the central area around Spring Hill and Forest Hill shows the greatest fall in level. The Forest Hill Zone has the greatest licence entitlement with a total of 2,887 ML/year–more than double that of Blampied Zone (1,130 ML/year) which is the next largest zone by licence entitlement. In the 2008/ 09 season, reduced allocations of 50 and 80% were imposed on the two zones by the groundwater management plan in response to the falling groundwater levels. All licensed bores now have flow meters installed, enabling accurate usage figures to be recorded. Total usage from the 75 metered bores for 2008/2009 season was 2,041 ML, which is 63% of the restricted licensed entitlement in the area (GMW 2009).
1913
B141296
1897
B141228
1889
B138658
Cummulative deviation from mean rainfall (mm)
B116382 550
Year
Fig. 4 The annual rainfall and cumulative deviation from mean annual rainfall for the Spring Hill area. Data Sourced from SILO, Enhanced Meteorological data, Creswick station (SILO 2009) DOI 10.1007/s10040-011-0757-7
Author's personal copy 3D geological model development This research has been undertaken using ArcGIS (ESRI) and the GOCAD suite, a software product of Paradigm Geophysical Pty Ltd. GOCAD is a software solution developed specifically by the petroleum industry to allow geoscientists to construct 3D models of the subsurface from a range of available data sets. To develop the 3D geological model for the Spring Hill area, detailed surface-geology geographic information system (GIS) polygon layers, bore logs, digital elevation model of the surface topography and geophysical data were collated. Bore logs were closely examined for accuracy and detail to help understand the stratigraphy, then interpretations were added to the logs to mark specific and important horizons. Logs were omitted if they (1) had spurious data, (2) were poorly or incorrectly recorded, or (3) were too shallow or simply not useful in adding to the geological knowledge base. This left 220 bores for use in constructing the sub-basaltic surfaces in the 3D model. As this was a pilot study, simplistic raster modelling was undertaken using the Inverse Distance Weighting interpolation tool in ArcGIS 9.2. To keep processing straightforward, the default options were accepted; however, a cell size of 200 × 200 m was chosen to smooth the variable density of boreholes. This was then exported to ASCII format, which was then read directly into GOCAD. While GOCAD provides many tools to model such surfaces and volumes (e.g. DSI), the research team’s limited experience in this software restricted its use to simpler tasks. Surfaces were corrected for cross-overs and anomalies, and modified if other data (e.g. the surface geology or geophysics) suggested another interpretation was more likely. Once the surface topography, bedrock palaeotopography and any intervening layers were constructed, GOCAD modelling tools were used to construct voxel models (3D blocks) of the respective elements (geological units or aquifers). The volume and cross-sectional area of these units were then calculated using tools in GOCAD, upon which calculations of the groundwater resource were carried out. These shapes were also able to be used for visualisation purposes, for example, they can be coloured according to groundwater salinity (Fig. 5b) or cut by water tables (Fig. 6) or structural controls.
Fig. 5 A stack of 3D block diagrams beneath a geology draped over a digital elevation model (DEM) surface, viewed from the south-west corner of the study area. a Surface topography with mapped geological units; see legend on Fig. 2. Vertical exaggeration of DEM is 10 times. b Voxet model of whole area, showing groundwater salinity in the basalt aquifer (bedrock shown in purple); yellow, total dissolved solids (TDS), where 1,000 < TDS