USING TOUGHREACT TO MODEL LABORATORY TESTS ON THE INTERACTION OF NaNO3-NaOH FLUIDS WITH SANDSTONE ROCK AT A DEEP RADIONUCLIDE REPOSITORY SITE
RADIOACTIVE WASTE MANAGEMENT AND DISPOSAL KEYWORDS: injection of alkaline fluids, Siberia chemical plant, TOUGHREACT
A. V. KIRYUKHIN* Institute Volcanology and Seismology FEB RAS Piip-9, P-Kamchatsky 683006, Russia E. P. KAYMIN and E. V. ZAKHAROVA Institute of Physical Chemistry and Electrochemistry RAS, Leninsky-31 Moscow 119991, Russia
Received November 29, 2006 Accepted for Publication September 19, 2007
TOUGHREACT V1.0 modeling was used to reproduce laboratory tests involving sandstone samples collected from a deep radionuclide repository site at the Siberia Chemical Plant, Seversk, Russia. Laboratory tests included injection of alkaline fluids into sandstone samples at 708C. Some minerals were constrained in the model to precipitate or dissolve, according to laboratory test results. Modeling results were compared with observed test data (mineral phase changes, transient concentration data at the outlet of a sample column). Reasonable agreement was obtained between calculated and measured mineral phases (Na-smectite and kaolinite precipitation, quartz, microcline, chlorite, and muscovite dissolution). After a cation exchange option was used in the model, the most abundant secondary mineral generated was dawsonite, which corresponds to sodium carbonates observed in the sample after an injection test. Time-dependent chemical concentrations (transient chemical concentration data) at the outlet of the sample column qualitatively matched the data observed.
I. INTRODUCTION Deep injection ~at 314 to 341 m below surface! of liquid radioactive waste, conducted in Russia at radio*E-mail:
[email protected] 196
chemical plant sites over the last 40 yr, was considered a reliable method of isolating such waste from the ecosphere. Aquifer reservoir rock behaves as a natural absorber of polluted injection flow under deep repository site environmental conditions. Nevertheless, such repository sites are considered a potential source of environmental pollution. In light of this, safety criteria have been developed to characterize different critical situations and to provide adequate preventive measures.1 One such criterion is the restriction of temperature rise caused by radiogenic heat release from nuclear waste components, with upper-temperature limits considered to be below the saturation temperature under specific aquifer conditions. For existing deep-injection repository sites, the upper-temperature limit is estimated to be 150 to 1808C because of the radioactive decay of waste components. Measures to maintain temperatures below the upper limit achieved by reducing the radionuclide injection rate during exploitation, and modeling heat transfer processes in the deep repository site, are also carried out.2 When liquid radionuclide waste was injected into layer-type reservoirs @Siberia Chemical Plant ~SCP!, Seversk; Mining Chemical Plant, Zheleznogorsk# , chemical interaction took place between natural pore fluids and the clay minerals of the repository site. New secondary minerals were created, initial minerals dissolved, and temperature increased as a result of radiogenic heat release.3 Chemical interactions between injected fluids and the clay-sandstone minerals in the aquifer rock were intensified by high-temperature and high-pressure conditions, conditions that could affect the transport parameters of radioactive components. Monitoring of the hydrogeological parameters in the NUCLEAR TECHNOLOGY
VOL. 164
NOV. 2008
Kiryukhin et al.
LABORATORY TESTS ON INTERACTION OF NaNO3-NaOH FLUID WITH SANDSTONE ROCK
observational wells, as well as laboratory injection experiments under a specified range of pressure, temperature, and physical-chemical conditions, was used to obtain reliable information on underground repository processes.4,5 However, in addition to all this work, reliable numerical models were needed to forecast deep-injection process parameters and to determine injection rates and experimental schedules under safe thermal-hydrodynamic requirements. For this modeling effort, we used TOUGHREACT V1.0, a computer code designed to simulate thermal-hydrodynamic-chemical ~THC! processes, including multiphase nonisothermal transport and fluidrock chemical-reaction kinetics.6 In other studies involving TOUGHREACT, fluid-chemical interaction had been successfully implemented reproducing THC processes and the associated secondary minerals observed in some geothermal fields within regions of recent volcanic activity.7,8 Similar processes have taken place during radionuclide-waste fluid injection in sandstone aquifers, including dissolution of primary minerals and generation of secondary minerals as a result of kinetically driven chemical reactions between rocks, initial fluids, and injected fluids. Hence, in this study, we sought to verify TOUGHREACT’s ability to numerically reproduce laboratory tests through the process of technogenic alteration observed in sandstone samples ~obtained from the SCP deep repository site! as a result of chemical interaction during NaNO 3-NaOH fluid injection in rock samples at a temperature of 708C ~temperature measured by well logging in the repository aquifer!. ~These laboratory tests were performed at the Institute of Physical Chemistry, Russian Academy of Sciences.! Modeling results were calibrated against observed secondary minerals generated during the laboratory experiment and identified based on microprobe analysis and against the transient chemistry data of fluids discharged from the core outlet during the experiment. The aims of the model calibration were first to analyze the possibility of generating in the model the same set of precipitated and dissolved minerals as observed in the laboratory experiment and second to analyze the possibility of reproducing in the model transient chemical concentrations of fluids discharged from the core outlet.
II. LABORATORY EXPERIMENT CONDITIONS II.A. Initial Mineral Composition of Rock Sample The initial rock sample from the SCP deep repository site is composed of quartz-feldspar sandstone. The dominant feldspars are potassium feldspar and sodium feldspar–albite; sodium-potassium feldspar is very rarely observed. Significant fractions of kaolinite, montmorillonite, micas, and chlorite are also observed. Montmorillonite forms large aggregates and surrounds other NUCLEAR TECHNOLOGY
VOL. 164
NOV. 2008
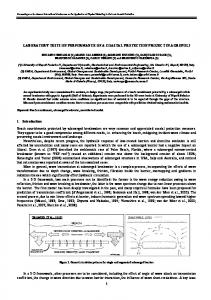
minerals. Initial rock samples are characterized by some alteration: Specifically, feldspars, micas, and chlorite have been partially replaced by montmorillonite, while muscovite is sometimes replaced by kaolinite. II.B. Laboratory Test Performance To conduct laboratory experiments for a deep repository site with fluid-rock chemical interaction under hightemperature and high-pressure flows, the following testing facility was designed ~Fig. 1! ~the numbers in parentheses refer to Fig. 1!. The high-pressure vessel–rock sample site ~1! with 32-mm interior diameter and 90-mm exterior diameter was made from thermal-resistant alloy. The screw press ~2! connects to the high-pressure vessel ~1! through the triple valve ~3!, which is used to support pressure in the rock sample. The pressure gauges @~7! and ~8!, upper limit 160 MPa, 0.4% accuracy# are used to monitor flow conditions. The injection solution fluid is located in the separator ~12!. Gas pressure from the vessel ~9! drives the solution into the rock sample site. Then, the solution enters the triple valve ~16! and goes through the output solution valve ~17! and collects in the output solution vessel ~18!. The sample input and output pressures are monitored by gauges @~11! and ~19!, upper limit 60 MPa, 0.25% accuracy#. Pressure-monitoring data are transmitted to the registration block ~27! and are recorded by a personal computer ~PC! ~28!. The temperature is maintained by the electrical heater ~23! combined with the temperature regulator 9TYP 014T ~25!. To monitor the temperature conditions Cr-Al thermocouples used are @~21! and ~22!#. The thermocouples are connected through the cold alloy thermostat ~24!. The temperature records are conducted through the registration block ~27! by the PC ~28!, and the total temperature measurement accuracy was 638C. All joints are made from acid- and alkaline-solution–resistant materials. The rock sample preparation included distraction of the original sandstone sample into small cuts ~it was not possible to make a cylinder from the core sample!, and the samples were loaded into the tube sample site. It is worth noting that the specific surface area of the crushed and uncrushed samples was estimated using the QUANTASORB method in the range of 12.8 to 12.2 m 20g, while the gas-estimated permeability for 4-cm 3 samples ranges from 21.8 millidarcy ~mD! ~vertical! to 85.7 mD ~horizontal!. The total porosity of the sandstones was estimated as 20% based on values of specific densities of rocks and mineral grains.9 Before testing, the rock sample was installed in a tube form with 15-mm diameter and 120-mm length, isolated by thermo-relaxable rubber. The laboratory test run started by pushing initial water through the valve ~3! and the gauge set @~5! and ~6!# by the press ~2! into the high-pressure-vessel–sample site ~1!. The test pressure accordingly fit the lithostatic pressure of the sampling depth, taking into account the sandstone density, 2 g0sm 3 197
Kiryukhin et al.
LABORATORY TESTS ON INTERACTION OF NaNO3-NaOH FLUID WITH SANDSTONE ROCK
Fig. 1. Laboratory experiment setup: 1, high-pressure vessel ~rock sample site!; 2, screw press; 3, triple valve; 4, vessel with initial water; 5 and 6, pressure gauge set; 7 and 8, pressure gauges; 9, gas vessel; 10, pressure gauge set; 11, pressure gauge; 12, separator; 13, double valve; 14, vessel with solution; 15, input nozzle; 16, triple valve; 17, output solution valve; 18, output solution vessel; 19, pressure gauge; 20, electric current distributor; 21 and 22, thermocouples; 23, electrical heater; 24, cold alloy thermostat; 25, temperature regulator; 26, thermoresistor; 27, parameters registration block; 28, PC; 29, environmental temperature and pressure compensator.
~Ref. 3!. The test temperature by the temperature regulator ~25! accordingly fit the observed temperatures in the deep repository site. Then, gas from the vessel ~9! pushed into the separator ~12!, and the fluid system filled to the desired fluid pressure. After 3 to 5 h, the desired flow rate regime was achieved. A constant flow rate was maintained by adjusting of the input ~13! and the output ~17! valves and was defined volumetrically ~vessel 18!. The chemical composition of the rock sample was converted into mineralogical composition based on the Selector-C computer code.4 Hence, the mineralogical composition ~as listed in Table I! includes quartz, 55 to 65 wt%; feldspars ~albite, plagioclase, and microcline!, 10 to 20 wt%; micas, 2 to 10 wt%; chlorite, up to 2 wt%; clay minerals ~montmorillonite, kaolinite, up to 15 wt%; carbonates of calcium and magnesium, 0.5 to 3.0 wt%. The initial fluid chemical composition corresponds to pore fluids at the deep repository site ~Table II!. An alkaline solution was injected into the column at 3-MPa pressure and 708C temperature. This solution included the following components: NaNO 3 , 44.3 g0ᐉ!; Na2CO 3 , 2.08 g0ᐉ; Al, 0.83 g0ᐉ; NaOH, 8.9 g0ᐉ ~Table II!. There were no direct pH measurements of injected solutions during the laboratory experiment; hence, thermodynamic software ~Selector, Gibbs! was used for pH estimations based on the input concentrations mentioned above 198
TABLE I Initial Mineral Fractions Observed in the Sample and Assumed in the Modeling* Mineral Phase ~Observed!
Weight Percent
Quartz Potassium feldspar Montmorillonite Kaolinite Albite Chlorite Hydrated biotite, montmorillonite biotite Muscovite Montmorillonite muscovite Siderite Calcite Apathite, Ilmenite
50 10 10 10 5 3 5 2 2 ,1 ,1
Mineral Phase ~Assumed in the Modeling!
Volume Percent ~Run 7!
Quartz Microcline Na-smectite Kaolinite Albite ~low! Chlorite
50 10 10 10 5 3
Muscovite
11
Calcite
1
Sodium carbonates Natrite Na2CO 3
0
Trona Na3CO 3 HCO 32H 2O
0
Dawsonite NaAlCO 3 ~OH!2
0
*Run 7A. NUCLEAR TECHNOLOGY
VOL. 164
NOV. 2008
Kiryukhin et al.
LABORATORY TESTS ON INTERACTION OF NaNO3-NaOH FLUID WITH SANDSTONE ROCK
TABLE II The Initial Pore-Fluid and Injected-Fluid Chemical Composition as Analyzed and Assigned in the Model* Initial Pore Fluid
Injected Fluid
Primary Species
Chemical Analysis
pH
7.3
7.3
mg0ᐉ
mg0ᐉ
mol0kgH2O
mg0ᐉ
mol0kg H2O
26.30 2.90 25.00 15.30 5.80 0.00 7.10 3.20 230.00
26.30 2.90 25.00 15.30 5.80
1.143976E⫺03 a 7.417259E⫺05 6.237836E⫺04 6.295001E⫺04 1.038589E⫺04 0.10000E⫺07 2.002651E⫺04 3.331113E⫺05 3.769441E⫺03 0.10000E⫺06 0.10000E⫺06
17 570
0.764 0.1E⫺06 0.1E⫺06 0.1E⫺06 1.0E-15 0.030 0.1E⫺06 0.1E⫺06 0.020 0.521 0.1E⫺06
Na⫹ K⫹ Ca⫹⫹ Mg⫹⫹ Fe⫹⫹ AlO⫺ 2 Cl⫺ SO⫺ 4 HCO⫺ 3 NO⫺ 3 SiO 2 ~aq!
Assigned in the TOUGHREACT Modeling 11.81
7.10 3.20 230.00
1 810 1 220 32 300
*The chemical composition of the injected fluid was calculated based on the following initial concentrations: NaNO 3 ⫽ 44.3 g0ᐉ, Na2CO 3 ⫽ 2.08 g0ᐉ, Al ⫽ 0.83 g0ᐉ, and NaOH ⫽ 8.9 g0ᐉ. Chemical composition was converted to the primary species concentrations mol0kg H 2O; pH ⫽ 11.67 ~as estimated by Slovtsov using Selector software!, and pH ⫽ 11.81 ~as estimated by Limantseva using Gibbs software!. a Read as 1.143976 ⫻ 10⫺3.
TABLE III Injected Fluid Chemical Composition and Transient Data on Chemical Composition from Fluid Sampling at the Column Outlet Time ~days!
Volume of Injection ~ml!
Concentration ~ppm! pH
Na
Al
Si
Ca
Mg
K
Sr
,0.1 1140
,0.01 106
7.95 85.1
,0.01 86.9
9
Injected Fluid 12.5
11.8 7.55
17 300 12 100
955 ⱕ0.1
,0.5 47.1
16 23 30
11 10.2 10
8.78 8.98 8.84
15 300 15 100 15 500
ⱕ0.1 ⱕ0.1 ⱕ0.1
30.6 42.4 42.4
14.7 8.92 6.4
11.7 7.92 4.24
73.8 68.9 65.9
3.92 2.16 1.42
32 58 79
12 31.5 30.5
8.20 8.92 8.85
17 000 17 500 17 500
ⱕ0.1 ⱕ0.1 ⱕ0.1
40.0 1.58 2.13
2.5 1.46 2.32
2.03 0.65 0.84
57.1 44.5 64.3
1.35 0.29 0.34
~Table II!. The GIBBS-supported thermodynamic database UNITHERM is consistent with the EQ306 database that TOUGHREACT used. Two tests having durations of 79 days and 42 days were performed, with injection mass flux at an average level of 2.50 ⫻ 10⫺5 kg0s{m 2. At various times during the test ~9, 16, 23, 30, 32, 58, and 79 days!, the output fluid was sampled at the column outlet for chemical analysis ~Na, Al, Si, Ca, Mg, K, and Sr! ~Table III!. NUCLEAR TECHNOLOGY
VOL. 164
NOV. 2008
After the tests, microprobe analyses of the sample mineral compositions were performed 10,11 via the connection of Link INCA ENERGY200 to an electronic scan facility, CamScan MV-2300; energy dispersive spectroscopy ~EDS! techniques were used ~Fig. 2!. The findings were as follows: 1. Biotite, chlorite, and feldspars were replaced by Na-smectites. 199
Kiryukhin et al.
LABORATORY TESTS ON INTERACTION OF NaNO3-NaOH FLUID WITH SANDSTONE ROCK
Fig. 2. Electron-scan images of samples ~Kaymin data! after laboratory test: ~a! chlorite ~Chl! replacement by montmorillonite ~Mont!; ~b! muscovite ~Ms! replacement by kaolinite ~Kaol!; ~c! biotite ~Bt! replacement by montmorillonite ~Mont!; ~d! K-feldspar ~Kfs! replacement by montmorillonite ~Mont!; ~e! grains of magnetite hosted in clay minerals; ~f ! sodium carbonates ~Na! release in form of regions in montmorillonite ~Mont!. The black space is the polymeric matrix.
2. Muscovite was replaced by kaolinite. 3. Na-smectite precipitation was greater then kaolinite precipitation. 4. Siderite was not significantly changed. 5. Magnetite precipitated. 6. Sodium carbonate precipitate ~Na2CO 3 ⫻ 10H 2O @or trona Na3H~CO 3 !2 ⫻ 2H 2O#! was found in the inflow zone. 7. Increasing the test duration did not cause an increase in the degree of hydrothermal alteration within the sandstone sample column. This indicates that secondary minerals formed a cover, isolating other minerals from participation in chemical reactions. III. NUMERICAL THC MODEL SETUP In this study, TOUGHREACT V1.0 was used to reproduce the laboratory experiment just described: The process of technogenic alteration was observed in sand200
stone. The model accounts for adjective and diffusive transport of aqueous chemical species. Mineral dissolution0 precipitation can proceed at equilibrium and0or under kinetic conditions, according to the following rate law: r ⫽ kS~1 ⫺ Q0K !exp~Ea 0~R ⫻ 298.15! ⫺ Ea 0~RT !! , ~1! where k ⫽ kinetic constant of the chemical dissolution0 precipitation at 258C ~mol0s{m 2 ! S ⫽ specific reactive surface area ~m 20m 3 ! Q ⫽ activity product K ⫽ equilibrium constant for mineral-water interaction Ea ⫽ activation energy ~kJ0kmol! R ⫽ gas constant ~kJ0kmol K! T ⫽ temperature ~K!. NUCLEAR TECHNOLOGY
VOL. 164
NOV. 2008
Kiryukhin et al.
LABORATORY TESTS ON INTERACTION OF NaNO3-NaOH FLUID WITH SANDSTONE ROCK
The temperature effects are also accounted for in TOUGHREACT by geochemical-reaction calculations, in which equilibrium and kinetic data are functions of temperature. III.A. Chemical Input Data Quartz, microcline, albite-low, Na-smectite, kaolinite, chlorite, muscovite, and sodium carbonates ~nitrite, trona, or dawsonite! were used for geochemical system definition, and initial mineral fractions and chemical interaction parameters were assigned as shown in Tables I and IV. Dawsonite NaAlCO 3 ~OH!2 was added to the EQ306 database that TOUGHREACT used. This was reasoned by dawsonite precipitation triggering aluminum consumed from injecting fluids, which are not seen in the fluid exiting the column. The reaction NaAlCO 3 ~OH!2 ⫹ 3H⫹ ⫽ Na⫹ ⫹ Al 3⫹ ⫹ HCO⫺ 3 ⫹ 2H 2O corresponding log K ⫽ 2.1 at 708C was used according to a reviewer’s comment, which was converted for reaction NaAlCO 3 ~OH!2 ⫽ ⫺ 3H⫹ ⫹ Na⫹ ⫹ AlO⫺ 2 ⫹ HCO 3 to log K ⫽ ⫺16.7 using the TOUGHREACT kreg and switch utility for a geochemical system based on AlO⫺ 2 primary species. Energy of the activation Ea parameter was assigned as in Table 3 of Ref. 7, while others ~k and S! were changed during model calibration. Its worth noting that rate law formula ~1! includes multiplication of kinetic constant k and specific reactive surface area S, and individual changes of those parameters have no effect on model output, if their multiplication product has no change. Hence, kS is used as a calibration parameter to
fit the model output to the observation data. As an initial approach for k and S, data derived from Table 3 of Ref. 7 are used. The chemical composition ~primary species! of the initial solution ~natural pore fluids! and injected fluid are shown in Table II. In addition, the following list of aqueous complexes are used OH⫺, HAlO 2 ~aq !, NaAlO 2 ~aq !, CaSO 4 ~aq !, NaCl ~aq !, ⫺2 CaHCO⫹ 3 , CO 2 ~aq!, CO 3 , CaCO 3 ~aq!, KCl~aq!, ⫺ ⫺ NaSO 4 , KSO 4 , NaHSIO 3 ~aq!, CaOH⫹, NaOH~aq!, ⫹ ⫹3 ⫹2 H 3SIO⫺ 4 , Al , AlOH , Al~OH! 2 , Al~OH!3 ~aq!, ⫹ ⫹ CaCl , CaCl2 ~aq!, NaHCO 3 ~aq!, MgHCO⫹ 3 , MgCl , ⫺ ⫹ ⫹ MgSO 4 ~aq!, NaCO 3 , FeCl , FeHCO 3 , FeCO 3 ~aq!, FeCl⫺2 4 . III.B. Flow and Solute Input Data In adherence to the laboratory test data, the model was assigned a 708C isothermal condition with mass flux 2.50 ⫻ 10⫺5 kg0s{m 2 and pressure 3.0 MPa. Reservoir porosity was assigned to be 0.2. The length of the model corresponded to the length of the test sample: 15 cm. A one-dimensional numerical grid was generated that included 32 elements, with B1 representing the source of injected fluid ~specified as an inactive element with a large volume of 5.00 ⫻ 10 20 m 3 !; R1-R30 elements representing the 15-cm-long sandstone column, with each element having a width of 0.005 m; and D1 representing the inactive element with a specified pressure of 3.0 MPa, which corresponds to the discharge from the column outlet. Figure 3 shows the geometry of the numerical grid corresponding to laboratory test conditions. III.C. Model Parameterization and Calibration Procedure
TABLE IV Parameters for Chemical Interaction of Mineral Phases ~Run 7A!* Mineral Phase Quartz Microcline Na-smectite Kaolinite Albite ~low! Chlorite Muscovite Sodium carbonates Natrite Na2CO 3 Trona Na3CO 3 HCO 32H 2O Dawsonite NaAlCO 3 ~OH!2
Ea Dissolution kS Precipitation kS ~kJ0mol! ~mol0s{m 3 ! ~mol0s{m 3 ! 75.00 67.83 58.62 62.76 67.83 58.62 75.0 62.76
1.0E⫺8 a 1.0E⫺9 0.0 0.0 1.0E⫺9 1.0E⫺9 1.0E⫺9 0.0
1.0E⫺8 0.0 1.0E⫺2 1.0E⫺2 0.0 0.0 0.0 1.0E⫺2
62.76
0.0
1.0E⫺2
62.76
0.0
1.0E⫺2
*Ea ⫽ activation energy 7 ~kJ0kmol!; kS ⫽ multiplication of k, kinetic constant of the mineral dissolution0precipitation at 258C ~mol0s{m 2 !; S ⫽ specific reactive surface area ~m 20m 3 !. kS is used as a calibration parameter in the model. a Read as 1.0 ⫻ 10⫺8. NUCLEAR TECHNOLOGY
VOL. 164
NOV. 2008
Multiplication of kinetic constant and specific reactive surface area kS values for primary and secondary minerals ~Table IV! used estimated calibration parameters to fit model output results to laboratory test data observed. Modeling run outputs, including transient mineral fractions and chemical concentrations of fluid, were printed out at those times corresponding to the sampling times of alkaline fluid discharge from the column outlet ~9, 16, 23, 30, 32, 58, and 79 days!. At these times calculated and observed system states were compared, and calibration parameters ~kS values! were updated. Modeling runs were iterated until there was no further improvement of the fit.
IV. MODELING RESULTS IV.A. Necessity of Precipitation/Dissolution Constraint Based on a number of initial calibration runs, no scenario was found in which new secondary minerals appeared, old ones were reduced, and fluid chemical 201
Kiryukhin et al.
LABORATORY TESTS ON INTERACTION OF NaNO3-NaOH FLUID WITH SANDSTONE ROCK
Fig. 3. Numerical grid geometry used for modeling alkaline NaNO 3-NaOH fluid injection in a sandstone column from the SCP deep repository site. B1 ⫽ injection element; D1 ⫽ discharge element.
concentrations at the sample site outlet changed in a way similar to the laboratory test performed. Hence, some minerals were constrained in the model to precipitate or dissolve according to the laboratory test results ~see above!. Specifically, K-feldspar, albite, chlorite, and muscovite were constrained from precipitation, whereas Na-smectite ~montmorillonite!, kaolinite, and sodium carbonates were prevented from dissolution, e.g., not allowed to dissolve in the model. IV.B. Modeling Without Cation Exchange Seven modeling runs were performed with different kS values; no cation exchange option was enforced. The modeling scenario ~run 7A! yielded the following results.
Mineral-phase fractions change ~Fig. 4!. The mineral percentage relative to the total amount of secondary minerals used as a measure of mineral fractions changes. By the end of day 79, in response to alkaline solution injection, most significant dissolution took place at the entry of the column. Quartz dissolves most significantly ~up to 2156%!; then, muscovite dissolves up to 1470%, microcline dissolves up to 70%, and albite dissolves up to 32.5%, while chlorite insignificantly dissolves ~up to 0.03%!. Calcite precipitate has a maximum 48.8% in the entry part of the column; Na-smectite ~montmorillonite! precipitates range from 6.8 to 49.5%, tending to increase at the column outlet; kaolinite precipitates increase from 1.15% at the entry to 15.8% at the middle part and then drop to 0.3% at the outlet. The total relative
Fig. 4. Modeling results ~run 7A!. Mineral percentage relative to the total amount of secondary minerals along the injection direction within the sandstone column sample by 79 days of modeling time. Mineral percentage values are represented in log scale, precipitated phases are denoted with a plus ~⫹! symbol, and dissolved phases are denoted with a minus ~⫺! symbol. 202
NUCLEAR TECHNOLOGY
VOL. 164
NOV. 2008
Kiryukhin et al.
LABORATORY TESTS ON INTERACTION OF NaNO3-NaOH FLUID WITH SANDSTONE ROCK
volume of secondary minerals generated in the column during the experiment estimated in the model range from 0.0005 to 0.015%, increasing from entry to the column outlet. In general, these results match the laboratory test results, except that no sodium-rich solid mentioned in Table IV was obtained in the model ~whereas abundant sodium carbonates were observed during the laboratory test!. Space distributions of chemical elements in liquid phase and pH along the direction of injected fluid in the column by day 79 of the laboratory test show constant concentration distributions. Comparisons between observed and modeled transient-chemical-concentration data taken from fluid sampled in the sandstone column outlet ~run 7A! show that the pH follows the same trend in both the model and the experiment, whereas absolute modeling values are 2.6 units larger than the measured pH ~Fig. 5!. The model-calculated Na matches the experimental data reasonably well ~Fig. 5!. The Ca comparison between the model and experiment shows the same trend, with the absolute values in the model one order less than in the experiment ~Fig. 5!. The K values are underpredicted by the model. The Mg comparison shows the same trend between the model and experiment, with model absolute values two to three orders of magnitude less. The Al comparison shows the model is four orders of magnitude greater than the experimental values. The Si comparison shows convergence at early times, but later model concentrations are three times greater than in the experiment. It was also found that a change of rate constants in mineral precipitations ~kS! for Na-smectite and kaolinite
~Table IV! has no effect on the pH and outlet discharge transient chemical concentrations. IV.C. Model Sensitivity to Thermodynamic Data Model sensitivity to assumed solid sodium thermodynamic data was also tested. In this way sodium carbonate Na2CO 3 log K values shifted down, having in a mind some uncertainty of the thermodynamic data used. It was found 4 log K units is a shifting threshold to get the solid sodium phase ~up to 3.68 ⫻10⫺3 ! in the inflow part of the model ~run 12!. Similarly shifting trona thermodynamic log K values on six units down enables the model to generate trona ~7.4 ⫻ 10⫺4 to 1.41 ⫻ 10⫺1 ! along all the length of the sample ~run 14!. IV.D. Modeling with Cation Exchange Additional modeling runs ~run 15! were performed taking into account possible cation exchanges ~Na, K, Ca, Mg, H! ~Table V!. This improved model and experimental data convergence: Abundant dawsonite precipitation observed in the model confirm this is the best candidate of sodium carbonates to be precipitate during the laboratory test; transient concentrations and pH values at the outlet of the sample column are better reproduced in the model. Hence, the modeling scenario ~run 15! yielded the following results. Mineral-phase fractions change ~Fig. 6!. The mineral percentage relative to the total amount of secondary minerals used as a measure of mineral fractions changes. By the end of day 79, in response to alkaline solution injection, calcite dissolves with a maximum 13.5% in the middle of the column, quartz dissolves ~from 10.0% at the column entry to 0.8% at the outlet!, muscovite dissolves ~from 6.7 to 0.7%!, microcline dissolves ~from 0.3 to 0.04%!, albite dissolves slightly ~from 0.15 to 0.04%!, and chlorite dissolves insignificantly ~,0.08%!. Nasmectite ~montmorillonite! precipitates increase at the outlet part of the column ~from 0.002 to 39.8%!, and kaolinite precipitates increase from 0.05% at the entry up
TABLE V Cation Exchange Parameters Used in Modeling Scenario 15*
Fig. 5. Comparison of the modeling results ~continuous lines, run 7A! and transient pH data ~empty circles!, Naconcentration data ~filled circles!, and Ca-concentration data ~triangles! at the outlet of the sample site during laboratory test. NUCLEAR TECHNOLOGY
VOL. 164
NOV. 2008
Cation
Exchange Coefficient
Na⫹ K⫹ Ca⫹⫹ Mg⫹⫹ H⫹
1.0 0.1995 0.3981 0.5012 1.0E⫺09 a
*Cation exchange capacity 6.5 meq0100 g of solid used. a Read as 1.0 ⫻ 10⫺09. 203
Kiryukhin et al.
LABORATORY TESTS ON INTERACTION OF NaNO3-NaOH FLUID WITH SANDSTONE ROCK
Fig. 6. Modeling results ~run 15, cation exchange option enforced!. Mineral percentage relative to the total amount of secondary minerals along the injection direction within the sandstone column sample by 79 days of modeling time. Mineral percentage values are represented in log scale, precipitated phases are denoted with a plus ~⫹! symbol, and dissolved phases are denoted with a minus ~⫺! symbol.
to 10.7% in the middle part of the column and then drop to 2.4% at the outlet. The model also shows significant dawsonite generation ranging from 49.9% at the column entry to 7.8% at the outlet, which corresponds to sodium carbonates, observed during the laboratory test but not clearly identified on the basis of EDS. The total relative volume of secondary minerals generated in the column during the experiment estimated in the model ranges from 0.1 to 0.8%, increasing from the entry to the column outlet. Modeling shows that after 32 days of the laboratory experiment, dawsonite generation stopped ~Fig. 7!. Model and experimental data convergence of the transient Na, K, Ca, Mg, Al, and Si concentrations and pH values at the outlet of the sample column improved but are still rather qualitative ~Figs. 8 and 9!. Comparisons between observed and modeled transient-chemical-concentration data taken from fluid sampled in the sandstone column outlet ~run 15! show that the pH converges in “average terms” in the model and experiment, whereas modeling values are 2 units less during the first half of the experiment time and 2.5 units greater during the second half of the experiment time compared to the measured pH ~Fig. 8!. The modelcalculated Na matches the experimental data reasonably well ~Fig. 8!. The Ca values are overpredicted by the model at the beginning and underpredicted at the end of the experiment ~Fig. 8!. The K comparison between the model and the experiment shows the same trend, with the absolute values 204
in the model one order less than in the experiment ~Fig. 9!. The Mg comparison shows the same trend between the model and the experiment, with the model absolute values two to three orders of magnitude less ~Fig. 9!. The Al comparison shows the model and experiment low concentrations during the first half of the experiment time, which may correspond to the Al detection limit, while by day 45 Al and pH breakthrough was observed in the model but not detected in the experiment ~Fig. 9!. The Si comparison shows convergence at early times, but later model concentrations are two orders greater than in the experiment ~Fig. 9!. IV.E. Effect of Carbonation Injected Fluid Two runs ~16A and 17A! were performed to investigate the effect of partial carbonation of injected fluid before injection, which might be because reagent NaOH absorbed some CO 2 from air before the solution was made up, and0or the injection fluid itself might have absorbed some CO 2 prior to injection. PCO2 assigned 0.1 and 0.2 bars, respectively, for those runs, but no significant changes in modeling outputs compare to run 15 observed. V. CONCLUSIONS TOUGHREACT V1.0 modeling was used to reproduce laboratory tests on sandstone samples collected from NUCLEAR TECHNOLOGY
VOL. 164
NOV. 2008
Kiryukhin et al.
LABORATORY TESTS ON INTERACTION OF NaNO3-NaOH FLUID WITH SANDSTONE ROCK
Fig. 7. Modeling results ~run 15, cation exchange option enforced!. Mineral percentage of dawsonite relative to the total amount of secondary minerals along the injection direction within the sandstone column sample at different modeling times.
Fig. 8. Comparison of the modeling results ~lines, run 15, cation exchange option enforced! and transient pH data ~empty circles!, Na-concentration data ~filled circles!, and Ca-concentration data ~triangles! at the outlet of the sample site during laboratory test.
a deep radionuclide repository site in the SCP. Laboratory tests included injection of alkaline fluids into sandstone samples at 708C. Based on laboratory test results, some minerals were not allowed to precipitate or dissolve in the model. A cation exchange option was used. Modeling outputs were compared to observed laboratory NUCLEAR TECHNOLOGY
VOL. 164
NOV. 2008
Fig. 9. Comparison of the modeling results ~lines, run 15, cation exchange option enforced! and transient Mgconcentration data ~gray triangles!, Al-concentration data ~filled circles!, Si-concentration data ~blue squares!, and K-concentration data ~empty circles! at the outlet of the sample site during laboratory test.
test data ~mineral-phase change and transient concentration data at the outlet of the sample column!. Model and test convergence were obtained in the principal mineral phases ~Na-smectite and kaolinite 205
Kiryukhin et al.
LABORATORY TESTS ON INTERACTION OF NaNO3-NaOH FLUID WITH SANDSTONE ROCK
precipitation; quartz, microcline, chlorite, and muscovite dissolution!. The model generated dawsonite, which corresponds to sodium carbonates observed in the laboratory test. Modeling and observed transient chemical concentration data at the outlet of the sample column ~Na, K, Ca, Mg, Al, Si, and pH! are rather qualitative. Additional modeling to match laboratory test data is ongoing.
ACKNOWLEDGMENTS We express our gratitude to T. Xu, N. Spycher, and J. Apps ~Lawrence Berkeley National Laboratory! for valuable comments and suggestions, as well as B. N. Ryzhenko and O. A. Limantseva @Vernadsky Institute of Geochemistry and Analytical Chemistry, Russian Academy of Sciences ~RAS!#, and I. B. Slovtsov @Institute of Volcanology and Seismology, Far East Branch ~FEB! RAS# for additional thermodynamic calculations. Special thanks to A. A. Grafchikov, Institute of Experimental Mineralogy RAS, who provided microprobe analysis data, and A. A. Zubkov, SCP, who provided help and consultations for this study. The authors appreciate the useful reviewers comments. This study was supported by FEB RAS project 06-I-OH3-109 and Russian Foundation for Basic Research project 06-05-64688-a.
REFERENCES 1. E. N. KAMNEV and A. I. RYBALCHENKO, “Deep Injection of Liquid Radioactive Waste in Nuclear Industry Enterprises,” Eng. Ecol., 1, 2 ~2001! ~in Russian!. 2. G. A. OKUNKOV, A. I. RYBALCHENKO, and A. A. KUVAEV, “Heat Regime of the Geological Repository Site Caused by Liquid Radionuclide Waste Injection,” Geoecology, 3, 237 ~2003! ~in Russian!. 3. A. I. RYBALCHENKO et al., “Deep Injection of Liquid Radionuclide Waste,” IzdAT, p. 256 ~1994! ~in Russian!. 4. A. A. ZUBKOV, O. V. MAKAROVA, V. V. DANILOV, E. V. ZAKHAROVA, E. P. KAYMIN, K. A. MENYAILO,
206
and A. I. RYBALCHENKO, “Technogenic Geochemical Processes During Injection of Liquid Radionuclide Waste into Sandstone Layer-Type Reservoirs,” Geoecology, Engineering Geology, Hydrogeology, Geocriology, 2, 133 ~2002! ~in Russian!. 5. E. P. KAYMIN, E. V. ZAKHAROVA, L. I. KONSTANTINOVA, A. A. GRAPHCHIKOV, L. Y. ARANOVICH, and V. M. SHMONOV, “Study of the Interaction of Alkaline Radionuclide Waste with Sandstone Rocks,” Geoecology, Engineering Geology, Hydrogeology, Geocriology, 5, 427 ~2004! ~in Russian!. 6. T. XU, E. SONNENTHAL, and N. SPYCHER, “TOUGHREACT User’s Guide: A Simulation Program for Nonisothermal Multiphase Reactive Geochemical Transport in Variably Saturated Geologic Media,” p. 192, LBNL-55460, Lawrence Berkeley National Laboratory ~2005!. 7. A. V. KIRYUKHIN, T. XU, K. PRUESS, J. APPS, and I. SLOVTSOV, “Thermal-Hydrodynamic-Chemical ~THC! Modeling Based on Geothermal Field Data,” Geothermics, 33, 3, 349 ~2004!. 8. A. V. KIRYUKHIN, M. Y. PUZANKOV, I. B. SLOVTSOV, S. B. BORTNIKOVA, S. V. MOSCALEVA, M. E. ZELENSKY, and A. Y. POLYAKOV, “Thermal-HydrodynamicChemical Modeling Processes of Secondary Mineral Precipitation in Production Zones of Geothermal Fields,” Vulcanologia and Seismologia, 5, 27 ~2006! ~in Russian!. 9. E. G. CHAPOVSKY, “Laboratory Studies in Soils Mechanics, Moscow,” Gosgeoltechisdat, p. 272 ~1958! ~in Russian!. 10. A. A. GRAFCHIKOV, L. YA. ARANOVICH, V. M. SHMONOV, I. V. ZAKIROV, E. P. KAYMIN, and E. V. ZAKHAROVA, “Experimental Simulation of Sandstone Interaction with Na-Bearing Alkalie Solution in a Flow Regime,” Geochemistry, 6, 632 ~2004! ~in Russian!. 11. A. A. GRAFCHIKOV, L. YA. ARANOVICH, V. M. SHMONOV, I. V. ZAKIROV, E. P. KAYMIN, and E. V. ZAKHAROVA, “Experimental Simulation of Sandstone Interaction with Na-Bearing Alkaline Solution in a Flow Regime,” Geochemistry Int., 42, 6, 545 ~2004!.
NUCLEAR TECHNOLOGY
VOL. 164
NOV. 2008