2016 IEEE 19th International Conference on Intelligent Transportation Systems (ITSC) Windsor Oceanico Hotel, Rio de Janeiro, Brazil, November 1-4, 2016
Using Travel Time Reliability Measures With Individual Vehicle Data Isaac K Isukapati
George F List
The Robotics Institute Carnegie Mellon University Pittsburgh, PA 15213 Email:
[email protected]
Department of Civil Engineering North Carolina State University Raleigh, NC 27695 Email:
[email protected] the simpler metrics. Scatterplots of τrms versus στ can be used as signature patterns to understand how well a segment or route is performing. For example, when the (τrms , στ ) points are near the origin, reliability is high. This is typically the condition when the facility is operating uncongested. The closer the points lie to the στ axis, regardless of the operating condition, the more reliable is the operation. If the (τrms , στ ) points lie along a line with a positive slope, then a peak period transient is underway or there has been an incident. Scatter in the locus of the (τrms , στ ) points provides an indication of how turbulent the operating condition is. Ex-post facto frequency tables for the (τrms , στ ) combinations are very useful in comparing the reliability performance of one segment/route with another.
Abstract—The assessment of travel time reliability for segments and routes is a rapidly advancing frontier. The increasing availability of probe data is making it possible to monitor reliability in real-time based on individual vehicle data as opposed to ex-post-facto based on averages. This paper examines metrics that can be used to monitor reliability based on probe data. The merits of traditional metrics like the planning time index, buffer index, and travel time index are compared with newer ideas like complete cumulative distribution functions and mean/variance combinations. The question is: what is the quality of information about real-time reliability provided by these various options? This paper compares these metrics in the context of probe-based observations of travel times and rates. Also, a new idea for a pairwise metric, the root mean square travel rate τrms in conjunction with the standard deviation στ . These two measures in combination seem to provide a picture of reliability that is nearly as complete as the underlying Cumulative Density Function (CDF) and better than the simpler metrics. These ideas are examined in the context of probe data from I-5 in Sacramento, CA.
I.
This paper compares and contrasts various reliability measures in the context of Bluetooth data for individual vehicles collected on I-5 in Sacramento, California for three months in 2011.
I NTRODUCTION II.
The assessment of travel time reliability for segments and routes is a rapidly advancing frontier. In fact, travel time reliability is one of the key performance measures used by a number of public agencies in the United States [1]. The Strategic Highway Research Program (SHRP 2) deemed reliability to be one of the four factors that needed to be addressed in capacity expansion decision-making [2]. In general reliability can be defined as the absence of variation in the travel times.
Much of the research on travel time reliability has focused on average travel times. An example would be average travel times for 5 minute intervals during the AM or PM peak period across a year or more. A popular idea involves computing the ratio between a high percentile travel time (e.g., the 95th percentile) and a reference value like the minimum or average travel time. If this ratio is high, the performance is unreliable. Lomax et al. [3] in their seminal work suggested using metrics like the percent variation, the misery index, and the buffer time index. USDOT [3] recommends measures like the frequency of congestion, the planning time index, the buffer index, and the 90th and 95th percentile travel times. NCHRP Report 618 [4] recommends using the buffer index, the planning time index, the misery index, the percent variation, and the percent on-time arrival. Margiotta et al. [5] recommend replacing the percent variation with the skew statistic. Dong and Mahmassani [6], and Dowling et al. [7] use the standard deviation. SHRP2 L08 [8]recommends using the travel time index and SHRP-2 L02 [9] suggests using the CDF for the entire distribution and/or a metric called the semi-standard deviation. It is not that some measures are correct and others are wrong, but rather that a variety of measures exist. Some
The increasing availability of probe data is making it possible to monitor reliability in real-time based on individual vehicle data as opposed to ex-post-facto based on averages. This paper focuses on the issue of metrics that can be used to monitor reliability based on probe data. The merits of older metrics like the planning time index, buffer , and travel time index are compared with newer ideas like complete cumulative distribution functions and mean/variance combinations. The question is: what is the quality of information about real-time reliability provided by these various options? A new pairwise combination of metrics is introduced: the root mean square travel rate τrms in conjunction with the standard deviation στ . These two measures seem to provide a picture of reliability that is nearly as complete as the underlying CDF and better than 978-1-5090-1889-5/16/$31.00 ©2016 IEEE
P RIOR R ESEARCH
2131
are simpler, some are more complex, and the more complex measures tend to provide more information.
travel times, just one percentile. So if the performance improves at other percentiles, that change is undetected. Also, if two segments differ in the average travel times associated with percentiles other than the 95th , those differences are missed if the TTIs of two facilities are compared, or if the trends in PTIs are compared across time.
Among the single value metrics in common use today, four are reviewed here: the travel time index, the planning time index, the buffer index, the CDF, and the semi-standard deviation.
Buffer Index: The buffer index (BI) is defined to be the difference between the 95th percentile average travel time and the mean of the travel times divided by the mean of the travel times [1], [2]. In a sense, it is a standard deviation-related metric. If the travel times were Normally distributed, this index would be 1.96, the z value for a Normal (0,1) distribution. A major problem with this index is that variations in the mean value affect the numerical result as well as variations in the 95th percentile. Hence it is not possible to determine what changed, the 95th percentile or the mean, just that the ratio between the two has been altered. SHRP 2 C-02 [2] suggested that the median travel time could also be used as a reference value instead of mean. Of course, if the median value changes, the BI changes as well. An equation for computing the BI is:
Travel Time Index: The Urban Congestion Report [3] defines the travel time index (TTI) as the ratio of the peak-period travel time compared to the free-flow travel time. Annually, the report computes this measure for major metropolitan areas for the AM peak period (6:00 a.m. to 9:00 a.m.) and PM peak period (4:00 p.m. to 7:00 p.m.) on weekdays. If the 5th percentile travel time is deemed to be free flow travel time and µi is the mean travel time during observation time i, then a formula for computing travel time index is: T T Ii =
µi F −1 (0.05)
(1)
Because the metric is a ratio of two values, if either one changes, the TTI changes. For example, if the average travel time decreases because a capacity investment is made, then the TTI will be reduced ceteris paribus. But if the speed limit is also raised as a result, the TTI could increase because the free-flow travel time would be lower. SHRP2 L08 uses this definition to assess the reliability of freeway and arterial facilities in the context of predictive assessments of annualized performance during some timeframe of interest. Different operating conditions, called scenarios, are identified for the analysis timeframe of interest, such as the AM peak, along with their frequency occurrence and for each scenario the average travel time during the peak 15 minute period is computed. These average values are then averaged again on a weighted basis, and the result is divided by the free flow travel time. One problem with this metric is that it only focuses on the mean value during the period of interest, not other percentiles of the distribution. So, while the TTI might be acceptable, the spread in the values might be such that the higher percentile values are not.
BI =
F −1 (0.95) F −1 (0.05)
(3)
Cumulative Density Function: The cumulative distribution function (CDF) is not a single metric but rather a depiction of all the values observed. The SHRP 2 L02 guide [9] recommends the use of CDFs for reliability assessment. If the data are 5-minute average travel times, the CDF captures the entire distribution of these values. The metric as such, is really the picture of this distribution: its locus of the CDF and its shape. If the CDF shifts toward the origin, the performance of the facility has improved, and if the CDF becomes steeper, the reliability has improved as well. Ideally, the 0th and the 100th percentile travel times are the same. Then the facility is extremely reliable. Even if the 0th percentile travel time is higher during the peak hours than it is off-peak, if the difference between the 0th and the 100th percentile travel times is still small, then the travel times are reliable. They are simply not as low as those obtainable off peak. The CDF makes the case that both the locus of the travel times and their spread are important in assessing travel time reliability.
Planning Time Index: The planning time index is also defined by the Urban Congestion Report [3]. It is the ratio of the 95th percentile travel time to the free-flow travel time. Again, this is ratio of the 95th percentile of the average travel times observed across some time frame to the free-flow travel time across all time periods (e.g., the 5th percentile travel time overall). A suitable formula for computing planning time index is:
PTI =
(F −1 (0.95) − µ) µ
Semi-Standard Deviation: SHRP-2 L02 [9] also suggests the use of a single value metric called the semistandard deviation. It is similar to the more traditional standard deviation, but only the observed values greater than a reference are considered. This metric is commonly used by financial analysts to assess risk. For the average travel rates observed across a specific time-frame, let τk be the travel rate in minutes per mile observed during (5-minute) time period k and let r be the reference value against which the travel rates are compared (e.g., the rate equivalent to some acceptable speed (e.g., 45 mph). Then, then σr , the semi-standard deviation based on reference value r is:
(2)
The PTI is better than the TTI in that it focuses on a percentile of the travel time distribution rather than the mean. But it has the same potential for ambiguity because the freeflow travel time can also change. Another shortcoming of this metric is that it does not focus on the distribution of the 2132
σr =
v n uX u u δk (τk − r)2 t i=1
n
IV.
C ASE S TUDY
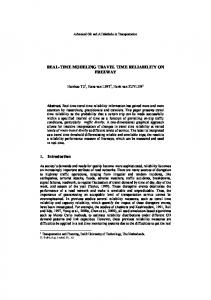
The case study focuses on Bluetooth data obtained from individual vehicles on a 5-mile section of I-5 in Sacramento, CA. The data were collected both northbound and southbound during January through April, 2011. Figure 1 shows where the four Bluetooth readers were stationed.
(4)
where δk = 1 if τk > r and δk = 0 otherwise As can be seen, travel times below r do not contribute to the metric, only those above (as opposed to the standard deviation where all values contribute). In effect, this metric is a delay measure. If the reference value is thought of as being an acceptable travel rate during the period of interest, then the metric represents a root-mean-square delay. As such, it can be used to determine whether a facility is providing acceptable travel times. If σr = 0 then the travel times are 100% acceptable. There may still be variance in the classical sense, but none of the observations are above the reference threshold. III.
M ETHODOLOGY
The purpose of this paper, as indicated before, is to see what metrics provide useful information in the context of real-time, individual vehicle-based travel time data. The metrics being examined are the TTI, the PTI, the BI, the CDF, and a newly proposed metric that is a pairwise combination of the root mean square travel rate, τrms , and the standard deviation of the travel rates στ . If a set of n vehicle travel rates are observed and τj is the travel rate in minutes per mile for vehicle j, then τrms is:
τrms =
v u n uX u (τj )2 u t j=1 n
Fig. 1.
The distances between the stations (going southbound) were 3.6 miles, 1.1 miles, and 0.9 miles, respectively. Full details on data collection and data processing can be found in a previous paper [10]. Figure 2 shows a plot of the individual vehicle travel rates for vehicles traveling north from monitoring station 11 to 10 (the southernmost pair) on February 2, 2011. This day is typical.
(5)
The difference, vis-a-vis the more typical mean value, is that τrms places greater emphasis on the larger travel rates. The values are squared before they are averaged. As some readers might realize, this is the L2 norm, as opposed to the L1 norm, which is the more typically used average; or the L∞ norm, which is the maximum.
It is easy to see that there is an AM peak period going northbound. It lasts from about 6:30 to 9:00 and it never reaches steady state. The travel rates grow from about 1 min/mi to 5 min/mi and then drop back to 1 min/mi. The spread among the rates is relatively small off-peak and it increases and then decreases during the peak.
It is suggested that τrms should be used in combination with σt to conduct the reliability assessment. As is likely to be well known, for the same set of n vehicles with travel rates τj , σt is given by equation (5) assuming µt is the average travel rate for those vehicles:
στ =
v u n uX u (τj − µτ )2 u t j=1 n
I-5 in Sacramento
For purposes of analysis, the observations were first binned by direction and then segment. They were subsequently placed in chronological order. After this was done, overlapping sets of 50 observations were used to develop statistical measures. The first set of 50 data points was examined, and then 26-75, 51-100, and so on. The timespan for these observations varies, of course, and is as little as 8-10 minutes during the peaks. It is less than 30 minutes most of the time but can range up to 3 hours off-peak.
(6)
Figure 3 presents a plot of selected percentiles of the vehicle travel rates for the same date as Figure 2. Shown are the 5th, 25th, 50th , 75th , and 95th percentile travel times.
Although both the USDOT guide [1] and NCHRP report 618 [2] discourage use of the standard deviation as a reliability performance metric, it is a very powerful metric used in many contexts to gain a sense of the consistency in the data. And reliability is about consistency.
Since the top line is the 95th percentile and the free flow travel rate is slightly less than 1 min/mi, the 95th 2133
Fig. 4. Fig. 2.
Trends in τrms and στ between stations 11 and 10 on 2/2/2011
Observed travel rates between stations 11 and 10 on 2/2/2011
percentile values effectively show the PTI. And since the middle line is the 50th percentile, it is effectively the TTI. As the inset shows, these two metrics follow slightly different trends during the peak periods. The BI is effectively the ratio between the 95th percentile travel rate and the 50th percentile rate. While both the PTI and TTI trends are both similar, neither one gives information about the trends in the overall distribution of travel rates. The focus on the high percentiles but not the lower ones. Only the CDFs, as shown by the families of vertical data points, indicate how the distribution of travel rates varies. It is for this reason that the SHRP-2 L02 reports [9] emphasize the value in using the CDFs. Management actions that reduce the lower percentile travel rates are beneficial in terms of reliability even if the higher percentile travel times remain unchanged. The service quality for some of the travelers is improved.
Fig. 5. Trends in the averages of the performance metrics for segment 11-10 for all monitored weekdays
information for decision-making, both in real-time and expost-facto. From the viewpoint of these authors, the CDFs provide the clearest picture. They show the shifts in the percentiles of the distribution very clearly. If a TMC operators wants to know if actions being taken are useful (e.g., incident response, pricing, route guidance, travel time messages), they can monitor the CDF trends and see unequivocally how the travel times are changing and whether they are improving. And if something seems to be going awry on a given day, the CDF trend will show it. The TTI, PTI, and BI, are also useful in this regard, but they only indicate what is happening to the higher percentiles or the spread in the distribution, not the actual travel time or travel rate values.
Fig. 3. Percentiles of the travel rates between stations 11 and 10 on 2/2/2011
Figure 4 presents trends in τrms and στ for the same day in February. As can be seen, both τrms and στ increase during the peak period. τrms grows fourfold from 1 to 4 min/mi while στ increases eightfold from 0.1 to 0.8. Just to check, the z value for 5% on a Normal (0,1) distribution is -1.64 and for 95% it is 1.64. Hence the range from 5% to 95% on the CDF ought to be about 2.6 min/mi; and it is.
In principle, the combined values of τrms and στ should also be helpful, but visualizing the implications of the trends in Figure 4 or 5(b) is difficult. It is easy to see that τrms increases during the peak as does στ but it is hard to visualize how the two trends combine except to say that the travel rates are higher and the spread is larger.
For this same segment, Figures 5(a) and 5(b) present the average trends in the percentiles and the other metrics for all of the weekdays in the data collected. The same trends from Figures 3 and 4 can be seen. But in this instance, the picture is comprehensive. While TMC operators might use the data in Figures 3 and 4 to manage the freeways operation in real time, they can use Figure 5 to examine longer term trends, ex-post-facto.
However, scatterplots of τrms and στ can be enlightening. Assume that τrms is plotted against στ and that the data points emerge with time. That is, each new set of probe observations produces a new point in the plot. (Or ex-postfacto, each data point represents a (τrms , στ ) combination for some point in time.)
The question is: which of these metrics provide useful 2134
Figure 6 shows two of these scatterplots. The one on the left is for the NB direction. The one on the right is for the SB direction. To some degree, due to over-plotting, it is hard to see every trend present within the subplot; however, in general, high values of (τrms , στ ) correspond to peak flow conditions or incidents.
Fig. 6.
this event are shown in Figure 8. The data points lie along a line having a positive slope.
Fig. 8.
Scatterplots of (τrms , στ )(All Data)
Scatterplots of τrms and στ during an incident
A chronological plot of the στ values on all three segments are shown in Figure 9. It is interesting that the trends are different on the three segments. Our sense is that this shows the geometric conditions and traffic interactions are different on each of the segments.
The data can be separated into two categories, one for conditions that are normal and one for those where there is a non-recurring event. A k-means clustering procedure [11] was used to bin the data into one of the six clusters. The details of how this binning was done can be found in a previous publication [10]. Each cluster represents an operating condition.
Fig. 9.
Trends in στ during an incident
V.
Fig. 7.
F REQUENCY TABLES
This section presents frequency tables for the (τrms , στ ) combinations. We think these tables can be valuable in evaluating the reliability of a specific segment/route. Expost-facto, they provide a way to compare the reliability of one segment/route with that of the other. The unique reference key is the combination (τrms , στ ) and its frequency is the number of times (or percentage of times) that those combinations of reliability measures occurred.
Scatterplots of Standard Deviation vs. RMS Rate
Scatterplots were created for each of these clusters. Figure 7 presents these results in four subplots. Subplots (a) & (b) are (τrms , στ ) plots for off-peak normal conditions I-5 NB and SB. As one might expect, the data points have low values of both τrms and στ . Subplots (c) and (d) are for peak traffic conditions. Again as would be expected based on the preceding figures, the data points in these subplots lie along lines where both τrms and στ are increasing and decreasing. The data points in the top-right corner of plot (c) are likely to be due to a non-recurring event on link 1110 that could not be identified ex-post-facto. The clustering algorithm couldnt distinguish these points from the rest in that cluster. Otherwise, the trends in subplot (c) are similar to subplot (d).
Tables 1 and 2 represent (τrms , στ ) frequency tables for I-5 SB and NB respectively. Each of these tables has four sub-tables: one for each of the three links, and the other for i the entire route. In the case of SB a threshold of τrms ≥5 and η ≥ 10 deemed undesirable. These threshold bounds in i the case of NB are τrms ≥ 4 and η ≥ 10 and the records that satisfy these threshold conditions are highlighted in bold. Here η is the frequency corresponding to (τrms , στ ). Again, the chosen thresholds are just for the purposes of discussion. As one can notice, link 39-9 struggles to deliver reliable travel rates; and the source of unreliability in the SB direction is that link. On the other hand the travel rates in the NB direction are consistent.
There was an incident on March 15th around 14:30 on I-5 SB. A scatterplot of the (τrms , στ ) combinations during 2135
(τrms , στ ) TABLE FOR I-5 SB
TABLE I. Link 39-9 SD
Link 9-10
RMS Freq
0.067 0.067 0.067 0.072 0.072 0.076 0.076 0.079 0.079 0.079 0.082 0.082 0.086 0.086 0.086 0.09 0.1 0.1 0.1 0.212 0.212 1.242
0.958 1.17 5.403 0.941 5.43 0.958 5.403 0.941 1.17 5.403 0.948 5.403 0.958 1.17 5.403 5.403 1.01 1.17 5.403 1.17 5.403 5.403
81 15 37 2 118 5 120 2 94 8 3 116 16 118 10 117 98 2 15 102 20 123
SD 0.072 0.072 0.072 0.079 0.084 0.084 0.084 0.089 0.089 0.092 0.092 0.092 0.096 0.096 0.096 0.099 0.099 0.105 0.105 0.128 0.128 1.928
0.886 0.972 8.306 0.972 0.886 0.922 0.972 0.908 0.972 0.893 0.922 0.972 0.922 0.972 8.306 0.972 8.306 0.972 8.306 0.972 8.306 8.306
Link 11-10
0.081 0.081 0.081 0.086 0.086 0.09 0.09 0.093 0.093 0.097 0.097 0.102 0.102 0.114 0.114 0.171 0.171 0.339 0.339 1.549
RMS Freq 0.887 0.982 4.169 0.924 0.982 0.943 0.982 0.924 0.982 0.913 0.982 0.943 0.982 0.943 0.982 0.982 4.169 1.233 4.169 4.169
48 66 1 2 119 6 123 61 42 83 41 110 12 6 110 100 16 3 116 119
SD
Route
RMS Freq
82 0.097 41 0.097 2 0.102 128 0.102 64 0.106 39 0.106 12 0.109 118 0.109 19 0.112 59 0.112 28 0.117 11 0.117 124 0.117 13 0.121 1 0.121 12 0.121 86 0.132 13 0.132 128 0.132 116 0.188 3 0.188 123 10.764
0.998 1.085 0.929 1.085 0.998 1.085 0.964 1.085 0.998 1.085 0.964 1.085 11.055 0.978 1.085 11.055 0.998 1.085 11.055 1.085 11.055 11.055
97 33 3 121 94 33 62 44 104 3 24 11 116 77 20 1 2 135 3 103 13 123
SD
RMS Freq
0.070 0.070 0.070 0.077 0.077 0.082 0.085 0.085 0.085 0.089 0.089 0.089 0.092 0.092 0.098 0.098 0.098 0.120 0.120 0.284 0.284 3.579
0.912 1.069 6.391 1.000 6.391 6.391 0.929 1.069 6.391 0.936 1.000 6.391 1.000 6.391 0.961 1.069 6.391 1.000 6.391 1.069 6.391 6.391
3 111 6 9 109 127 3 9 112 1 117 3 119 3 4 6 110 5 118 14 109 122
Based on this analysis, the authors assert that τrms can be used effectively in conjunction with the standard deviation to monitor travel time reliability. Furthermore, frequency tables based on (τrms , στ ) can be useful in comparing the reliability of one segment/route with another; and such comparisons will make it straightforward to rank order projects intended to improve reliability. VII.
Link 10-9 SD
Link 9-39
RMS Freq
0.070 0.077 0.077 0.081 0.081 0.081 0.084 0.084 0.087 0.087 0.087 0.091 0.091 0.091 0.094 0.094 0.099 0.163 0.163 1.241
1.092 0.943 1.092 0.926 1.092 4.599 0.966 1.092 0.937 0.943 1.092 0.943 0.966 1.092 0.951 1.092 1.092 1.092 4.599 4.599
VI.
106 1 139 1 116 1 106 7 67 2 41 79 11 45 1 93 123 118 8 119
SD 0.071 0.071 0.077 0.077 0.077 0.080 0.083 0.083 0.087 0.087 0.087 0.090 0.090 0.094 0.094 0.101 0.101 0.156 0.156 0.668
Route
RMS Freq 0.951 3.020 0.923 0.963 3.020 3.020 0.963 3.020 0.963 1.111 3.020 0.963 3.020 0.963 3.020 1.111 3.020 1.111 3.020 3.020
ACKNOWLEDGMENTS
The authors would like to acknowledge the support and encouragement provided by the SHRP-2 staff during project L02, which forms the basis for much of the material presented here. Of special note is William Hyman who served as the contract manager through much of the development work.
(τrms , στ ) TABLE FOR I-5 NB
TABLE II.
SD
Link 10-11
RMS Freq
trends do provide this information, and they are very useful, but for real-time monitoring they are somewhat cumbersome and can are only useful when examined in chronological sequence. The combinations τrms and στ do provide this information. And they can be plotted in a two-dimensional space so that trends in distribution of the travel rates (travel times) can be understood easily.
94 27 49 50 22 104 95 21 4 9 126 79 30 3 121 6 106 3 116 119
SD 0.609 0.609 0.609 0.074 0.074 0.077 0.077 0.080 0.080 0.083 0.083 0.087 0.087 0.091 0.091 0.103 0.103 0.182 0.182 0.852
R EFERENCES
RMS Freq 0.960 1.101 3.254 0.980 3.254 0.960 3.254 1.101 3.254 0.940 3.254 0.960 3.254 1.101 3.254 0.980 3.254 1.101 3.254 3.254
43 3 74 98 27 56 52 13 111 58 54 106 25 92 15 92 26 86 34 119
[1]
[2]
[3]
[4]
[5]
C ONCLUSION
[6]
This paper has examined the merits of various metrics that can be used to monitor travel time reliability based on data from individual vehicles, both in real time and ex-postfacto. After several existing metrics are reviewed, a new pair of metrics is proposed: the root-mean-square travel rate τrms in combination with the standard deviation στ . We assert that this pair of metrics provides a very useful way to monitor and analyze travel time reliability.
[7]
[8]
[9]
While popular metrics like the TTI, PTI, and BI, are clearly valuable, and they provide indications of whether the distribution of travel times is compact or spread out, they do not reveal information about how the lower percentiles of the travel rate (travel time) distribution change. And it seems to always be true that the lower percentiles increase when the higher percentiles increase. But not to the same degree, which is reflected in the fact that στ also increases. The CDF
[10]
[11]
2136
T. J. Lomax, S. Turner, R. A. Margiotta, and C. Systematics, Monitoring Urban Roadways: Using Archived Operations Data for Reliability and Mobility Measurement. Federal Highway Administration, 2001. C. Systematics, “Performance measurement framework for highway capacity decision making, shrp2 capacity research,” S2-C02-RR. http://onlinepubs. trb. org/onlinepubs/shrp2/shrp2 S2-C02-RR. pdf. Accessed September 10, Tech. Rep., 2011. T. Lomax, D. Schrank, S. Turner, and R. Margiotta, “Selecting travel reliability measures. texas transportation institute, cambridge systematics,” 2003. W. Jenks, F. Jenks, L. Sundstorm, and P. Delanely, “B. hagood.(2008). nchrp report 618: Cost effective performance measures for travel time delay, variation and reliablity,” Transportation Research Board. Washington DC: National Accadamy. R. Margiotta, T. Lomax, M. Hallenbeck, R. Dowling, A. Skabardonis, and S. Turner, “Shrp 2 report s2-l03-rr-1: Analytical procedures for determining the impacts of reliability mitigation strategies,” Transportation Research Board of the National Academies, Washington, DC, 2013. J. Dong and H. Mahmassani, “Flow breakdown and travel time reliability,” Transportation Research Record: Journal of the Transportation Research Board, no. 2124, pp. 203–212, 2009. R. G. Dowling, A. Skabardonis, R. A. Margiotta, and M. E. Hallenbeck, “Reliability breakpoints on freeways,” in Transportation Research Board 88th Annual Meeting, no. 09-0813, 2009. R. Dowling, J. Barrios, G. Karkee, S. Ashiabor, and T. Kiattikomol, “Shrp2-l08 internal 9 report: Freeway free-flow speed adjustment factors for weather,” 2012. G. F. List, B. Williams, N. Rouphail, R. Hranac, T. Barkley, E. Mai, A. Ciccarelli, L. Rodegerdts, A. F. Karr, X. Zhou et al., Guide to Establishing Monitoring Programs for Travel Time Reliability, 2014, no. SHRP 2 Report S2-L02-RR-2. I. Isukapati, G. List, B. Williams, and A. Karr, “Synthesizing route travel time distributions from segment travel time distributions,” Transportation Research Record: Journal of the Transportation Research Board, no. 2396, pp. 71–81, 2013. J. A. Hartigan and M. A. Wong, “Algorithm as 136: A k-means clustering algorithm,” Journal of the Royal Statistical Society. Series C (Applied Statistics), vol. 28, no. 1, pp. 100–108, 1979.