Proceedings of World Congress on Medical Physics and Biomedical Engineering, Chicago, July 2000.
Using Wavelet Coefficients for the Classification of the Electrocardiogram P. de Chazal1, B. G. Celler1 and R. B. Reilly2
Abstract - This study investigates the automatic classification of the Frank lead electrocardiogram (ECG) into different pathophysiological disease categories. Coefficients from the discrete wavelet transform are used to represent the ECG diagnostic information and a comparison of the performance of classifiers processing feature sets generated using different mother wavelets is made. Fifteen feature sets are calculated from three Daubechies wavelets, with the decomposition level varied between 3 and 7. The classification performance of each feature set was optimised using automatic feature selection and by combining classifications of multi-beat ECG information. Throughout the study a database of 500 ECG records with examples from seven disease categories was used. The classification of each record is known with 100% confidence and is based on ECG independent information. Using multiple runs of 10-fold cross-validation to obtain all results, it was shown that the overall classification performance of the different feature sets was 71.6-74.2%. In addition, the wavelet order and level had little influence on the overall performance. Analysis of the automatically chosen features reveal that time-frequency bands in the vicinity of the QRS onset and the T-wave are consistently selected. Key words – ECG classification, Wavelets, Cross-validation 1
INTRODUCTION
The classification of the electrocardiogram (ECG) into different pathophysiological disease categories is a complex pattern recognition task. Computer based classification of the ECG can achieve high accuracy and offers the potential of affordable mass screening for cardiac abnormalities. Successful classification is achieved by finding characteristic shapes of the ECG that discriminate effectively between the required diagnostic categories. Conventionally, a typical heart beat is identified from the ECG and the component waves of the QRS, T and possibly P waves are characterised using measurements such as magnitude, duration and area. Classification is then achieved on the basis of these measurements. Measurements based on QRS, T and P sections
vary significantly even among normals and can lead to misclassification. Wavelet analysis of a signal consists of breaking up a signal into shifted and scaled versions of a reference (mother) wavelet. A wavelet is a signal of effectively limited duration that has an average value of zero. In determining the wavelet (decomposition) coefficients of a signal, the correlation of the mother wavelet at different shifts and scales with the signal is computed. Hence, the wavelet coefficients represent measures of similarity of the local shape of the signal to the mother wavelet under different shifts and scales. We utilise this property in this study by using the wavelet coefficients to describe the ECG shape. Classification is performed directly on the wavelet coefficients. There is no intuitive way to know which mother wavelet to choose or what level decomposition to use. In this study we consider a range of Daubechies wavelets and decomposition levels. A database of modest size was employed hence a crossvalidation scheme was used to estimate the performance of the different feature sets. 2
METHODS
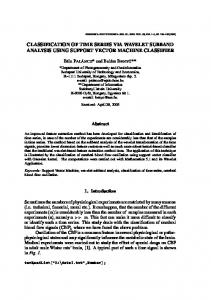
In this study the Frank lead ECG [1] has been used. The Frank lead ECG record presents three ECG signals that project the electrical field generated by the muscular tissue of the heart onto the mutually orthogonal sagittal, frontal and transverse planes. The Frank system attempts to compensate for distortions of the electric field introduced by the irregular shape of the human torso. In practice the Frank lead signals are approximate orthogonal views due to the wide variation of shapes and tissue content of human torsos. Figure 1 shows the data processing steps used in this study. 2.1
ECG PRE-PROCESSING.
The ECG is sampled at 500 Hz then filtered with a 0.5 - 40 Hz linear phase digital bandpass filter to remove unwanted baseline drift and powerline interference. All QRS complexes are detected and data windows containing the P-QRS-T complexes are isolated for each beat using the ECG samples in the range 200ms before the R-wave maximum points to 400ms after the R-wave maximas. The isopotential value is subtracted, and the data window multiplied with a Hanning
World Congress on Medical Physics and Biomedical Engineering in 2000, Chicago, July 23-28,2000
4/4/00
Proceedings of World Congress on Medical Physics and Biomedical Engineering, Chicago, July 2000. Age & sex X lead
Z lead
Preprocessing
Wavelet Transform.
Feature Selection
Classifier Training
Classification
Performance Measuring
Training Testing
Preprocessing
Wavelet Transform.
= 50 Frank lead records for training
= 50 Frank lead records for testing
Figure 1: Data processing stages. The available ECG data is divided into a number of sub-groups (folds) as per the crossvalidation scheme. Each lead is pre-processed with a bandpass filter and the DWT is computed. The training data is then used for feature selection and final classifier training. The classification performance is estimated on the test data. window to ensure the end points are zero and thus eliminating possible edge effects. 2.2
WAVELET DECOMPOSITION
Multilevel discrete wavelet decompositions of each data window were calculated using Daubechies wavelets of different orders [2]. The wavelets were chosen as the order determines the time and frequency resolution of the decomposition. Low order Daubechies wavelets have good time resolution but poor frequency resolution whereas high order wavelets have good frequency resolution and poor time resolution. We used Daubechies wavelets of orders 1, 4 and 10 to include a range of time and frequency resolutions. In all cases the detail information of levels 1 and 2 was discarded, as the frequencies covered by these levels were higher than frequency content of the ECG. Thus for a level m decomposition, coefficients associated with approximation level m and details level 3 to m were retained for further processing. In this study we considered levels 3, 4, 5, 6 and 7. 2.3
CLASSIFIER
A supervised training technique was used to derive a classifier. In supervised training, a classifier model that maps the input features to the required output classes is chosen. The model has a set of adjustable parameters that are optimised using training data. For this study, linear discriminants [3] were used as the classifier model. Linear discriminants partition the feature space into the different classes using a set of hyper-planes. Although this is a very restrictive condition, linear discriminants are extremely fast to calculate relative to other classifier building techniques. In response to a set of input features, the output of the classifier is a set of numbers representing the probability estimate of each class. The final classification is obtained by choosing the class with the highest probability estimate.
Other classifier models such as logistic discrimination and feed forward neural networks impose less restrictive conditions on the feature partitioning but, in practice, linear discriminants perform as effectively for ECG classification [4]. 2.4
FEATURE SELECTION
The performance of most classifier training algorithms is degraded when one or more of the available features are redundant or irrelevant. Redundant features occur when two or more features are correlated whereas irrelevant features do not separate the classes to any useful degree. The classification performance of a given set of features may often be improved by searching for a subset of the features with higher performance. Finding this optimal subset is generally computationally intractable for anything apart from very small feature sets. This is because the number of possible subsets rises exponentially with size of the feature set. In practice a sub-optimal search procedure is used. We have used a step-up selection procedure. Beginning with the empty feature set, all possible features sets containing one feature are generated. The classification performance of all these feature sets is evaluated and the set with the best performance retained. This set is expanded to sets of two features by adding all remaining features one at a time. The performance of these feature sets is evaluated and the set with the best performance retained. This process is repeated until the performance no longer improves significantly with the addition of extra features. When comparing the subsets, the best performance measure to use is the classification performance but again computational restrictions prevent this being implemented. We have used Wilk’s Lambda [7], which is a measure of class separation to measure the performance of the subsets. A low value of Wilk’s lambda indicates good separation of the classes and hence high classification performance. Hence
World Congress on Medical Physics and Biomedical Engineering in 2000, Chicago, July 23-28,2000
4/4/00
Proceedings of World Congress on Medical Physics and Biomedical Engineering, Chicago, July 2000. Wavelet DB1 DB4 DB10
3 73.1 73.2 72.2
4 73.2 72.7 74.2
Level 5 73.1 72.4 71.6
6 73.0 72.3 74.0
7 73.0 72.6 71.8
Table 1: The overall classification accuracy (percentage) of classifiers developed using selected wavelets coefficients from different mother wavelets and decomposition levels. The standard deviation of all measurements is about 1.5%. All results are obtained from 10 runs of 10 fold cross-validation. feature selection involves finding a subset with the lowest value of Wilk’s lambda. 2.5
MULTIPLE BEAT CLASSIFICATION
To classify an ECG record, the classifier processes the feature information of each beat separately and a set of probabilities for each beat is determined. To obtain the final classification, the probabilities for each class are averaged across the beats and the class with the highest average probability estimate chosen. During the training phase, wavelet coefficient data is obtained from each beat and treated as separate training examples. By using diagnostic information from all beats more efficient use of the available ECG diagnostic information is made. 2.6
CLASSIFICATION PERFORMANCE ESTIMATION
When developing a classifier it is important to be able to estimate the expected performance of the classifier on data not used in training. The available data must be divided into independent training and test sets. There are a number of schemes for achieving this and the most suitable for the size of data set used in this study, is n-fold cross validation [5]. This scheme randomly divides the available data into n approximately equal size and mutually exclusive "folds". For an n-fold cross validation run, n classifiers are trained with a different fold used each time as the test set, while the other n-1 folds are used for the training data. The choice of n influences the ratio of data used for training/testing with an optimal value of n in the range 5-20. Cross validation estimates are generally pessimistically biased, as training is performed using a subsample of the available data. The randomising process was "stratified" so that all the folds contained the same relative proportions of normals and the six disease conditions. Studies have shown that stratification of the folds decreases both the bias and the variance of the performance estimate [5]. Cross validation estimates are highly variable and depend on the division of the data into folds. A decrease in the variance of the performance estimate may be achieved by averaging results from multiple runs of cross validation where a different random split of the training data into folds is used for each run. For this study ten runs of ten-fold cross validation were employed. The confidence interval for the performance estimate is calculated as the mean standard error of the different test fold accuracies per run i.e standard deviation of accuracies divided by the square root of n.
In this study we report the overall classification accuracy and the individual class sensitivities. The overall accuracy is the percentage of total cases correctly classified. The individual class sensitivities are the percentage of cases correctly classified of a particular class. 3
RESULTS
The ECG database used throughout this study contains 500 records with 155 normal (NOR) and 345 abnormal (ABN) cases. The classification of every record is known with 100% certainty. The validation was based on ECG independent clinical information, consisting of data derived from cardiac catheterisation, coronary angiography, left ventriculography, echocardiography and results from coronary care and cardiac surgery. The abnormal cases comprise 79 left ventricular hypertrophy (LVH), 21 right ventricular hypertrophy (RVH) and 25 bi-ventricular hypertrophy (BVH) cases; 77 anterior myocardial infarction (AMI), 111 inferior myocardial infarction (IMI) and 32 combined myocardial infarction (MIX) cases. Each case contained between eight to ten seconds of digitally sampled (500 Hz sampling rate) data from simultaneously recorded Frank lead ECGs. Thus, the 600ms data window used for each beat contained 300 samples. The fifteen feature sets were generated from the wavelet coefficients obtained by applying the different wavelet transforms to all beats of the 500 ECG records. The age and sex of the each patient were added to each feature set. The feature sets were processed in an identical way. For every run of every fold of cross-validation, automatic feature selection was applied to each feature set and 20 features were identified that maximised the classification performance. These features were then used to train the classifier and the classification performance on the test-set determined. Table 1 shows the overall classification accuracy obtained using cross-validation for the classifier processing the different feature sets. Using the Daubechies order 1 (Haar) wavelet, the classification accuracy ranged between 73.0% and 73.2%. As the standard deviation of the accuracy measurements is about 1.5%, there is no significant difference in the classification rate with decomposition level. This was a surprising result as it was expected that decomposing the ECG signals to different levels would effect the classification rate. The same trends can be seen for Daubechies order 4 and 10 wavelets – no variation in classification rate with the decomposition level. In addition, there was no significant difference in the classification rate with the wavelet order. Thus, for the number of samples in the data window, the classification rate was not influenced by decomposition level or wavelet type.
World Congress on Medical Physics and Biomedical Engineering in 2000, Chicago, July 23-28,2000
4/4/00
Proceedings of World Congress on Medical Physics and Biomedical Engineering, Chicago, July 2000.
Test Train
Accuracy (%) 7-way 2-way 73.1 89.0 79.2 91.2
Size
NOR 90 92
LVH 67 73
155
79
Individual Class Sensitivities (%) RVH BVH AMI IMI 20 40 70 84 37 56 79 87 21
25
77
111
MIX 40 54
ABN 89 91
32
Table 2: The overall accuracy (percentage) and individual class sensitivities (percentage) for the classifier using the selected coefficients from the Daubechies order 1 wavelet (Haar wavelet) three-level decomposition of the ECG. Results for the testing and training sets are shown. The last row shows the class sizes. All results are obtained from 10 runs of 10 fold cross-validation. Table 2 shows the individual class sensitivities of the classifier trained using the Daubechies 1 level 3 dataset. The testing and training set results are shown. The seven–way accuracy is 73.1% with a specificity (NOR sensitivity) of 90%. The sensitivities of the large disease classes (LVH, AMI and IMI) range between 67% and 84%. The sensitivities of the small classes (RVH, BVH and MIX) are low and range between 20% and 40%. These three classes have 32 or fewer examples each and probably are not large enough for effective training of the classifier. The two-way or normal/abnormal accuracy is calculated by considering as correct a diagnosis of an abnormal recording into any of the six disease conditions. The results are shown in the second column of Table 2 and the classification rate increased to 89.0%. The last column shows the sensitivity of an abnormal classification is 89%. It is possible to compare our results to the classification performance achieved by cardiologists assessed in the Common Standards in Electrocardiography (CSE) project [6]. The cardiologists diagnosed a similar ECG database into the same seven categories considered in this study. The proportions of the classes were similar making a direct comparison of overall accuracy possible. In the CSE project, five cardiologists classified the ECG and achieved accuracy rates between 67.5% and 74.4% [6]. Our classification rates thus compares well with rates achieved by cardiologists. A final processing step was to compare the selected wavelet coefficients across the different feature sets. A number of trends were observed. Firstly, the age and sex features of the patient were always chosen. Secondly, more wavelet coefficients were selected from the X and Z lead than the Y lead and thirdly wavelet coefficients representing the high frequency information of the QRS onset and the low frequency information of the T wave tended to be chosen. 4
SUMMARY
This study has compared the classification performance of feature sets formed from the discrete-wavelet-transform coefficients of different mother wavelets. Fifteen feature sets were calculated using Daubechies wavelets of order 1, 4 and 10 with the decomposition level varied between 3 and 7. Classification performance was optimised by using automatic feature selection and by combining classifications of multi-beat ECG information. Results show that the overall classification performance of the different feature sets was 71.6-74.2% and that the wavelet
order and level had little influence on the overall performance. This compares well to the classification performance of cardiologists. Our results suggest that the Daubechies 1 (Haar) wavelet is best suited to the classification task as it requires the least computation. The final structure for the proposed classifier is very computationally efficient and easily lends itself to real-time implementation. After detection of each R-wave, the Haar wavelet decomposition is used to find the 20 required wavelet coefficients. A linear discriminant classifier processes the coefficients and a classification is found for the each heart beat. The final classification is found by combining the individual classifications. Currently, possible enhancements to classification performance using other wavelets are being investigated together with the use of the wavelet packet transform. 5
REFERENCES
[1] E. Frank, “An Accurate and Clinically Practical System for Spatial Vectorcardiography,” Circulation, vol. 13 (May), pp. 737-749, 1956. [2] M. Vetterli and C. Herley, “Wavelets and Filter Banks: Theory and Design,” IEEE Trans. on Signal Processing, vol. 40, No. 9, September, pp. 2207-2232, 1992. [3] B. D. Ripley, “Pattern Recognition and Neural Networks”, Cambridge, England: Cambridge University Press, 1996. [4] J.L. Willems and E. Lesaffre, “Comparison of multigroup logistic and linear discriminant ECG and VCG classification”, Journal of Electrocardiology, vol. 20(2), pp 83-92, 1987. [5] R. Kohavi, “A study of cross validation and bootstrap for accuracy estimation and model selection”, In Proceedings of the 14th International Joint Conference on Artificial Intelligence, 1137-1143, 1995. [6] J. Willems et al, “Comparison of Diagnostic Results of ECG Computer Programs and Cardiologists”, Proceedings of the Computers in Cardiology Conference, Durham, North Carolina, pp. 93-96, 1992. [7] M. James, “Classification Algorithms”, New York, John Wiley and Sons, 1985. 1
Biomedical Systems Laboratory, School of Electrical Engineering, University of New South Wales, Sydney 2052, Australia
[email protected] [email protected] 2 Digital Signal Processing Laboratory, Department of Electronic and Electrical Engineering, University College Dublin, Dublin 4, Republic of Ireland
[email protected]
World Congress on Medical Physics and Biomedical Engineering in 2000, Chicago, July 23-28,2000
4/4/00