Using Wavelets for Smoothing and Denoising Gated Blood Pool Images O Blagosklonov, L Comas, R Sabbah, J Verdenet, M Baud, JC Cardot University of Franche-Comté and Jean Minjoz University Hospital, Besançon, France Abstract This paper presents a method of wavelet application for the denoising of gated blood pool image series. Our method is based on the transformation of image series into periodical 1D signal followed by the application of 1D wavelets. We used visual analysis of resulting images, Fourier analysis, analysis of gradient images and analysis of time-activity curves to compare the performances of the method presented and the “classical” image-by-image 2D wavelet spatial smoothing. Our results showed that the series smoothing by 1D wavelets may be a good alternative to 2D wavelet smoothing and may offer more accurate image denoising. We suggest that after validation on a statistically sufficient number of patients, the method presented can be easily introduced and used in routine nuclear cardiology practice.
1.
Introduction
Gated blood pool imaging (GBP) is one of the methods most used in nuclear cardiology [1-3]. This technique, one of the earliest developed for medical imaging, has not been abandoned because of numerous advantages: simple evaluation of the main parameters of cardiac function (ejection fraction, global and regional contractility, regurgitation fraction etc.); good visualization of right ventricle; it is practically the only method which can be easily performed during physical effort etc. However, some problems concerning image acquisition procedures as well as scintigraphic data processing must be resolved [4]. Some problems are caused by the fact that GBP is done in vivo. First of all, patient morphology can alter signal-to-noise ratio. Gamma rays emitted from the investigated organs are absorbed and diffused by other organs and structures. The other organs (lungs, vessels etc.) are also a source of gamma photons that can cause the superposition of the structures. The count time is rather short. Actually, the longer the time, the better the image quality will be. But this time cannot be too long because of immobility problems. The count rate of 400 kcounts per image is usually applied;
0276−6547/02 $17.00 © 2002 IEEE
therefore the acquisition time is about 15 min. The regularity of cardiac rhythm is indispensable. Cardiac cycle is usually divided by 16 so as to acquire a sequence of 16 images. Irregular rhythm can provoke a misrepresentation of heart motion. The patient must not move during acquisition. Another category of problems is due to physics and to the approximations applied during the acquisition. There are differences between the theoretical and real spectrum of the tracer: on the one hand, a spreading of the energy peak, and on the other hand, a part of the spectrum is far from the peak. The cone form of the peak can be explained by an expansion around the mean value because of the statistical nature of the signal. In fact, the tracer does not emit gamma rays continuously, and this varies counts/sec ratio. Because of these problems, and some of them are unavoidable, the acquired images must be treated to be interpretable: zoom on the heart zone, smoothing and denoising [4]. At the same time, image processing must be performed with a maximum of care and precision so that only the noise is removed and the loss of useful information is minimized, especially because of relatively small size of the matrix (mostly 64x64 pixels). Previous studies have been showed excellent performances of wavelet transform for denoising and compression of signals and images [5-8]. With this technique the characteristics of signals can be localized in frequency and time domains. Although wavelets and Fourier transform obtain coefficients from signals, wavelet transform is more appropriate for the study of non-static and non-predictable signals with compounds in low frequencies and fast transitions [8]. In our study, we tried to find a method for the simple and suitable application of wavelets to GBP image processing.
2.
Materials and methods
Gated blood pool imaging using albumin marked with 99mTc (12 MBq/kg) was performed in 30 patients at rest. A dual-head gamma camera (DST-XLi, SMV International, France) was used, equipped with lowenergy high-resolution collimators. The system detectors were opposite each other at 90°, and only one detector was used for the data acquisition. The data were acquired in gated mode without acquisition zoom (16 frames per
189
Computers in Cardiology 2002;29:189−192.
cardiac cycle, 64 x 64 matrix, 400 kcounts per image). LAO view was used for all studies. The image processing was performed in MATLAB version 5.3 on standard PC ( PIII-733, 256 Mb RAM). We compared different methods of wavelet application: Image-by-image 2D wavelet spatial smoothing was performed according to the classical method of 2D wavelet denoising on each image of series. This approach considers series as a succession of independent images and ignores the significance of pixel temporal evolution. With pixel-by-pixel temporal smoothing we regarded temporal variations of each pixel as a signal and applied 1D wavelets to denoise it. This approach takes into account temporal evolution but ignores on neighboring pixel connections. Column temporal smoothing is similar to the above but instead of pixel-by-pixel procedure; we grouped pixels from each column and, thus, created a 2D image (64x16) representing temporal evolution of this column. Then, we applied 2D wavelets for image processing. For series smoothing by 1D wavelets, we built a signal consisting of the columns of each of the series images put end to end. The same treatment was done by taking images not by columns but by lines. This approach transforms a series of 2D images into 1D periodical signal. We tested each method of wavelet application using 4 wavelet families: (1) Daubechies; (2) Symlet; (3) Coiflet; (4) Biorthogonal. We performed the following analysis to determine the most suitable method of wavelet application: (1) visual analysis of resulting images; (2) analysis of mean image intensities; (3) analysis of gradient images; (4) Fourier analysis; (5) analysis of time-activity curves (TAC) for 5 characteristic regions of image (left ventricle, right ventricle, atrium, high-background noise region and lowbackground noise region).
3.
Results
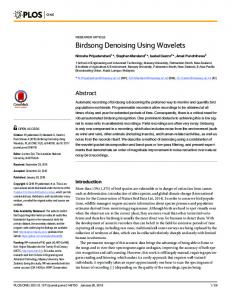
Visual analysis of the resulting images eliminated two methods of wavelet application: the pixel-by-pixel temporal smoothing and the column temporal smoothing. Pixel-by-pixel temporal smoothing was discarded since, because of the low number of data sets (16) and ignoring of the neighboring pixel connections, we observed significant spatial deformations on the resulting images (Figure 1). This method was also very time consuming (about 3 min per image processing cycle). Smoothing of columns evolution was discarded also because of the geometrical deformations on the resulting images. For the two other methods of the series representation (succession of 2D images and transformation of series into 1D signal), visual analysis showed no visible degradation of image quality (Figure 1).
A
B
C
D
E
F
G
H
Figure 1. Initial series (A and B) and resulting images of pixel-by-pixel temporal smoothing (C and D), of imageby-image 2D spatial smoothing (E and F), and of series smoothing by 1D wavelets (G and H); left column: 7th images of series, right column: 16th images. In GBP images series, the 7th image usually corresponds to endsystole and the 16th image corresponds to end-diastole. Wavelet denoising was performed using the Daubechies wavelet, order 2, level 2. The analysis of mean image intensity demonstrated that, for any given wavelet family, different methods of series representation can be classified according to loss of the intensity compared to initial series. The loss of intensity was least significant with series smoothing (transformed into 1D signal) by 1D wavelets. With 2D wavelet spatial smoothing, loss of intensity was the most
190
270
280
260
270
250
260 250
Activity
Activity
240 230 220 210
240 230 220 210
200
200
190
190 180
180 0
1
2
3
4
5
6
7
8
9
0
10 11 12 13 14 15 16
1
2
3
4
5
6
7
8
9
10 11 12 13 14 15 16
F ra m e s
F ra m e s
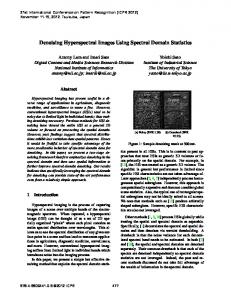
Figure 2. Example of time-activity curves in left ventricular ROI (left graph) and in right ventricular ROI (right graph) constructed from the initial series () and from resulting series after series smoothing by 1D wavelets () and after 2D wavelet spatial smoothing (U). significant. We also found that the loss of intensity was more homogeneous when series smoothing by 1D wavelets was applied. Fourier analysis showed that these two methods of wavelet application reduced the high frequency section of the image spectrum; series smoothing by 1D wavelets modified middle and low frequencies less than 2D wavelet spatial smoothing. The analysis of gradient images proved that contour detection was improved by both smoothing methods. The analysis of TACs showed that 2D wavelet spatial smoothing modified the TACs from ventricular and atrial regions much more than smoothing of transformed series by 1D wavelets (Figure 2).
4.
Discussion
The interpretation of GBP results requires a transformation of raw data acquired by the gamma camera; image smoothing and denoising play an important role in image processing [4]. Indeed, left ventricular ejection fraction (LVEF) is a parameter most often evaluated by GBP [1,3,4]; the calculation of its value is based on the difference between the intensity in LV ROI at diastole and systole [4]. The manual tracking of diastolic and systolic contours of LV is considered most accurate. Thus, a method of image smoothing and denoising which can facilitate the detection of contours with a minimal or without loss of information is of obvious interest in the improvement of GBP specificity and/or sensitivity. The advantages of wavelet transform in the domains of image denoising and compression are well known [5-8]. The great number of wavelet families is one of the reasons for the high suitability of this technique. However, despite excellent performances of wavelets for signal and 2D image processing, their application to 3D image processing (if the third dimension is time) and to dynamic study analysis is more difficult [9-11]. Recent papers have reported that a complex modification of
wavelet methodology can facilitate and improve the accuracy of wavelet transform for the analysis of dynamic images of heart [11]. In fact, the studies of cardiac function are affected by heart motions, and as a result, application of image processing techniques which take into account temporal organ shape evolution and its function is required. In our study, we tried to find a possibility of wavelet application for GBP images processing. The direct approach, that is the image-byimage application of 2D wavelets, did not seem to be entirely accurate because it provoked significant modifications of time-activity curves. The temporal regularity of image series could be disrupted, and could thus affect the detection of end-systole and end-diastole. We studied 4 methods of wavelet application to image smoothing and denoising. Pixel-by-pixel temporal smoothing evolution by 1D wavelets is perhaps the most simplest. However we had to eliminate this method after visual analysis because of significant deformations induced by the image processing. In fact, with this method, image series were transformed into 4096 (64x64) signals with only 16 points to characterize each signal. The number of points was insufficient to perform accurate signal processing; this could explain the failure of pixel-by-pixel temporal smoothing. Moreover, the use of this method provoked complete disruption of neighboring connections between image pixels, which worsened the deformations on resulting images. Column temporal smoothing had the same drawbacks. The main reason for the deformations caused by this method was the disruption of the neighboring connections. Indeed, these two methods induced even greater deformations than 2D wavelet spatial smoothing: the method which we tried to improve. We decided to discard these two methods and continue with another method based on the transformation of image series into periodical 1D signal followed by 1D wavelet denoising. Although this method requires the application of a mask to correct the minor
191
artifacts induced by the image processing, it does not break the regularity of image series; as a result, we observed only slight modifications of TACs after the smoothing. The image quality was identical to that obtained by the application of “classical” image-byimage 2D wavelet smoothing. Moreover, mean image intensity, markedly decreased by 2D wavelet spatial smoothing, was only slightly changed by our method. The regularity of mean intensity modification is probably more important than the degree of the modification itself. Indeed, one of the main problems which can be caused by the decrease in intensity is a modification of contrast on image, i.e. relative intensity between structures (the edges) on the image can be changed; if the decrease in intensity varies from image to image, it could modify the ratio of intensity between end-systolic and end-diastolic images and, thus, alter the estimation of ejection fraction. Our results showed that the decrease in intensity was more regular using series smoothing by 1D wavelets. We used the analysis of gradient images to confirm the results of visual analysis concerning contour detection. This analysis showed that gradient images were much less noisy after application of both smoothing methods. Therefore series smoothing by 1D wavelets and imageby-image 2D spatial smoothing can be considered accurate methods for improvement of contour detection. However our analysis was unable to determine which, and whether, one of these methods was better than the other. The results of Fourier analysis suggest that both methods can be used for image denoising; for all wavelet families, the smoothing reduced the high frequency section of the spectrum, i.e. background noise. However, we observed that modifications induced by series smoothing by 1D wavelets in low and middle frequencies were smaller than the ones induced by image-by-image 2D spatial smoothing. We suggest that the “classical” method caused a greater loss of useful information. Analysis of mean image intensity, analysis of gradient images and Fourier analysis provided important data concerning performances of smoothing methods studied. These analyses demonstrated the feasibility of accurate denoising of GBP image series by wavelet transform and showed that series smoothing by 1D wavelets might be more appropriate for GBP image processing than imageby-image 2D spatial smoothing. However, denoising and improvement of contour detection have an interest only if image processing does not cause a misrepresentation of important physiological parameters. In the case of GBP, time-activity curves represent temporal evolution of intensity in ROI. The time-activity curve of LV ROI reflects the evolution of LV volume during a cardiac cycle. Any modification of TAC can alter the ejection fraction evaluation – one of the most clinically important parameters of cardiac function, which is why we considered the modification of TACs as the decisive factor for method accuracy. Analysis of TACs confirmed
the results of Fourier analysis and analysis of gradient images, and proved that from methods studied, series smoothing by 1D wavelets was the most suitable. In conclusion, our results suggest that a simple transformation of GBP image series into periodical signals can be used for an accurate application of wavelet transform for smoothing and denoising of GBP images. This rapid method can be easily added to current image processing software and applied for routine use. We are continuing our studies to validate this approach on a statistically sufficient number of patients and to compare it with other denoising methods. These studies should also determine which wavelet family, which order, and what level of decomposition are the most appropriate for denoising and analysis of GBP images.
References [1] Verani MS, Willerson JT. Impact of nuclear cardiac imaging on the present and future practice of cardiology. Eur J Nucl Med 2000;27:S21-S26. [2] Zaret BL, Strauss HW. The past, present and future of nuclear cardiology. Rev Port Cardiol 2000;19:I9-I11. [3] Shaw LJ, Miller DD, Berman DS, Hachamovitch R. Clinical and economic outcomes assessment in nuclear cardiology. Q J Nucl Med 2000;44:138-152. [4] American Society of Nuclear Cardiology. Updated imaging guidelines for nuclear cardiology procedures, part 1. J Nucl Cardiol 2001;8:G5-G58. [5] Han C, Hatsukami TS, Yuan C. A multi-scale method for automatic correction of intensity non-uniformity in MR images. J Magn Reson Imaging 2001;13:428-436. [6] Wang JZ. Wavelets and imaging informatics: a review of the literature. J Biomed Inform 2001; 34:129-141. [7] Tang X, Ning R, Yu R, Conover D. Cone beam volume CT image artifacts caused by defective cells in x-ray flat panel imagers and the artifact removal using a wavelet-analysisbased algorithm. Med Phys 2001;28:812-825. [8] Quian Quiroga R, Sakowitz OW, Basar E, Schurmann M. Wavelet Transform in the analysis of the frequency composition of evoked potentials. Brain Res Brain Res Protoc 2001; 8:16-24. [9] Turkheimer FE, Banati RB, Visvikis D, Aston JA, Gunn RN, Cunningham VJ. Modeling dynamic PET-SPECT studies in the wavelet domain. J Cereb Blood Flow Metab 2000; 20:879-893. [10] Lin JW, Laine AF, Akinboboye O, Bergmann SR. Use of wavelet transforms in analysis of time-activity data from cardiac PET. J Nucl Med 2001;42:194-200. [11] Angelini ED, Laine AF, Takuma S., Holmes JW, Homma S. LV volume quantification via spatiotemporal analysis of real-time 3-D echocardiography. IEEE Trans Med Imaging 2001;20:457-469. Address for correspondence. Dr. Oleg Blagosklonov Service de Biophysique, Faculté de Médecine. Pl. Saint-Jacques 25030 Besançon - FRANCE E-mail:
[email protected]
192