exhibiting decreasing risk aversion: the degree of risk aversion can be limited to a plausible range: the form ... available quadratic programming computer codes.
Australian Journal ofAgriculruml Economics. Vol. 32. Nos 2 and 3 (AuglDec 1988). PP. 88-97
UTILITY-EFFICIENT PROGRAMMING FOR WHOLE-FARM PLANNING* LOUISE H. PATTEN, J. BRIAN HARDAKER University of New England, Armidale, NS U’235 1 and DAVID J. PANNELL University of Western Australia, Nedlands, WA 6009 A programming technique, ulilitv-efficient programming, i s developed for farm planning under risk. The objective function is the parametric sum of two parts of the utility function in which the degree of risk aversion varies sysiematically with ?heparameter. This technique has several advantages over those previously available: a number of types of utility functions are applicable including ones exhibiting decreasing risk aversion: the degree of risk aversion can be limited to a plausible range: the form of the distribution for activity net revenues is flexible: and the technique can be used with available algorithms. The method i s illustrated using a parametric linear programming algorithm.
To date, there has been no completely satisfactory method of finding the utility-maximising farm plan from among the set of possible risky plans. The reason is that, in order to determine the optimal farm plan for a given farmer, his or her utility function must be known. Utility elicitation from farmers is difficult and the difficulties are compounded when general recommendations are being formulated for many farmers. One approach used has been to identify a set of efficient plans from which the individual farmer can choose. The efficient set should contain all farm plans that farmers could prefer if they have utility functions belonging to some specified class and there shouid be no farm plan outside the identified set that would give such a farmer a higher expected utility. Methods of deriving such a set are known as stochastic efficiency analysis. While methods of stochastic efficiency analysis have been developed, to date, their effective use in whole-farm planning has been limited. Although mathematical programming techniques have been widely used for farm planning because such models allow good representation of the production constraints and inter-activity relationships commonly encountered on farms, combining mathematical programming with stochastic efficiency analysis for farm planning has been less successful. Of the techniques available for representing risk attitudes in mathematical programming models, most are either inconsistent with expected utility maximisation or only generate stochastically efficient plans under certain limited and unsatisfactory conditions, as noted below. In this paper, a programming model is presented that generates efficient sets of plans for defined classes of utility functions without some of the deficiencies of existing methods. Hadar and Russell (1 969) introduced second-degree stochastic dominance (SSD) analysis, enabling preference ordering of uncertain prospects under the relatively undemanding assumption that the utility function is monotonically increasing and concave (risk-averse). Third* Thanks are due to Jock Anderson, John Dillon and Gordon MacAulay for comments on an earlier draft of this paper. David Pannell thanks Rob Fraser, Ross Kingwell and Bob Lindner for their contributions to a study which preceded this joint paper.
88 Copyright 1988 The Australian Agricultural Economics Society
1988
UTILITY-EFFICIENT PROGRAMMING FOR FARM PLANNING
89
degree stochastic dominance analysis allows further ordering of distributions under the stronger assumption of decreasing risk aversion (Whitmore 1970). Other authors have shown how the efficient set can be otherwise restricted in terms of ‘utility family-specific’ efficiency, that is, for decision makers whose utility functions have a particular algebraic form (Anderson, Dillon and Hardaker 1977, pp. 292-4). Subsequently, Meyer (1977a, b ) extended SSD analysis to dominance with respect to a function, allowing comparison of distributions given upper and lower limits on absolute risk aversion. Despite its theoretical superiority over other techniques, there are two weaknesses of stochastic dominance analysis that have limited its application in farm planning. First, the procedures are not well developed for problems involving mixtures of alternatives. Second, and related to the first point, most avaiiable procedures have only allowed determination of stochastic dominance through pairwise comparisons of alternatives. Despite the existence of computer codes (for example, Raskin and Cochran 1986), the computation becomes very costly if many alternatives are to be reviewed. Methods of integrating this analysis into mathematical programming have been limited. The best-known application of stochastic efficiency analysis for wholefarm planning is quadratic risk programming (QRP) [and its linear approximations such as MOTAD (Hazel 197111. QRP, first applied by Freund (1956), is commonly used to generate the mean-variance efficient set of plans. It has the advantage of being simple to apply using widely available quadratic programming computer codes. Unfortunately, the approach usually requires restrictive assumptions of either a quadratic utility function or normally distributed net income.’ Quadratic utility functions imply positive marginal utility only within a bounded range (Hanoch and Levy 1970) and increasing absolute risk aversion (Arrow 1965, p. 35). Both characteristics are inconsistent with the expected nature of true preferences. On the other hand, an assumption of normally distributed net income can be both unrealistic and unsatisfactory for risk-averse decision makers who are not indifferent between symmetrical and skewed distributions (Collender and Chalfant 1986). Hadar and Russell (1969) showed theoretically that a mean-variance frontier may contain distributions that can be ordered by SSD analysis while excluding distributions that would be in the SSD set. These conclusions were confirmed empirically in a stock market context by Porter and Gaumnitz (1972) (who nevertheless concluded that the differences between the two efficient sets were not very great). Another method of applying stochastic dominance analysis in a wholefarm planning framework is risk-efficient Monte Carlo programming (REMP),as developed by Anderson (1975). In REMP, many farm plans are selected partly at random and then reduced by pairwise comparisons to the stochastically efficient set. However, REMP does not allow the whole set of efficient plans to be identified and, in fact, those identified may not be truly efficient. A third approach. mean-Gini programming, has been advanced as cornbining the advantages of SSD analysis and mean-variance analysis while avoiding the limitations of each. However, despite some theoretical advanI While normality and/or a quadratic utility function are sufficient conditions for the conditions (Meyer 1987). appropriateness of the mean-variance, they are not always WKS~UY
90
AUSTRALIAN JOURNAL. OF AGRICULTURAL ECONOMICS
AUG/DEC
tages (Yitzhaki 1982), it is computationally very inefficient and therefore impracticable. Other mathematical programming models accounting for risk, such as game theory (for example, Hazel1 1970) or maximum admissible loss models (Boussard 1970), can be criticised as being inconsistent with expected utility maximisation, the predominant economic paradigm for risk analysis. The application of stochastic dominance criteria could be greatly enhanced by their inclusion in a mathematical programming formulation in a less-restrictive manner than present options provide. Such an approach is presented below. This procedure allows the identification of all farm plans that are efficient for a set of decision makers whose risk attitudes can be represented by a particular class of utility functions, defined over an interval of degrees of risk aversion. The farm plans so identified will be first, second, third and n-th degree stochastically efficient for those particular decision makers.
Utility-Efficient Programming Lambert and McCarl (1985) present a mathematical programming formulation that allows identification of the expected utility maximising solution for any specific concave utility function, and does not require an assumption of normally distributed net income. Utility-efficient programming is a reformulation of this approach using parametric objective programming. Consider the class of separable utility functions of the form
where z is net income and for which the degree of risk aversion varies with A, and G and H are appropriately selected functions of z . Lin and Chang (1978) have reviewed several alternative utility functions and have listed their properties, specifically, implied restrictions on parameters, coefficients of risk aversion and risk aversion ranges. A number of these functions have the required property of separability (see Appendix). Of particular interest, however, is the so-called 'sumex' function (Schiaifer 1971, p. 9.4): (2)
I/ = -exp(-az)
-
Xexp(-bz)
a, 6 , X > 0
The sumex function has the desirable property that
(3) r.
=
[a2exp(- az)
+
Xbzexp(- bz)]/[aexp( - az)
+
Xbexp( - bz)]
where r. is the coefficient of absolute risk aversion, defined as - v'/V (Arrow 1965, p. 33). Therefore, the function exhibits decreasing absolute risk aversion with increases in income (z). Moreover, as the parameter is varied, the coefficient of absolute risk aversion varies between a and b. This property is useful in that a and b can be set at the upper and lower limits of the range of risk aversion of interest for a particular analysis. While any suitable separable utility function could be used in the programFor example, Okunev (1986) found that, while his example could be run with 1 min of CPU time using mean-variance analysis. it took 78 h of CPU time using the mean-Gini model!
1988
UTILITY-EFFICIENT PROGRAMMING FOR FARM PLANNING
91
ming formulation below, the application will be based on the sumex function. Define the following mathematical programming problem: (4)
max E [ q =
C k p k [ G ( z k )
+
w ( t k ) ]
.c
subject to tk =
and
Ci'X
for k = 1,
. . . ,K
Ax Id x 1 0
where X is a non-negative parameter, pk is the probability of state k, G and H are two parts of the utility function U, z k is the total net revenue for state k , ck is the activity net revenue vector for state k,x is the vector of activity levels, A is the matrix of input output coefficients, and d is the vector of right-hand side coefficients. The above formulation can be regarded as a special case of discrete stochastic programming (Cocks 1968; Rae 1971~1,b) and it is trivial to extend what follows to the general discrete stochastic case. The parameter h is varied using a parametric objective programminz algorithm. At each change of basis, corresponding to a particular level of risk aversion, the expected utility maximising solution is identified. When X = 0, r, = a, whereas when h OD, r. b. Thus, the complete utility-efficient solution set for the utility functional form used can be identified. The solution meets the aim outlined in the introduction and that is that no plan outside the identified set would be preferred by any member of the target group of decision makers, and none in the set would not potentially be preferred by some decision maker. The efficient set is, however, utifity-family specific. The activity net revenue vectors for all States, Ck, represent the uncertainty in activity returns. Therefore, there is no need to assume any standard form of distribution. Suitable values may be actual (or detrended) observations from recent years, which can be treated as a sampie of equally likely outcomes or as states with subjectively assessed probabilities. Solution of the utility-efficient programming problem requires access to an algorithm able to solve mathematical programming formuiations with a parametric linear combination of two non-linear objective rows. To our knowledge, no such algorithm has yet been coded for computer application. Three possible approaches were therefore considered: (a) solution using a non-parametric, non-linear code such as MINOS (Murtagh and Saunders 1977) with stepwise variation in X: (b) solution using a parametric quadratic programming routine with quadratic approximation of G and H, (c) solution using a parametric linear programming routine with linear approximation of G and H. While option (a) should present no major difficulties, the problem would need to be solved many times to span adequately the range of X of interest. This could prove expensive in computer and analyst's time. Options (b) and (c) both involve approximations of G and H and the latter was preferred on grounds of simplicity.
-
-
92
AUSTRALIAN JOURNAL OF AGRICULTURAL ECONOMICS
AUC/DEC
Utility-Efficient Programming Using Linear Approximation Since the functions G and H for the sumex are concave, the Duloy and Norton (1975) procedure was used for the linear approximation. Thus, the linear programming formuiation of the model ,is as follows:
and where wk is a 4 by 1 vector of weights representing each of the 4 segments of G and H for each state k , v k is a q by 1 vector of values of zk for state k chosen as corner values for the linear segmentation of C and H , g , and hi are 4 by 1 vectors of calculated values of G and ff, respectively. corresponding t o the values of zk (total net revenue) in v k , ail for state k , and t is a q by 1 vector of ones. The linear segments, represented in vk, d o not have to be the same for each state. Since the smaller the linear segments the cIoser the approximation t o the original function. some effort needs to be spent on determining the size and number of segments to use. The approach followed here is first t o solve the problem to maximise expected profit, and then to set corner values close together in the region of the income values for each state given in this solution. Once the initial solutions are obtained, the length of segments may be further refined to improve the approximation. Application of Utility-Efficient Programming To illustrate the technique a farm planning example was taken from Hardaker (1979, ch. 10) where it was used to demonstrate MOTAD programming. The problem involves choice among five activities (wheat, barley, grass seed, potatoes and pigs), subject to eight constraints (land
TABLE I Technical Constraints for the Example Problem Constraint Land
Max. cereals Max. wheat Max. potatoes Max. pigs Labour 1 Labour 11 Labour 111
Units ha ha ha ha
Wheat Barley 1 1 I
-
no.
-
h
3 3
h
I
Grass seed 1
-2 -1 -
-
1 4
-
Pota-
d
toes
Pigs
Sign
vector
1 -4
-
5
C C
I50 0 0 20
-2 1 10 -
25
1
2 2 2
I
I I
I I
50 500 550 450
1988
93
UTILITY-EFFICIENT PROGRAMMING FOR FARM PLANNING
TABLE 2 Veciors of Net Revenues per ifnip State
Wheat
Barley
Grass seed
Potatoes
Pigs
1
200
300 500
I20
250 270 300
170 230 200 260
600
2 3
350 I050 800
190 140 160
4
100
250
All values are expressed in Wha.
TABLE 3 Final vk Vectors: Corner Values of Wealtha
1 7 1
3 4
44 5 0 0
42 OOO 57 OOO
61 500
32 OOO 48 OOO
34 500 49 OOO
47 OOO 66 OOO 37 OOO
50 OOO
49 5 0 0 70 500
39 5 0 0 51 OOO
52 OOO 75 OOO 42 OOO 52 OOO
' '411 values are expressed in 5 . area, maximum cereal, wheat and potato areas, maximum number of pigs, and three labour usage constraints) (see Table 1). The activity net revenues for four previous years are given in Table 2 and are treated as four equally likely states of nature in the example formulation. The corner income values for the linear approximation of utility (that is, the vk vectors) for each state are shown in Table 3. The relevant absolute risk aversion range for the model was derived from the plausible range of relative risk aversion, r,, defined as the elasticity of the marginal utility of wealth. Arrow (1965, p. 33) has shown that r. = r J w where w is wealth. Little and Mirriees (1974, p. 330) suggest that r. will be a number close to 2; therefore, a range of 1 to 3 was used. The approximate wealth of the example farmer was assessed by capitalising the estimated average annual net income of the farm. This process gave a range of r. of 6 x to 2 x loe6. This range gave the result of only one optimal farm plan, indicating the discriminating power of risk programming when risk aversion is limited to a plausible range. However, for the purposes of illustration, the range was enlarged to 1 x to 1 x lo+. Thus, the G and H functions used were: (6)
G = -exp( -0.0001~)
(7)
H = - exp( - 0.000001i)
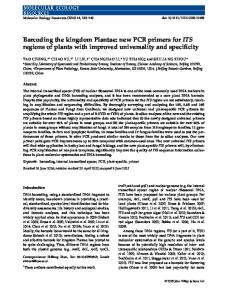
Results The results obtained are illustrated by the solid lines in Figure 1. For purposes of comparison, the QRP results for the same levels of risk aversion are shown as broken lines in the same figure.
94
AUSTRALIAN JOURNAL OF AGRICULTURAL ECONOMICS
-
AUG/DEC
Pigs
01 150
I
Grass 100
90 80
70
-
60
-
50
-
40
30
I-----------I
0
0
0 0
~
0
-
20
-
10
-
OJ
0
/ 0
/
0 0 0 0 0 0
0 0 1
1
)
!
I
1
I
I
I
I
Risk aversion (* 10')
---FIGURE 1 - Utility-Efficient (-1
and Quadratic Risk Programming
(---)
UE QRP Solutions.
The two sets of solutions are substantially differenr, reflecting the different objective functions. The utility-efficient solutions include less barley, fewer pigs and more grass seed over most of the range of risk aversion levels investigated. Therefore, insofar as the assumptions underlying the model are less restrictive than those of the QRP model, and more closely reflect farmers' actual circumstances, the utility-efficient set of plans is clearly superior as a basis for choice of a plan by an individual farmer. This superiority will be greater the more actual risk attitudes differ from those implied by quadratic utility and are better reflected in the function used for utility-efficient programming, and/or the more the distributions of farm incomes depart from the normal.
I988
UTILITY-EFFICIENT PROGRAMMING FOR FARM PLANNING
95
Conclusions The objective of any programming approach to farm planning which takes risk into account is to provide decision makers with the smallest set of farm plans which includes the plan that maximises the individual’s utiiity. To obtain this set, the utility function used or impiied in the approach must be consistent with the subject’s actual preferences and any additional constraints used to reduce the number of possible soIutions must also be in accord with those actual preferences. In addition, the technique used must be practical. That is, data required should be obtainable with reasonable ease and the computational task should not be excessive. The utility-efficient programming approach outlined in this paper appears to satisfy the above criteria reasonably well. The technique is applicable to a number of types of utility function. Therefore, if certain characteristics of the preferences of the target decision makers are known or can be inferred (for example, that they exhibit decreasing risk aversion), a function that implies these characteristics may be available, A second advantage of this technique is that all knowledge about the range of risk aversion relevant to a particular group of decision makers can easily be incorporated into the model.’ Thereby, solutions that would be of no interest to the decision makers are avoided. The third advantage of this approach is that, unlike QRP, no assumptions concerning the nature of the distribution of activity net revenues need to be made. it shares the advantage with MOTAD programming of allowing the available data to indicate the narure of the multivariate distribution, while also allowing for a degree of subjectivity if appropriate, for example by assigning subjective probabilities to states. Finally, as shown in the example, utilitvefficient programming can be effectively approximated using paramerric linear programming, for which there are widely available and efficient cornputer packages.
APPENDIX Suitable Utilit-v Functions f o r Utility-Efficient Programming Table A1 shows how four types of utility function can be partitioned into separate functions G and H for use in utility-efficient programming. Restrictions on the parameters, coefficients of absolute risk aversion and the ranges of risk aversion are also shown. References Anderson, J . R. (19751, ‘Programming for efficient planning against non-normal risk’. Australian Journal o j A ericulrural Economics 19(2), 94-1 07. , Dillon. J. L. and Hardaker. J . B. (1977). Agriculrurai Decision Anal.vsis, Iowa State University Press, Ames. Arrow. K . J. (1965).rlspecrs of‘rhe Theur,vof Risk-Bearing. Yrjo Johnsson Saatio. Helsinki. Boussard. J-M. (1970). ‘A model of the behaviour of farmers and its application to agriculturai policies’. European Economic Review 2(4), 436-61. Cocks. K. D. ( 1968). ‘Discrete stochastic programming‘. .tlanaqemenr Science IS(1). 72-9. Collender, R. N. and Chalfant. J . A. (1986). ‘An alternative approach to decisions under uncertaintv using the empirical moment-generating function’. American Journai 01’ Agriculiural Economics 68(3). 727-3 I . Dulov, J. H . and Norton. R. D. (19751. ‘Prices and incomes in linear programming models‘. American Journal of ARricultural Economics j7(4), 39 1-600.
-
’ Of course. such a restriction can also be used in other types of risk programming, such as QRP.
G
I!
Restriction
Coefficient of risk aversion
Range of risk aversion
(a) I n addition, i t is possiblc t o use any function o f the general form U ( z )= G + X H where G and / f are polynomials with ff of second order or higher. (h) A l l fuactions except the polynomials exhibit decreasing absolute risk aversion over the specified ranges. (c) Tlie riinge o f A ol‘ iiitcrcst for ritility-efficient programniing can be determined b y setting appropriate upper and lower values for the coefficient of risk aversioii and solving for X (for n relevant value of 2). The case o f the suinex i s different, as illustrated in the main text. Sourw: Derived f r o m Lin and Chaiig (1978).
Notes:
Functional f o r m
Features of Suitable Utility Functions
TABLE A1
1988
UTILITY-EFFICIENT PROGRAMMING FOR FARM PLANNING
97
Freund, R. J. (1956). ‘The introduction of risk into a programming model’, Econometricu 24(2), 253-63. Hadar. J. and Russell. W. R. (1969), ‘Rules for ordering uncertain prospects’, American Economic Review 59(l), 25-34. Hanoch, G. and Levy, H. (1970), ‘Efficient portfolio selection with quadratic and cubic utility’, Journal of Business 4 3 2 ) . 181-90. Hardaker. J. B. 11979). Farm Pkanninq 6 y Computer. Ministry of Agriculture, Fisheries and Food, GFM2, HMSO, London. Hatell. P. B. R. (1970), ‘Game theory an extension of its application to farm planning under uncertainty’, Journal of AgriculturaI Economics 21(2), 239-52. (1971). ‘A linear alternative to quadratic and semivariance programming for farm planning under uncertainty’, American Journal of Agriculrural Economics 5 3 ( I). 53-62. Lambert. D, K . and McCarl, B. A. (19851, ‘Risk modeling using direct solution of nonlinear approximations of the utility function’, American Journal of Agricultural Economics 67(4), 86-52. Lin. W. W. and Chang, H. S. (1978). ‘Specification of Bernoullian utility function in decision analysis’, Agricultural Economics Research 30( 1), 30-6. Little, 1. M. D. and Mirrlets, J. A. (1974), Project Appraisalond Planning for Developing Countries, Heinemann, London. Meyer. J. (1977a), ‘Choice among distributions’. Journal of Economic Theory 14(2), 326-36. -(1977b). ‘Second degree stochastic dominance with respect to a function’, Internafional Economic Review 1 8(2). 477-87. ( 1987). ‘Two-moment decision models and expected utility maximisation’. American Economic Review 77(3), 421-9. Murtagh. B. A. and Saunders. M. A. (1977). MINOS: A Large-Scale Nonlinear Programming System: User’s Guide. Department of Operations Research, Stanford University. Stanford. Okunev, J. (19861, A comparative studv of Gini’s mean difference and mean variance in portfolio analysis, unpublished M.Ec. dissertation. University of New England. Armidale. Porter, R. 8. and Gaumnitz, J . E. (1972). ‘Stochastic dominance vs. mean-variance portfolio analysis: a n empirical evaluation’, American Economic Review 62(3), 438-46. Rae, A. N. (1971a). ‘An empirical application and evaluation of discrete stochastic programming in farm management’, American JournaI oJAgricultura1Economics 53(4), 625-38. -(1971b). ‘Stochastic programming, utility, and sequential decision problems in farm management’. American Journal of Agricultural Economics. 53(3). 448-60. Raskin. R. and Cochran. M. J. (1986), A user’s guide to the generalised stochastic dominance program for the IBM PC. Department of Agricultural Economics and Rural Sociology, University of Arkansas. Fayetteville. Schlaifer. R. ( 1971). Compurer Programs/or Elemenrary Decision Analysis. Harvard University, Boston. Whitmore, G. A. (1970). ‘Third-degree stochastic dominance’, American Economic Review 60(3), 451-9. Yitzhaki. S. (1982). ‘Stochastic dominance. mean variance, and Gini’s mean difference’. American Economic Review 72(1), 178-85.
-
-
-