Turkish Journal of Agriculture and Forestry
Turk J Agric For (2013) 37: 604-612 © TÜBİTAK doi:10.3906/tar-1210-90
http://journals.tubitak.gov.tr/agriculture/
Research Article
Utilization of color parameters to estimate moisture content and nutrient levels of peanut leaves 1
2
1,
1
Muharrem KESKİN , Sema KARANLIK , Serap GÖRÜCÜ KESKİN *, Yurtsever SOYSAL Department of Biosystems Engineering, Faculty of Agriculture, Mustafa Kemal University, Antakya, Hatay, Turkey 2 Department of Soil Science and Plant Nutrition, Faculty of Agriculture, Mustafa Kemal University, Antakya, Hatay, Turkey 1
Received: 31.10.2012
Accepted: 18.01.2013
Published Online: 28.08.2013
Printed: 25.09.2013
Abstract: Leaf nutrient levels are traditionally quantified by laboratory chemical analysis, which is time-consuming and requires intensive labor and investment. The objective of this study was to predict the moisture content (MC) and nutrient content of peanut leaves from color parameters (CIE Lab) using a chromameter. This method is faster and requires less labor and investment compared to laboratory chemical analysis. Fifty peanut leaf samples were collected from a commercial peanut field. The samples were analyzed for MC, N, P, K, Ca, Mg, Fe, Mn, Zn, and Cu concentrations after color parameters were acquired by chromameter. A positive and high correlation was found between MC and brightness (L*; r = 0.91) and MC and yellowness (b*; r = 0.95). The results show the possibility of predicting the MC of peanut leaves from color data (R2 = 0.88). A strong relationship was also observed between the measured and predicted levels of P and K based on the PLS2 regression model (R2 = 0.88 and R2 = 0.90, respectively). P and K concentrations of peanut leaves can be predicted from the color parameters to within approximately ±0.03% and ±0.15%, respectively. In contrast to MC, P, and K, concentrations of N, Mg, Mn, Zn, and Cu had only moderate correlation, and Fe concentration had the lowest correlation with color parameters (|r| ≤ 0.27). Key words: Chromameter, color, deficiency, leaf, nutrient, peanut, stress
1. Introduction Peanut (Arachis hypogaea L.) is one of the crucial oilseed crops. Its seeds contain high amounts of edible oil (43%–55%) and protein (25%–28%) (Reddy et al. 2003). In 2009 peanuts were grown on about 23.5 × 10⁶ ha for a total production of about 35.5 × 10⁶ t (with shell) and an average yield of about 1510 kg ha–1 worldwide (http:// faostat.fao.org). China, India, Nigeria, the United States, and Myanmar were the top 5 peanut producing countries in 2009 (http://faostat.fao.org). In Turkey, peanut is one of the major oilseed crops and is grown on about 25,330 ha for a total production of about 90,000 t and an average yield of 3550 kg ha–1 in 2009 (www.tuik.gov.tr). It is grown primarily in the Çukurova region of Turkey, which includes Adana, Osmaniye, and Mersin provinces. Crops are subjected to various biotic and abiotic stresses including nutrient deficiency, drought, salinity, extreme temperatures, plant diseases, weeds, and pests (Fujita 2006). Sufficient soil nutrient levels are essential for good growth and high yield. Over-fertilization may cause excessive nutrient levels in the soil, leading to toxicity in plants. As a result of intense chemical application, surface * Correspondence:
[email protected]
604
and groundwater pollution has become an important issue in the last 2 decades (Ongley 1996; Harrison 1998; Ray 2003; Keskin 2004). The fertilizer application rate is usually determined by either soil or plant tissue analysis. However, these techniques require many samples, leading to excessive labor, time, and cost. Another disadvantage of current sampling methods is that it takes several days to obtain the laboratory results. In addition, these methods require professional laboratories. Therefore, there is a need for a method that can be used even by farmers to determine the nutrient content of a sample quickly, easily, and inexpensively (Rodriguez and Miller 2000; Keskin 2004; Vellidis and Lowrance 2004). Spectroradiometry and nearinfrared (NIR) spectroscopy have been used to determine the levels of some nutrients in samples; however, the high cost and complexity of the equipment prevents their use in practice (Rodriguez and Miller 2000; Keskin et al. 2004). Therefore, systems with low cost and ease of operation are needed to detect nutrient deficiency. Stress results in a change in the reflectance characteristics of the plant leaves because it affects their
KESKİN et al. / Turk J Agric For
utilization of light radiation (Knipling 1970; Guyot 1990; Carter 1993; Campbell 1996). Therefore, it is possible to predict the presence and severity of stress from the reflectance response of the plant. Several studies have been carried out on this subject. Bausch and Duke (1996) found that the NIR/green reflectance ratio was a good predictor of nitrogen for corn (R2 = 0.70). Stone et al. (1996) used a sensor utilizing reflectance from red and NIR bands with good correlation for total nitrogen uptake in winter wheat (R2 = 0.81). Utilizing a reflectance sensor, Sui et al. (1998) correctly classified 91% of cotton plants as nitrogendeficient. Taylor et al. (1998) reported 60% fertilizer savings in a variable-rate nitrogen application based on readings of Bermuda grass with a reflectance-based sensor. Keskin et al. (2004) used 4 wavelength bands at 550, 680, 770, and 810 nm to predict nitrogen content of golf course turfgrass clippings (R2 > 0.82). Keskin et al. (2008) developed a portable sensor to predict the visual quality of turfgrass plots from the reflectance of red and NIR bands (R2 = 0.60). Burchia et al. (2010) treated Asiatic lily plants with K-sulfate and/or sucrose and evaluated tepal colors by portable spectrocolorimeter in CIE L*a*b* coordinates; treatment resulted in significant improvements in color quality. Ulissi et al. (2011) estimated nitrogen concentration of tomato leaves by VIS-NIR nondestructive spectroscopy with a significantly high correlation (r = 0.94). Antonucci et al. (2011) estimated the maturity status of 2 mandarin fruit cultivars using a VIS-NIR spectrophotometer (r > 0.80 for titratable acidity and total soluble solids). There are limited studies involving the use of reflectance in the assessment of stress in peanut. Nutter et al. (1990) reported that reflectance from a handheld multispectral radiometer correlated more closely with pod yield than visual disease assessments. Similarly, Nutter and Littrell (1996) suggested that reflectance from healthy peanut canopies has a better relationship with pod yield than leaf spot disease assessments. Samdur et al. (2000) reported that correlation between chlorophyll meter readings and chlorophyll content was highly significant for chlorophyll a, chlorophyll b, and total chlorophyll in groundnut (r > 0.90). Bronson et al. (2004) reported that reflectance data responded to fertilizer applications as chlorophyll meter readings were positively affected by nitrogen. Sullivan and Holbrook (2007) found significant correlation between reflectance and drought as well as yield; however, the relationship with aflatoxin contamination was less consistent. Carley et al. (2008) reported that canopy reflectance could potentially aid in predicting pod maturation. Chromameters or colorimeters are used to measure the color parameters (generally, brightness, redness, and yellowness) of samples in many different applications including paints, inks, plastics, textiles, food, plants,
beverages, pharmaceuticals, and cosmetics (Konica Minolta 2005, 2007). In addition to chlorophyll meters, radiometers, spectrophotometers, and spectroradiometers, chromameters can also be used to identify the nutrient contents of plants. However, no previous study on chromameter use to detect nutrient deficiencies in peanut leaves was found. This work is the first study to investigate the relationship between chromameter color parameters and moisture content and multiple nutrient contents of peanut leaves. The objective of this research was to study the possibility of predicting the moisture content and nutrient contents of peanut leaf samples from the color parameters as measured by a chromameter. 2. Materials and methods 2.1. Study field The leaf samples were collected from a commercial peanut field with an area of approximately 5 ha (approximately 200 m × 250 m). The field was located in an area about 20 km south of the city of Ceyhan, Adana Province, in the eastern Mediterranean region of Turkey (36.9395°N, 35.8921°E, elevation: 25 m). The soil texture of the field was clayey, and the peanut variety selected was Virginia NC-7. 2.2. Leaf samples On 12 July 2008 just before the flowering stage, 50 leaf samples were collected from the test field. In addition, 4 soil samples were collected from the field. The approximate positions of the leaf and soil sampling points are depicted in Figure 1. Each leaf sample bundle included about 100 peanut leaves. Leaf samples were stored in plastic bags and immediately transferred to a laboratory for color measurements. 2.3. Color measurements The colors of sampled leaves were quantified by chromameter (Minolta CR-400, Konica Minolta, Osaka, N +
+
+
+
+
+
+
+
+
+
+
+
+
+
+
+
+
+
+
+
+
+
+
+
+
+
+
+
+
+
+
+
+
+
+
+
+
+
+
+
+
+
+
X
X
X +
+
+
X +
+
+
+
Figure 1. Locations of sampling points for leaf (+) and soil samples (x).
605
KESKİN et al. / Turk J Agric For
Japan). Each sample included about 100 peanut leaves, and the leaves were randomly placed in groups of 5 leaves for a total of 20 leaf groups. First, 5 leaves were stacked on top of each other, and then color measurements were conducted for each leaf group. Following measurement, the mean of 20 readings was calculated as the average color data for that sample and used in data analysis. Color measurements were carried out on the same day as leaf sampling. The color meter was set to CIE Standard Illuminant C. Color parameters (L*, a*, and b* values) were measured to describe 3-dimensional color space and interpreted as follows: L*: brightness, 0% (no reflection) for black-colored objects and 100% for white-colored objects; a*: redness, with negative values for green and positive values for red; and b*: yellowness, with negative values for blue and positive values for yellow. The chromameter sends light from its light source to the specimen; the reflected light is measured using 3 photocells that determine red, green, and blue color components. The microcomputer inside the meter then calculates the color parameters and displays the values on a monitor (Konica Minolta 2005). The chromameter uses the tristimulus color-sensing method based on the 3-component theory of color vision for the human eye, which senses 3 primary colors (red, green, and blue) and perceives all colors as mixtures of these 3 primary colors (Yiming 2003). After performing the color measurements samples were sent to a laboratory for chemical analysis. Pictures of the samples were taken before color measurement using a 2 MP digital camera. 2.4. Leaf and soil analysis After color measurement, the fresh leaf samples were weighed and then dried at 70 °C for 48 h. After measuring the dry weight of the samples the wet-based moisture content was calculated for each of the 50 samples using the following equation: MC = [(Mw – Md) / Mw] × 100, where MC = moisture content (%); Mw = wet mass, or mass of the sample before drying (g); and Md = dry mass,
or mass of the sample after drying (g). Soil and plant tissue analyses were carried out at the Plant Nutrition Laboratory of the Department of Soil Science and Plant Nutrition of the Faculty of Agriculture of Mustafa Kemal University. After washing with 1/2000 HCl solution and rinsing with distilled water, the leaf samples were dried at 70 °C for 48 h. The dried samples were ground, and 0.5 g of each sample was burnt at 550 °C in a muffle furnace for 5 h. The resulting ash was extracted with 1/30 HCl and filtered. The Ca, K, P, Na, Mg, Fe, Cu, Mn, and Zn concentrations of the samples were determined by inductively coupled plasma atomic emission spectrometry (ICP-AES; Varian Liberty Series II, axially viewed). Plant N content was measured according to Bremner (1965) by the Kjeldahl method. The available P level of the soil samples, Olsen-P, was extracted with 0.5 M NaHCO3 at pH 8.5 in a 1:20 soil-to-solution ratio, and P concentration of supernatants was colorimetrically determined by ascorbic acid method at 882 nm wavelengths (Shimadzu 1240 UV/VIS Spectrometer) (Kuo 1996). Ammonium acetateextractable K, Ca, and Mg (Brown and Warncke 1988) content of the soils was determined by AAS. Available Fe, Zn, Cu, and Mn concentrations were obtained through DTPA extraction by ICP-AES (Lindsay and Norvell 1978). Total soluble salt calculated as pH from the resistance of saturation mud by conductivity meter was determined by pH meter in saturation mud. Soil analysis results from the 4 samples are presented in Table 1. The soil texture was clayey. 2.5. Data analysis Correlation coefficients were calculated among color parameters, moisture content, and nutrient levels of the leaf samples in MS Excel (Microsoft Corporation, Redmond, WA, USA). For spectroscopic multivariate reflectance data in which the reflectance variables are not orthogonal, principal component regression (PCR) or partial least squares (PLS) regression are the appropriate modeling methods as opposed to multiple linear regression (Esbensen 2009). PLS regression offers better performance than PCR in most practical applications and is a powerful alternative to PCR (Esbensen 2009). PLS regression has 2
Table 1. Analysis results of the 4 soil samples. Sample
P (%)
K (%)
Ca (%)
Mg (%)
Cu (ppm)
Fe (ppm)
Mn (ppm)
Zn (ppm)
pH
Lime (%)
1
0.0008
0.039
0.97
0.22
2.8
4.5
18.6
0.20
7.68
10.3
2
0.0006
0.049
1.09
0.23
2.4
4.0
14.2
0.25
7.73
12.8
3
0.0009
0.055
0.91
0.28
2.6
3.5
16.2
0.25
7.97
17.5
4
0.0005
0.042
0.97
0.26
2.6
3.8
13.0
0.25
7.69
16.9
Mean
0.0007
0.046
0.98
0.24
2.60
3.94
15.48
0.24
7.77
14.38
606
KESKİN et al. / Turk J Agric For
different versions, PLS1 and PLS2 (Esbensen 2009). PLS1 is appropriate if there is only 1 Y variable (leaf MC and nutrient contents), while PLS2 should be used when the number of Y variables is greater than 1 (Martens and Martens 2001; Esbensen 2009). PLS2 was used for the development and validation of the models as the data had more than 1 Y variable, MC and 9 leaf nutrients (N, P, K, Ca, Mg, Fe, Mn, Zn, and Cu). Unscrambler multivariate statistics software (Version 10.1, Camo, Oslo, Norway) was used in the analysis. The color parameters L*, a*, and b* were treated as X variables while the MC, N, P, K, Ca, Mg, Fe, Mn, Zn, and Cu contents were treated as Y variables in the model development. Data were weighted by using the factor 1/StdDev; the division of each Y variable by its standard deviation so that each variable has the same chance to influence the predictive models regardless of units (percent, ppm) (Esbensen 2009). Full cross-validation was used for model validation. The root mean square error of calibration (RMSEC), root mean square error of prediction (RMSEP), R2, and beta coefficients of the models were calculated in the data analysis (Esbensen 2009).
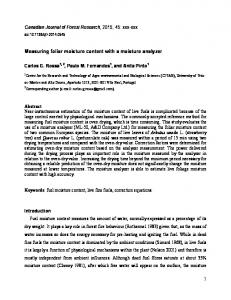
The pictures of 3 different samples are shown in Figure 2. The sample on the left (Sample #01) appears dark green while the one in the middle (Sample #19) has light green leaves, and the one on the right (Sample #13) has chlorotic yellow leaves. The sample on the left appears healthy; the samples in the middle and on the right appear unhealthy. In particular, the sample on the right appears to have a very severe problem. The leaves have light yellow color and the leaf veins remain green, which represents a Fe deficiency generally seen in soils with high pH values (FFTC 2011). The Fe concentration of this sample (Sample #13) was 36.2 ppm, which is low compared to the sufficiency level of 50–250 ppm, based on the findings of Chapin (2011). Soil test results revealed that the soil in the study area had an average pH of 7.77 (Table 1), which is much higher than the recommended pH value for peanut (5.8–6.5) (Chapin 2011). Correlation coefficients among color parameters, MC, and nutrient levels of the leaf samples were also studied (Figures 3 and 4). The highest correlation coefficients were
3. Results The minimum, maximum, mean, and standard deviation values for MC and nutrient concentrations of the leaf samples were studied and compared with the sufficiency levels obtained by Chapin (2011) (Table 2). It was observed that N, Ca, Mg, and Mn concentrations were within normal ranges, while the concentrations of P and Cu were low and K, Fe, and Zn were very low compared to sufficiency levels.
Figure 2. Examples of 3 different samples (left: Sample #01, healthy looking dark green leaves; middle: Sample #19, light green leaves; right: Sample #13, unhealthy yellow leaves).
Table 2. Minimum, maximum, mean, and standard deviation values and sufficiency levels for the moisture content and nutrient levels of leaf samples. Nutrient
Minimum
Maximum
Mean
Std. dev.
Sufficiency levels*
Comment
MC (%)
70.73
82.66
76.32
3.31
-
-
N (%)
2.74
4.72
3.70
0.38
3.50–4.50
Normal
P (%)
0.09
0.24
0.12
0.03
0.20–0.50
Low
K (%)
0.31
1.16
0.55
0.22
1.70–3.00
Very low
Ca (%)
0.65
1.22
0.85
0.12
0.50–2.00
Normal
Mg (%)
0.50
0.82
0.66
0.08
0.30–0.80
Normal
Fe (ppm)
20.28
70.53
37.03
8.97
50–250
Very low
Mn (ppm)
22.08
49.22
33.97
5.28
20–350
Normal
Zn (ppm)
7.75
15.30
10.13
1.57
20–60
Very low
Cu (ppm)
2.85
6.98
3.98
0.76
5–20
Low
*From Chapin (2011).
607
KESKİN et al. / Turk J Agric For
Correlation plots for color parameters L*a*b* versus MC (%) and P (%) and K (%) levels are presented in Figure 4. K concentration had a high and positive correlation with brightness (L*; r = 0.94) and yellowness (b*; r = 0.86), while it had a relatively lower correlation with redness (a*; r = 0.53) (Figures 3 and 4). The correlation coefficient for P concentration had high and positive values for all 3 color parameters, brightness (L*; r = 0.87), yellowness (b*; r = 0.73), and redness (a*; r = 0.71). The results showed a high correlation between color parameters and the K and P concentrations of peanut leaves, pointing to the possibility of predicting the levels of these nutrients from color data (r > 0.53 and r > 0.71, respectively). The 3 color parameters (L*, a*, and b*) were then used to develop models to predict the MC and 9 nutrient content variables using the PLS2 regression method simultaneously. It was observed that L* and b* values were strongly and positively correlated with P, K, and MC values, while they had negative and lower correlations with Fe and Mn (Figure 5). In the first factor of the PLS2 model, 70% of the variation in color data was able to predict 46% of the Y variation. With the first 2 factors of PLS2, it was possible to predict 55% (45% + 9%) of the Y variation by all 3 color measurements (Figure 5).
1.0 Correlation Coefficient
0.8 0.6 0.4 0.2 0.0
MC
–0.2 –0.4
N
P
K
Ca
Mg Fe
Mn Zn
Cu
L* a*(g/r) b*(b/y)
–0.6 –0.8 –1.0
Figure 3. Correlation coefficients among color parameters, moisture content, and nutrient levels of leaf samples.
found between MC and the color parameters L* and b*. A positive and high correlation was found between MC and brightness (L*; r = 0.91) and MC and yellowness (b*; r = 0.95). The correlation was low between MC and redness (a*; r = 0.21). In general, the correlation coefficient values were lower for redness (a*) compared to the other 2 color parameters of brightness (L*) and yellowness (b*) for MC and most of the leaf nutrient contents (Figures 3 and 4). 80 60
80 L*
a*
b*
L* a* b*
L* a* b*
a*
b*
40
40 20
20
0
0
–20
–20
–40 70
L*
60
72
74
76
78
80
–40 0.08
82
0.11
0.14
MC (%) 80
L*
a*
b*
40 L* a* b*
0.20
Correlation Coefficients (r)
60
20 0
– 20 – 40 0.3
0.17 P (%)
0.5
0.7 K (%)
0.9
MC vs L* MC vs a* MC vs b*
0.91 0.21 0.95
P vs L* P vs a* P vs b*
0.87 0.71 0.73
K vs L* K vs a* K vs b*
0.94 0.53 0.86
1.1
Figure 4. Correlation plots of color parameters L*a*b* versus MC (%) and P (%) and K levels (%).
608
0.23
KESKİN et al. / Turk J Agric For
The correlation between leaf MC and leaf nutrient contents was also studied. A positive and relatively high correlation was found between leaf MC and leaf N (r = 0.68), P (r = 0.76), K (r = 0.88), and Mg (r = 0.73) contents. This means that when MC is high, the concentrations of these minerals are also high in the leaves. The correlation was positive and relatively lower for Ca (r = 0.61), Cu (r = 0.55), and Zn (r = 0.41). In addition, a negative correlation was found between leaf MC and leaf Fe (r = –0.20) and Mn (r = –0.62) contents; when MC is low, the concentrations of these minerals in the leaves are high.
1 0.8 Factor-2 (30%, 9%)
0.6 0.4 0.2 0
–0.2 –0.4 –0.6 –0.8 -1 -1
0.2 0.4 –0.8 –0.6 –0.4 –0.2 0 Factor-1 (70%, 46%)
0.6
0.8
1
4. Discussion Samdur et al. (2000) reported that Fe-deficiency chlorosis is an important problem in peanut farming, and sometimes it is so severe that the entire plant becomes yellow or paperywhite and may even die, resulting in high yield losses. Vara Prasad et al. (2000) reported that iron chlorosis was one of the major nutritional disorders in the calcareous and sandy soils of arid and semiarid regions, noting that calcareous soils had high potential for Fe chlorosis and that peanut is susceptible to Fe deficiency in these regions. Singh et al. (1995) reported that excess irrigation increased chlorosis, causing reductions in nutrient uptake in peanut and leading to a pod yield reduction of 15.9%– 32.3%. The study also found that application of iron and sulfur fertilizers caused regreening of chlorotic leaves. We found in our study that Fe concentration and K and Zn concentrations were very low compared to sufficiency levels (Table 2). The soil in the study area had an average pH of 7.8, which is much higher than the recommended pH value of 5.8–6.5 for peanut (Chapin 2011).
Figure 5. Factor 1 versus factor 2 plot of the PLS2 regression of color parameter (X) variables and leaf nutrient content (Y) variables.
The PLS2 regression model parameters including RMSEC, RMSEP, R2, and beta coefficients were also calculated (Table 3). The highest correlation was obtained for the prediction of MC, P, and K contents (R2 = 0.880, 0.881, and 0.898, respectively); the lowest correlation was for Fe content (R2 = 0.107). RMSEP values were 1.147%, 0.012%, and 0.069% for MC, P, and K contents, respectively. Predicted versus measured data plots for P and K contents from the PLS2 model are given in Figure 6. A high correlation was observed between the measured and predicted levels of P and K (R2 = 0.881 and R2 = 0.898, respectively). Leaf P content can be predicted from the 3 color parameters to within approximately ±0.03% (Figure 6). Similarly, leaf K content can be predicted from the 3 color parameters to within ±0.15% (Figure 6).
Table 3. PLS2 regression results for prediction of leaf MC and nutrient contents from leaf color data. Calibration
Prediction
Beta coefficients
RMSEC
R
RMSEP
R
B0
L*
a* (g/r)
b* (b/y)
MC
1.093
0.889
1.147
0.880
61.973
0.148
–0.071
0.199
N
0.300
0.371
0.333
0.299
3.231
0.011
0.026
0.011
P
0.011
0.899
0.012
0.881
0.123
0.001
0.006
0.001
K
0.065
0.910
0.069
0.898
0.131
0.010
0.023
0.010
Ca
0.089
0.429
0.093
0.338
0.288
0.003
–0.017
0.005
Mg
0.057
0.455
0.060
0.408
0.362
0.002
–0.005
0.004
Fe
8.179
0.153
8.578
0.107
64.392
–0.092
1.048
–0.227
Mn
4.126
0.376
4.389
0.328
51.356
–0.150
0.227
–0.218
Zn
1.202
0.400
1.289
0.387
10.663
0.039
0.218
0.029
Cu
0.486
0.579
0.532
0.556
4.382
0.023
0.130
0.016
2
2
609
0.25
1.25
0.20
1.00
Predicted K, %
Predicted P, %
KESKİN et al. / Turk J Agric For
0.15 0.10
0.50 0.25
0.05 0.00 0.00
0.75
0.05
0.10 0.15 Measured P, %
0.20
0.25
0.00 0.00
0.25
0.50 0.75 Measured K, %
1.00
1.25
Figure 6. Predicted versus measured P and K contents from PLS2 model.
The results of previous studies in different plants revealed that MC was related to the reflectance in both visible and near infrared bands (Tucker 1977; Hatchell 2009). In a study conducted by Tucker (1977), leaf water content was best estimated in the bands of 460–500 nm, 630–690 nm, and 740–800 nm regions for grass canopy. Most significant water absorption bands are located in the near infrared bands at about 740 nm, 820 nm, 950 nm, 1130 nm, 1440 nm, and 1900 nm (Hatchell 2009). However, research into the relationship between color parameters obtained by chromameter and MC of peanut leaves is limited. Penuelas and Inoue (1999) reported a high correlation between reflectance and water content of peanut and wheat; reflectance in both visible and near infrared bands increased at all wavelengths with decreasing leaf water content from a fully turgid to dry state. The results of our study showed the possibility of predicting the MC of peanut leaves from the L* and b* leaf color data based on the visible bands (r = 0.91 and r = 0.95, respectively). There are very limited studies on the prediction of nutrient contents of peanut leaves from reflectance. Our study is the first dealing with the assessment of both moisture and multiple nutrient contents from color parameters of peanut leaves using a chromameter. We found high correlation between color parameters and MC, P, and K concentrations. Previous studies investigated the use of reflectance to select drought- and aflatoxin-resistant peanut genotypes (Sullivan and Holbrook 2007), studied pod maturation (Carley et al. 2008), investigated disease and pod yield (Aquino et al. 1992), and correlated pod yield (Nutter et al. 1990). Bronson et al. (2004) reported that chlorophyll meter readings were positively affected by leaf N and P. Similarly, Samdur et al. (2000) reported that correlation between chlorophyll meter readings and chlorophyll content was highly significant for chlorophyll a, chlorophyll b, and total chlorophyll in groundnut (r >
610
0.90). Madeira et al. (2003) found high correlation (R2 ≥ 0.93) between a colorimeter measuring light reflectance at 400–700 nm and a chlorophyll meter that determines light transmittance at 650 nm and 940 nm for estimating chlorophyll content of sweet pepper leaves, reporting that both instruments may be used to estimate chlorophyll content and leaf color. Chlorophyll content is related to the amount of nutrients such as nitrogen, magnesium, sulfur, calcium, manganese, and zinc (Shaahan et al. 1999). White and Scoggins (2005) reported that hue values correlated positively with both percent shoot N (R2 = 0.348) and percent shoot P (R2 = 0.310), and chroma values correlated negatively with both percent shoot N (R2 = 0.478) and percent shoot P (R2 = 0.534) in Tradescantia. They concluded that hue cannot be used to predict the percent shoot N or P since correlation values were low. The correlation values for chroma and percent shoot N and P were slightly higher but still not significant enough for use as predictors of shoot N and P concentrations. Adams et al. (1998) reported distinct color differences as measured by chromameter, resulting from different N and S fertilizer application levels in poinsettia. Hytonen and Wall (2006) studied foliar color as an indicator of nutrient status (N, P, K, Mg, Ca, Mn, Fe, Zn, and B) of Scots pine using a chromameter. They found that the color of fresh needle tips was the best indicator of simultaneous deficiencies in P and K, while deficiencies in N and B were not successfully detected. Menesatti et al. (2010) evaluated citrus tree nutritional status of N, P, K, Ca, Mg, Fe, Zn, and Mn using a VIS-NIR spectrophotometer with PLS regression. They found the best model for single reference chemicals (r = 0.995) and tests (r = 0.991) for K. Results also showed high efficiency in the determination of N. For all chemical parameters taken together, analyzed elements yielded correlations from 0.883 for Mg to 0.481 for P. Burchia et al. (2010)
KESKİN et al. / Turk J Agric For
reported that treatment of Asiatic lily plants with K-sulfate and/or sucrose resulted in significant improvements in tepal color quality, as evaluated by spectrocolorimeter in CIE L*a*b* coordinates. Our study is the first assessing both MC and multiple nutrient contents from color parameters in peanut leaves. We found a high correlation between color parameters and MC, P, and K concentrations. On the other hand, results showed moderate correlation between N, Mg, Mn, Zn, and Cu contents and color parameters, and Fe content had the lowest correlation (|r| ≤ 0.27) (Figure 3). Fe content affects the greenness of the leaves, especially younger leaves (Keskin et al., 2004); however, the range of Fe content in the leaves was 20.28–70.53 ppm, and the optimum range is 50–250 ppm (Table 2). This could be one of the reasons for low Fe content and color parameter correlation. The study was carried out in one field. Although promising results were obtained, further studies are needed in order to validate the results or generalize to other fields and different conditions.
In conclusion, a positive and high correlation was found between MC and brightness (L*; r = 0.91) and MC and yellowness (b*; r = 0.95). The results show the possibility of predicting moisture content of peanut leaves from the color data (R2 = 0.88). A strong relationship was observed between the measured and predicted levels of P and K based on the PLS2 regression model (R2 = 0.88 and R2 = 0.90, respectively). P and K concentrations of the peanut leaves can be predicted from the 3 color parameters to within approximately ±0.03% and ±0.15%, respectively. In contrast to MC, P, and K concentrations, the concentrations of N, Mg, Mn, Zn, and Cu had moderate correlation with the color parameters, and Fe concentrations had the lowest correlation (|r| ≤ 0.27). Acknowledgments The authors would like to thank the Scientific and Technological Research Council of Turkey (TÜBİTAK) and the Faculty of Veterinary Medicine and the Central Laboratory of the Natural Science Research Center of Mustafa Kemal University for their support.
References Adams SA, Paparozzi ET, Stroup WW (1998) Determining poinsettia nitrogen and sulfur fertilizer application rates based on chromameter and sensory panel ratings. Hort Tech 8: 199–203. Antonucci F, Pallottino F, Paglia G, Palma A, D’Aquino S, Menesatti P (2011) Non-destructive estimation of mandarin maturity status through portable VIS-NIR spectrophotometer. Food Bioprocess Techn 4: 809–813. Aquino VM, Shokes FM, Berger RD, Gorbet DW, Kucharek TA (1992) Relationship among late leafspot, healthy leaf area duration, canopy reflectance, and pod yield. Phytopathology 82: 546–552. Bausch WC, Duke HR (1996) Remote sensing of plant nitrogen status in corn. Trans ASAE 39: 1869–1875. Bremner JM (1965) Inorganic forms of nitrogen. In: Methods of Soil Analysis, Part 1 (Eds. CA Black et al.). Agronomy Monograph 9, ASA, Madison, WI, USA, pp. 93–149. Bronson KF, Trostle CL, Schubert AM, Booker JD (2004) Leaf nutrients and yields of irrigated peanut in the southern high plains: influence of nitrogen, phosphorus, and zinc fertilizer. Commun Soil Sci Plant Anal 35: 1095–1110. Brown JR, Warncke D (1988) Recommended cation tests and measures of cation exchange capacity. In: Recommended Chemical Soil Test Procedures for the North Central Region (Ed. WD Dahnke). North Dakota Agric Exp Stat Bull, pp. 15–16. Burchi G, Prisa D, Ballarin A, Menesatti P (2010) Improvement of flower color by means of leaf treatments in lily. Sci Hort 125: 456–460.
Campbell JB (1996) Introduction to Remote Sensing, 2nd ed. The Guilford Press, New York, NY, USA, pp. 456–464. Carley DS, Jordan DL, Dharmasri LC, Sutton TB, Brandenburg RL, Burton MG (2008) Peanut response to planting date and potential of canopy reflectance as an indicator of pod maturation. Agron J 100: 376–380. Carter GA (1993) Responses of leaf spectral reflectance to plant stress. Am J Bot 80: 239–243. Chapin JW (2011) Peanut Money-Maker Production Guide 2011. Clemson University, Extension Circular 588, Clemson, SC, USA. Esbensen KH (2009) Multivariate Data Analysis in Practice: An Introduction to Multivariate Data Analysis and Experimental Design, 5th ed. CAMO Inc., Corvallis, OR, USA. FFTC (2011) Iron Deficiency of Crops. Food and Fertilizer Technology Center (FFTC) for the Asian and Pacific Region, Taipei, Taiwan ROC. Fujita M, Fujita Y, Noutoshi Y, Takahashi F, Narusaka Y, YamaguchiShinozaki K, Shinozaki K (2006) Crosstalk between abiotic and biotic stress responses: a current view from the points of convergence in the stress signaling networks. Curr Opin Plant Biol 9: 436–442. Guyot G (1990) Optical properties of vegetation canopies. In: Application of Remote Sensing in Agriculture (Eds. MD Steven, JA Clark). Butterworth. Kent, UK, pp. 19–43. Harrison S (1998) Management strategy helps avoid water pollution. Golf Course Manag 66: 66–68.
611
KESKİN et al. / Turk J Agric For Hatchell DC (2009) ASD Technical Guide, 4th ed. Analytical Spectral Devices, Inc. (ASD), Boulder, CO, USA. Hytonen J, Wall A (2006) Foliar colour as indicator of nutrient status of Scots pine (Pinus sylvestris L.) on peatlands. Forest Eco Manag 237: 156–163. Keskin M (2004) Developing Reflectance Based Optical Sensor Systems for the Assessment of Turfgrass Quality. PhD, Clemson University, Clemson, SC, USA. Keskin M, Dodd RB, Han YJ, Khalilian A (2004) Assessing nitrogen content of golf course turfgrass clippings using spectral reflectance. App Eng Agr 20: 851–860. Keskin M, Dodd RB, Han YJ, Khalilian A (2008) Reflectance‐based sensor to predict visual quality ratings of turfgrass plots. App Eng Agr 24: 855–860. Konica Minolta (2005) Colorimetry: How to Measure Color Differences. Konica Minolta Photo Imaging Inc., USA. Konica Minolta (2007) Chromameter CR-400/410 Instruction Manual. Konica Minolta Sensing Inc., Osaka, Japan. Knipling EB (1970) Physical and physiological basis for the reflectance of visible and near-infrared radiation from vegetation. Remote Sens Environ 1: 155–159. Kuo S (1996) Phosphorus. In: Methods of Soil Analysis, Part 3: Chemical Methods (Ed. DL Sparks). ASA and SSSA, Madison, WI, USA, pp. 869–919. Lindsay WL, Norwell WA (1978) Development of DTPA soil test for zinc, iron, manganese, and copper. SSSA Proc 42: 421–528. Madeira AC, Ferreira A, de Varennes A, Vieira MI (2003) SPAD meter versus tristimulus colorimeter to estimate chlorophyll content and leaf color in sweet pepper. Comm Soil Sci Plant Anal 34: 2461–2470. Martens H, Martens M (2001) Multivariate Analysis of Quality: An Introduction. John Wiley, New York, NY, USA. Menesatti P, Antonucci F, Pallottino F, Roccuzzo G, Allegra M, Stagno F, Intrigliolo F (2010) Estimation of plant nutritional status by Vis–NIR spectrophotometric analysis on orange leaves. Biosys Eng 105: 448–454. Nutter FW, Littrell RH (1996) Relationships between defoliation, canopy reflectance, and pod yield in the peanut-late leaf spot pathosystem. Crop Prot 15: 135–142. Nutter FW, Littrell RH, Brenneman TB (1990) Utilization of a multispectral radiometer to evaluate fungicide efficacy to control late leaf spot in peanut. Phytopathology 80: 102–108. Ongley ED (1996) Control of water pollution from agriculture: FAO irrigation and drainage paper (no. 55). Food and Agriculture Organization of the UN, Rome, Italy. Penuelas J, Inoue Y (1999) Reflectance indices indicative of changes in water and pigment contents of peanut and wheat leaves. Photosynthetica 36: 355–360. Ray C (2003) Pesticides in Domestic Wells. ASAE, St Joseph, MI, USA.
612
Reddy TY, Reddy VR, Anbumozhi V (2003) Physiological responses of groundnut to drought stress and its amelioration: a critical review. Plant Growth Reg 41: 75–88. Rodriguez IR, Miller GL (2000) Using near-infrared reflectance spectroscopy to schedule nitrogen applications on dwarf-type bermudagrasses. Agron J 92: 423–427. Samdur MY, Singh AL, Mathur RK, Manivel P, Chikani BM, Gor HK, Khan MA (2000) Field evaluation of chlorophyll meter for screening groundnut genotypes tolerant to iron-deficiency chlorosis. Cur Sci 79: 211–230. Shaahan MM, El-Sayed AA, Abou El-Nour EAA (1999) Predicting nitrogen, magnesium and iron nutritional status in some perennial crops using a portable chlorophyll meter. Sci Hort 82: 339–348. Singh AL, Chaudhari V, Koradia VG, Zala PV (1995) Effect of excess irrigation and iron and sulphur fertilizers on the chlorosis, dry matter production, yield and nutrients uptake by groundnut in calcareous soil. Agrochimica 39: 185–198. Stone ML, Solie JB, Raun WR, Whitney RW, Taylor SL, Ringer JD (1996) Use of spectral radiance for correcting in-season fertilizer nitrogen deficiencies in winter wheat. Trans ASAE 39: 1623–1631. Sui R, Wilkerson JB, Howard DE, Hart WE (1998) Integration of neural networks with a spectral reflectance sensor to detect nitrogen deficiency in cotton. ASAE Paper No. 983104, St Joseph, MI, USA. Sullivan DG, Holbrook CC (2007) Using ground-based reflectance measurements as selection criteria for drought and aflatoxinresistant peanut genotypes. Crop Science 47: 1040–1050. Taylor SL, Raun WR, Solie JB, Johnson GV, Stone ML, Whitney RW (1998) Use of spectral radiance for correcting nitrogen deficiencies and estimating soil test variability in an established bermudagrass pasture. J Plant Nutr 21: 2287–2302. Tucker CJ (1977) Spectral estimation of grass canopy variables. Rem Sens Env 6: 11–26. Ulissi V, Antonucci F, Benincasa P, Farneselli M, Tosti G, Guiducci M, Tei T, Costa C, Pallottino F, Pari L, Menesatti P (2011) Nitrogen concentration estimation in tomato leaves by VISNIR non-destructive spectroscopy. Sensors 11: 6411–6424. Vara Prasad PV, Satyanarayana V, Potdar MW, Craufurd PQ (2000) On-farm diagnosis and management of iron chlorosis in groundnut. J Plant Nutr 23: 1471–1483. Vellidis G, Lowrance R (2004) Riparian forest buffers: hype or the silver bullet for NPS pollution control? Resource 11: 7–8. White SA, Scoggins HL (2005) Fertilizer concentration affects growth response and leaf color of Tradescantia virginiana L. J Plant Nutr 28: 1767–1783. Yiming IJ (2003) Tooth color measurement using chromameter: techniques, advantages, and disadvantages. J Esthet Restor Dent 15: 33–41.