engine RPM, throttle position, and brake status with some 1999 ..... recorded
continuously on a 24 hour chart. Following ..... sloped grade into the rear of the
target vehicle which was also in .... vehicle at the left front of a 1999 Pontiac
Sunfire.
des coussins gonflable et un besoin de mesurer et de détecter la sévérité d’un impact par les manufacturiers automobiles. GM utilise un module de détection et de diagnostic « Sensing and Diagnostic Module (SDM) » pour mesurer la sévérité d’une collision depuis 1994 et enregistre des données d’avant collision tel que, vitesse du véhicule, révolution moteur, position de l’accélérateur et statu du frein sur certains modèles 1999. Cet article revise l’évolution des dispositifs d’enregistrement automatique dans le transport, en autre le « Event Data Recorder (EDR) ». L’enregistrement et l’acquisition de données dans le système GM et Vetronix sont examinés avec une attention particulière sur les données utilisable pour fin de reconstruction d’accident. Douze essais à faible vitesse ont été effectués afin d’enquêter sur le seuil et la sensibilité de l’enregistrement et cinq études examinent l’utilité et les limites des données enregistrées.
UTILIZING DATA FROM AUTOMOTIVE EVENT DATA RECORDERS Joe T. Correia Ken A. Iliadis Ed S. McCarron Mario A. Smolej Hastings, Boulding, Correia Consulting Engineers Abstract In March 2000, Vetronix Corporation unveiled a Crash Data Retrieval (CDR) system that allows users to download data from certain GM vehicles subjected to a crash event involving the deployment or near deployment of an airbag. The recording of crash event data is a by-product of the introduction of airbags and the need to measure or sense the severity of a crash by automobile manufacturers. GM has been using a Sensing and Diagnostic Module (SDM) to measure crash severity since 1994 and started recording pre-crash data, such as vehicle speed, engine RPM, throttle position, and brake status with some 1999 model year vehicles. This paper reviews the evolution of automatic recording devices in transportation, including the automotive Event Data Recorder (EDR). The recording and retrieval of data in the GM and Vetronix systems are examined with particular attention on using the data for accident reconstruction purposes. Twelve low speed tests investigate the current threshold and sensitivity for recording data, while five case studies investigate the usefulness and limitations of the recorded data.
Evolution of Data Recorders Event Data Recorders (EDRs), or automatic recording devices that can capture information regarding an event, have existed in the transportation industry for more than half a century. The devices most synonymous with EDR technology are the “black boxes” used in aviation. The first practical Flight Data Recorder (FDR) was introduced in 1953. [1] However, the earliest transportation recording device is the tachograph found on heavy trucks, invented in 1921. [2] Both of these early EDR instruments were mechanical analog devices. The first generation of FDRs used styli to generate oscillograph traces on metal foil to record a plane’s airspeed, altitude, heading and vertical accelerations with respect to time. Similarly, the tachograph records vehicle speed, engine RPM and distance travelled onto a rotating circular chart.
Résumé En mars 2000, Vetronix Corporation a dévoilé un système qui permet aux usagers de télécharger des données de certains véhicules GM assujetti à une collision avec déploiement ou quasi-déploiement de coussin gonflable. L’enregistrement des données d’une collision est un sous produit de l’introduction
Table 1 contains a condensed summary of the activity by safety boards and regulatory authorities on EDRs for the four modes of transportation involving the movement of people - aviation, marine, railway and highway.
Proceedings of the Canadian Multidisciplinary Road Safety Conference XII; June 10-13, 2001; London, Ontario Actes de la XIIe Conférence canadienne multidisciplinaire en sécurité routière; 10-13 juin 2001; London, Ontario
1
Mode
Recorder
Aviation Flight Data Recorder (FDR)
Cockpit Voice Recorder (CVR) Marine
Railway
Voyage Data Recorder (VDR)
Authority / Reference
Details / Parameters
Early 1940's
CAB Regulation [1]
Call for flight recording device, but later rescinded
July 1, 1958
[1]
CAA Regulation
Analog FDR to record 5 parameters: time, altitude, airspeed, vertical accelerations, and heading
Dec. 10, 1972 FAA Regulation 14 CFR 121.343
Digital FDR (DFDR) required on transports ($20 passengers) certified after 1969 to record minimum 17 parameters
Sep. 12, 1997 FAA Regulation 14 CFR 121.344
Transports built after Aug. 8, 2002 required to record minimum 88 parameters
Prior 1960
CAB Recommendation [1]
Recommend that flight crew conversations be recorded
Jan. 1, 1967
FAA Regulation 14 CFR 121.359
Airplanes required to carry CVR capable of recording last 30 minutes of conversations
Mar. 9, 1999
NTSB Recommendation A-99-17 to FAA
Require 2 (1 fore/1 aft) solid state CVR/DFDR with independent power supply after Jan. 1, 2003
Mar. 2, 1976
NTSB Recommendation M-76-8 to US Coast Guard
Require the installation of an automatic recording device to preserve vital navigational information aboard oceangoing ships
July 17, 1995 NTSB Recommendation M-95-6 to US Coast Guard
Propose to IMO that it require all vessels over 500 gross tons be equipped with VDR
Nov. 27, 1997 IMO Resolution A.861(20)
Performance standards established for 14 data items, including: date and time, position, speed, heading, radar data, wind speed and direction, bridge and communications audio, etc.
Dec. 6, 2000
Passenger ships constructed after July 1, 2002 to carry VDRs capable of recording minimum 12 hours of data identified in performance standards
SOLAS Chapter V, Regulation 20
Locomotive May 26, 1995 FRA Regulation 49 CFR 229.5 and 135 Event Recorder (LER) Aug. 28, 1997 NTSB Recommendation R-97-9 to FRA
Highway On-Board Recorder (OBR)
Event Data Recorder (EDR)
CAA CAB CFR FAA FHWA -
Date
Lead locomotive of any train operated over 30 mph to record speed, direction, time, distance, throttle, brake application and operations, as well as cab signals over last 48 hours Require the recording of crew’s voice communications for exclusive use in accident investigations and with appropriate limitations on public release of recordings
Sep. 30, 1988 FHWA Regulation 49 CFR 395.15
Hours-of-Service rules for commercial vehicle drivers allow use of OBR to record duty status, distance and hours driven
Feb. 5, 1990
NTSB Recommendation H-90-28 to FHWA
Require automated/tamper-proof on-board recording devices, such as tachographs or computerized logs
Aug. 5, 1998
NTSB Recommendation H-98-23 to Truck Groups
Advise members to equip fleets with automated and tamper proof on-board recording devices
July 1, 1997
NTSB Recommendations H-97-18 to NHTSA and H-97-21 to Automakers
Develop and implement a plan to gather better information on crash pulses & other crash parameters in actual crashes, utiliz- ing current or augmented crash sensing and recording devices
Nov. 2, 1999
NTSB Recommendations H-99-53 and H-99-54 to NHTSA
Require school buses & motor coaches built after Jan. 1, 2003 to record minimum 17 parameters and to develop and implement standards for the recording of crash data
Civil Aviation Authority Civil Aeronautics Board Code of Federal Regulations Federal Aviation Administration Federal Highway Administration
FRA Federal Railroad Administration IMO International Marine Organization NHTSA - National Highway Traffic Safety Administration NTSB National Transportation Safety Board SOLAS - International Convention for Safety of Life at Sea
Table 1 - Condensed Summary of Activity on EDRs by Mode of Transportation
Proceedings of the Canadian Multidisciplinary Road Safety Conference XII; June 10-13, 2001; London, Ontario Actes de la XIIe Conférence canadienne multidisciplinaire en sécurité routière; 10-13 juin 2001; London, Ontario
2
improving airbag safety. In its April 1998 report, NASA’s Jet Propulsion Laboratory (JPL) outlined “The Need for Better Real-World Data.” [5] The report recommended that NHTSA “study the feasibility of installing and obtaining crash data for safety analyses from crash recorders on vehicles.” It further noted that “crash recorders exist already on some vehicles with electronic airbag sensors, but the data recorded is determined by the OEMs.”
The table includes recommendations from the safety boards to various regulatory bodies and groups calling for EDR technology and/or improvements, as well as some of the key regulations mandating the use and performance of EDRs. The table is intended to provide an overview of the evolution of EDRs in the four modes of transportation. For comparison, Table 2 contains accident statistics from the Transportation Safety Board of Canada and Transport Canada for the four transportation modes. [3,4] Motor vehicle accidents on the highway account for 93 % of all transportation fatalities. Accidents
Injuries
Fatalities
Aviation
5,895
856
1870
Marine
6,612
712
248
Railway
13,906
3,992
1521
Highway
2,273,721
3,274,955
47,225
During the same period of time, the National Transportation Safety Board (NTSB) made recommendations H-97-18 to NHTSA and H-97-21 to domestic and international automobile manufacturers. These recommendations followed a public forum on Air Bags and Child Passenger Safety in March 1997. The NTSB recommended that they “develop and implement, in conjunction with [each other], a plan to gather better information on crash pulses and other crash parameters in actual crashes, utilizing current or augmented crash sensing and recording devices.” [6] NHTSA subsequently formed an EDR Working Group under the Crashworthiness Subcommittee of the Motor Vehicle Safety Research Advisory Committee (MVSRAC), holding its first meeting in October 1998. [7] The overall objective of the working group was to “facilitate the collection and utilization of collision avoidance and crashworthiness data from on-board EDRs.” The meetings dealt with the following specific objectives:
Table 2 - Accident Statistics (1986 through 1998)
All four major transportation groups continue to develop and further the evolution of EDRs for their industry. At present, automotive EDRs remain the only group not covered by government regulations or any performance standards.
1) 2) 3) 4) 5) 6) 7) 8)
Background on Automotive EDRs Although airbags first appeared on a limited number of vehicles in the 1970's, it was not until the late 1980's that U.S. regulations began the phasing in of airbags on passenger vehicles. The technological advancements introduced to determine when an airbag should deploy have opened the doors to recording crash event data.
Status of EDR technology Data elements to record Collection & storage of data Retrieval of data Responsibility for permanent record Data ownership & privacy Customers of EDR data EDR demonstrations.
On May 31, 1999 the charter for the MVSRAC expired, but the EDR Working Group continued meeting under NHTSA’s Office of Research and Development (R&D) and is currently in the process of drafting a final report.
In December 1996, the National Highway Traffic Safety Administration (NHTSA) and National Aeronautics Space Administration (NASA) agreed to cooperate in applying their advanced technologies to
Proceedings of the Canadian Multidisciplinary Road Safety Conference XII; June 10-13, 2001; London, Ontario Actes de la XIIe Conférence canadienne multidisciplinaire en sécurité routière; 10-13 juin 2001; London, Ontario
3
An International Symposium on Transportation Recorders was held in May 1999. The symposium was sponsored by the NTSB and the International Transportation Safety Association (ITSA) with a goal of “sharing knowledge and experience gained from the use of recorded information to improve transportation safety and efficiency.” The symposium saw papers presented by participants from all of the transportation groups. [8]
Types of Automotive EDRs
The NTSB also made recommendations to the trucking industry regarding recording devices. In a July 1998 report, the NTSB issued recommendation H-98-23 to various truck groups to “advise your members to equip their commercial vehicle fleets with automated and tamper-proof on-board recording devices, such as tachographs or computerized recorders, to identify information concerning both driver and vehicle operating characteristics.” [9] This followed a similar recommendation (H-90-28) to the Federal Highway Administration (FHWA) in 1990.
Aftermarket Systems
Automotive EDRs can be divided into aftermarket systems and original equipment manufacturer (OEM) systems. A variety of aftermarket and OEM EDRs are currently available in the automotive industry. The data collected and the type of event recorded varies from system to system. The following is an overview of various EDR devices.
Tachographs Invented in 1921, tachographs are mechanical devices which generally display a clock, speedometer and odometer. They are used primarily in Europe on heavy trucks, buses and emergency vehicles. A clock mechanism rotates a circular chart inside the unit and styli can record data on the front and back of the chart. Vehicle speed, distance, engine RPM and time are recorded continuously on a 24 hour chart. Following an accident, tachograph charts can be evaluated microscopically with computer-aided analysis of the polar co-ordinate data to the nearest second. [12]
The NTSB issued two more recommendations on recorders to NHTSA following a September 1999 special investigation report on bus crashworthiness issues. Recommendation H-99-53 would “require that all school buses and motorcoaches manufactured after January 1, 2003, be equipped with on-board recording systems” to record at minimum: longitudinal, lateral, and vertical acceleration; heading; vehicle and engine speed; braking and steering input; as well as the status of various vehicle systems. [10] Recommendation H-99-54 was to “develop and implement ... the standards for on-board recorders,” addressing such items as the parameters, sampling rates and duration of data to be recorded.
Electronic Recorders A digital electronic recorder for transport vehicles was first discussed in a 1984 paper. [13] These onboard recording devices, also referred to as trip recorders, are electronic versions of the tachograph, recording similar data to the conventional tachograph. However, much more extensive and detailed reporting is available with an electronic recorder. Although these devices are used primarily to monitor a commercial vehicle driver’s duty status, they can be programmed to record data upon manual activation by a driver or automatically in rapid deceleration or accident events.
A Truck and Bus EDR Working Group was established under NHTSA’s Office of R&D, holding its first meeting in June 2000. [11] It was suggested that this group coordinate its efforts with a task force set up under The Maintenance Council (TMC) of the American Trucking Associations (ATA) in March 2000. The task force is also addressing the issue of EDRs with the intent of developing a Recommended Practice for TMC.
Accident Data Recorders One of the earliest accident or crash data recorders was a magnetic disc recorder developed by NHTSA which measured triaxial acceleration/time histories.
Proceedings of the Canadian Multidisciplinary Road Safety Conference XII; June 10-13, 2001; London, Ontario Actes de la XIIe Conférence canadienne multidisciplinaire en sécurité routière; 10-13 juin 2001; London, Ontario
4
These recorders were installed on approximately 1050 vehicles between 1972 and 1974, during which time 23 accidents were analyzed with speed changes up to 32 km/h. [14]
maximize fuel efficiency and engine performance. Sensors on the vehicle and engine provide signals to the ECM, such as vehicle speed, engine speed, throttle position, as well as the status of brake, clutch and cruise switches. Current ECMs have built in memory capacity to record historical data about the vehicle’s operation. ECMs can automatically record data upon rapid deceleration. The data is recorded in 1 second intervals up to 60 seconds prior to an event and up to 15 seconds after an event. The data can be downloaded using proprietary software.
Accident data recorders (ADRs) with longitudinal and lateral accelerometers plus a magnetic yaw sensor have been fitted to vehicles in several fleets. [15, 16] The ADR device also accepts a speed input from a vehicle’s speedometer and the status of up to 10 vehicle system parameters, such as brakes, lamps and indicators. The system continuously records data and will automatically (or manually) store up to three accident events with 30 seconds of data prior to an event and 15 seconds of data after an event, with the sampling rate varying for the different elements recorded.
Electronic Airbag Sensors With the introduction of airbags, vehicles must sense the conditions of a crash in order to determine whether airbag deployment is warranted. In frontal impacts, these decisions typically need to be made within 15 to 50 milliseconds. [20] Therefore, sensing systems need to predict the eventual magnitude of a vehicle’s speed change within a very short time from the onset of a collision.
ADRs have also been used in the field of motorsports. Starting in 1993, Indy-type race cars were fitted with impact recorders to measure triaxial accelerations during a crash. [17] Formula 1 race cars began using ADRs in 1997. [18] The latest version of these recorders contain a set of high-g (+ 250 g) and low-g (+ 10 g) triaxial accelerometers, as well as a yaw rate sensor. Additional inputs are provided to the unit from speed, throttle and steering sensors on the cars.
Early systems incorporating multiple mechanical type sensors have given way to single solid-state sensors utilizing microelectromechanical systems (MEMS) technology. These ‘smart’ sensors combine an accelerometer’s crash sensing function with electronic circuitry and algorithms for processing and analysing crash signals.
Video Recorders Another group of aftermarket EDRs are video recording systems, which can visually capture the events leading up to and after any incident. Although video recording can be manually triggered at any time, a video recording system must rely on an ADR in order to automatically activate video recording and to record vehicle parameters during an event.
Some automobile manufacturers have started recording events (which may or may not lead to the deployment of an airbag) with airbag sensing modules. Data of particular interest is the severity of impact and the performance of restraint systems. Additional information monitored by electronic control modules for engines, powertrains and antilock brake (ABS) systems can also be recorded.
OEM Systems Electronic Control Modules
Currently, only GM has made the data recorded by their airbag sensors readily accessible to the accident investigation community. As such, the remaining sections of this paper focus on the recording and retrieval of data from airbag modules found in certain GM vehicles.
Electronic Control Modules (ECM) were introduced on diesel engines in the 1980's. [19] ECMs are typically mounted on the engine block of a heavy vehicle and control the engine’s operation to
Proceedings of the Canadian Multidisciplinary Road Safety Conference XII; June 10-13, 2001; London, Ontario Actes de la XIIe Conférence canadienne multidisciplinaire en sécurité routière; 10-13 juin 2001; London, Ontario
5
Data Recording with SDMs
System Status Parameters
Since 1994, GM vehicles have been using electronic sensors called Sensing and Diagnostic Modules (SDM) which have the capability of recording event data. Although a number of different SDM types have been used in various GM vehicles since that time, there are currently two predominant SDM types that can be accessed with the data retrieval system from Vetronix. Those SDMs are: (i) the SDM-R, found on the majority of 1996 through 1999 GM vehicles, and (ii) the SDM-G, found on most GM vehicles manufactured since 1999. A third SDM, found in certain Cadillac and Buick vehicles, can also be accessed, but the following discussion deals primarily with the SDM-R and SDM-G shown in Figure 1.
All of the SDM types record the status of the following restraint and vehicle system parameters for both deployment and near deployment events: 1. Driver’s Seat Belt - The status of the driver’s seat belt switch circuit is determined as closed or open via direct wiring to the SDM in most vehicles, but may be transmitted through the Body Control Module (BCM) on some vehicles. The driver’s seat belt is recorded as buckled or unbuckled, however, the status may be incorrectly reported on some vehicles if the electrical system is compromised during a crash. 2. SIR Warning Lamp - The status of the supplemental inflatable restraint (SIR) warning lamp is recorded directly by the SDM as on or off at the time of an event. 3. RF Airbag Suppression - The status of the right front passenger’s airbag suppression switch circuit, wired directly to the SDM, is determined as on or off for any deployment or near deployment event. 4. Ignition Cycles @ Event(s) - The number of ignition cycles at the time of both deployment and near deployment events are recorded.
Figure 1 - SDM-G (left) and SDM-R (right)
The information recorded by the SDMs consist of both discrete and variable data for both deployment and near deployment events. A deployment event occurs when conditions are met to warrant an airbag deployment. A near deployment event is defined as any event severe enough to ‘wake-up’ or enable the algorithm in the SDM. The SDM-R stores the near deployment event with the greatest speed change, while the SDM-G stores the most recent near deployment event.
5. Ignition Cycles @ Investigation(s) - The number of ignition cycles at the time of any download is also recorded. Crash Parameters The following crash parameters are recorded by both the SDM-R and SDM-G modules: 1. Forward )V - The change in forward velocity is determined by integrating the average of four 0.312 millisecond acceleration samples and is recorded every 10 milliseconds. The change in speed is recorded for up to 300 milliseconds on SDM-R modules in both deployment and near
Information on the various parameters recorded by the SDMs are outlined in a paper presented by NHTSA and GM at the NTSB symposium on recorders, as well as in the documentation from Vetronix. [21, 22] The following outlines the basic parameters recorded.
Proceedings of the Canadian Multidisciplinary Road Safety Conference XII; June 10-13, 2001; London, Ontario Actes de la XIIe Conférence canadienne multidisciplinaire en sécurité routière; 10-13 juin 2001; London, Ontario
6
deployment events. In SDM-G modules, speed change is recorded for up to 150 milliseconds during deployment events and is adjusted upon download to compensate for a +1 g bias applied by the sensing algorithm to prevent inadvertent airbag deployments in certain situations.
4. Brake Status - Depending on a vehicle’s options, the status of the brake switch circuit is determined as on or off and transmitted by either the PCM or ABS module every second. The brake status data indicates whether the brake pedal was depressed but does not indicate the amount of braking and may or may not be synchronized with the other pre-crash data.
2. Time to Deployment - The time (in milliseconds) is measured from algorithm enable (defined by two consecutive acceleration samples of approximately 2 g’s) to the command for airbag deployment (and pretensioner deployment, if a vehicle is so equipped).
5. Data Validity - The result of a pre-crash electronic validity check is recorded to indicate if any of the four pre-crash parameters are out of range or if any faults are diagnosed.
3. Time Between Events - The time (in seconds) between a deployment event and a near deployment event is recorded, if the near deployment event occurred less than 5 seconds before a deployment event.
It is important to note that the pre-crash data is not synchronized with the start of the crash data, therefore, the pre-crash data may be skewed from the crash data by up to one second.
4. Time to Maximum )V - In the SDM-R module, the time (in milliseconds) from algorithm enable to maximum speed change in near deployment events is also recorded.
Data Retrieval using CDR Vetronix Corporation developed its first Event Data Retrieval Unit (EDRU) in 1990 for GM to use as a proprietary tool to access and download crash event data from their Diagnostic and Energy Reserve Modules (DERM). DERMs were installed on GM vehicles starting in 1990, prior to the use of SDMs. The EDRU unit was also used by GM to access and download data from SDMs starting in 1994.
Pre-Crash Parameters The following pre-crash parameters are also recorded on SDM-G modules for both deployment and near deployment events: 1. Vehicle Speed - The speed of a vehicle (fitted with specification tires and final drive axle ratio) is picked up by a sensor and transmitted from the Powertrain Control Module (PCM) every second for up to 5 seconds prior to any event.
In March 2000, Vetronix unveiled a Crash Data Retrieval (CDR) system which was developed as an aftermarket tool. The CDR system allows accident investigators to access and download crash event data from various airbag modules. At present only certain SDMs in GM vehicles can be accessed, but the intent is to include the other SDMs and the earlier DERMs.
2. Engine RPM - The engine speed or revolutions per minute (RPM) is also picked up by a sensor and transmitted from the PCM along with the vehicle speed.
In November 2000, Ford agreed to let Vetronix develop software to enable CDR users to download crash data from Restraint Control Modules (RCM) found on selected Ford vehicles. Software updates and cables are expected before the end of 2001, providing access to crash data recorded on certain Ford vehicles.
3. Percent Throttle - Throttle position is determined by a rotary potentiometer as a percentage of wide open throttle and transmitted from the PCM along with the vehicle and engine speeds.
Proceedings of the Canadian Multidisciplinary Road Safety Conference XII; June 10-13, 2001; London, Ontario Actes de la XIIe Conférence canadienne multidisciplinaire en sécurité routière; 10-13 juin 2001; London, Ontario
7
The flowchart in Figure 2 illustrates the process followed to download data from SDMs in GM vehicles using the CDR system. Vehicle supported?
No
Yes No data currently available
Start CDR
Enter VIN & case info Connect CDR to COM port on PC
Yes
Electrical intact?
No
12v
12 or 120 v?
Figure 3 - CDR Connected to DLC
120v
Connect CDR to DLC Connect CDR to DC
If the airbags have deployed, then the SDM must be replaced and can, therefore, be removed from the vehicle, following appropriate procedures for the removal and preservation of the modules. Care should be taken during the downloading of data from an SDM removed from a vehicle as a force on the module when it is connected to a power source can result in a near deployment event being overwritten. Deployment events cannot be overwritten, altered or cleared. Near deployments are automatically cleared after 250 complete ignition cycles.
Connect CDR to AC
Turn ignition on (Do Not Start) Connect CDR to SDM
Download & save data
Figure 2 - Flowchart of CDR Operation
Figures 4 through 7 contain samples of typical data obtained from GM’s SDM using the CDR system.
If a vehicle’s electrical system is still intact, then the crash data can be downloaded through the Diagnostic Link Connector (DLC), which provides a connection to the vehicle’s data bus. Figure 3 illustrates the CDR system connected to the DLC found under the dashboard on the driver’s side of all GM vehicles built since 1996. If a vehicle’s electrical system is not intact, then a direct connection to the SDM is required. The location of the SDM varies from model to model, but in most vehicles it can be found under one of the front seats or under the centre console. Power from a 12 volt DC source is required to perform the download and can be provided by another vehicle’s cigarette lighter, a portable battery pack, or a 120 volt AC/DC adapter.
0G4K00000X0000000 B600: FF F7 7D FF B608: FF BB 7B FF B610: FF FF 85 85 B618: FF FF 83 83 B620: E9 E9 FF FF B628: FF 55 FF FF B630: FF FF 7F F0 B638: DC D1 C7 B5 B640: 3C 39 35 32 B648: 28 28 28 28 B650: 28 28 FF 44 B658: 00 83 F0 FF B660: FF FA FA FA B668: EE DB BE C0
FF FF FF FF FF 83 F8 9D 30 28 ED 1F 4D FF
D6 FF FF F8 FF FF F1 80 2D 28 FF F5 00 B4
7C FF 84 7E FF FF EF 6A 29 28 FF F5 FF A7
FF FF 84 FF FF F7 E7 49 28 28 FF 18 F1 9C
Figure 4 - Sample Hexadecimal Data
Proceedings of the Canadian Multidisciplinary Road Safety Conference XII; June 10-13, 2001; London, Ontario Actes de la XIIe Conférence canadienne multidisciplinaire en sécurité routière; 10-13 juin 2001; London, Ontario
8
....
Testing Twelve low speed rear end vehicle-to-vehicle collisions were staged using two different GM bullet vehicles. The purpose of the tests was to examine the threshold and sensitivity for data recorded by the SDMs and to compare the SDM data with results from other instrumentation. Table 3 summarizes the information about the vehicles used in the tests.
Bullet
Figure 5 - Sample Data Summary
Target
1st Series
2nd Series
Vehicle
2000 Chevrolet Malibu
1997 Chevrolet Cavalier
Mass
1384 kg
1265 kg
SDM
SDM-G
SDM-R
Vehicle
1984 VW Rabbit GTI
1994 Honda Accord
Mass
898 kg
1305 kg
SDM
n/a
n/a
Table 3 - Summary of Test Vehicles
Test Procedure A vehicle mounted fifth wheel was used to record the speed of the bullet vehicle. The fifth wheel logged vehicle position versus time in 32 millimetre increments and was calibrated at the start of the tests. The fifth wheel data was captured using a Quatech DAQP-12H capture card sampling at 1000 Hz. The bullet vehicle was also fitted with a strip chart and its position was recorded at 0.5 centimetre intervals for 100 centimetres pre and post impact using a digital video camera at 30 frames per second with a shutter speed of 1/2000th of a second.
Figure 6 - Sample Crash Delta V Graph
The bullet vehicle in the first series was in ‘neutral’ for the first three runs, as was the bullet vehicle for all the runs in the second series of tests. For these runs, the bullet vehicle was allowed to roll forward along a sloped grade into the rear of the target vehicle which was also in ‘neutral’. The bullet vehicle was placed in ‘drive’ for the final two runs of the first series and allowed to idle forward into the rear of the target vehicle. There was no pre-impact braking.
Figure 7 - Sample Pre-Crash Graph
In addition to the above data and graphs, the CDR system also prints out an ‘SDM Data Limitations’ page stating the limitations in the data for each SDM, which should be consulted after downloading the data.
Proceedings of the Canadian Multidisciplinary Road Safety Conference XII; June 10-13, 2001; London, Ontario Actes de la XIIe Conférence canadienne multidisciplinaire en sécurité routière; 10-13 juin 2001; London, Ontario
9
conducted at an impact speed of 5.6 km/h, or below the impact speed of 6.0 km/h in the previous run. This is consistent with the data limitation information for the SDM-G module in the 2000 Chevrolet Malibu, which indicates that the most recent near deployment event will be stored.
Figure 8 shows a typical plot of vehicle speed versus time for the bullet vehicle, pre and post impact, as recorded by the fifth wheel. km/h 9 8 7
The vehicle’s pre-crash speed was not recorded by the SDM when the Malibu rolled forward in ‘neutral’. Only when the transmission was in ‘drive’ for the last two runs was a speed recorded by the SDM. Since the pre-crash data is only recorded up to 1 second prior to algorithm enable, the speed recorded by the fifth wheel at 1 second prior to impact was compared to the SDM recorded speed. Table 4 lists the SDM speed converted to km/h, although the actual SDM data was displayed as an integer speed in mph. The SDM data showed a speed of 2 mph for both of the last two runs. The speeds recorded by the fifth wheel were 4.4 km/h (2.7 mph) and 3.9 km/h (2.4 mph). Part of the difference can be explained by rounding error.
Cavalier 7
6 5 4 3 2 1 0 19.5
20.0
20.5
21.0 s
Figure 8 - Typical Vehicle Speed vs. Time Plot
1st Series of Tests (with SDM-G) The results from the first series of tests involving five runs with the 2000 Chevrolet Malibu as the bullet vehicle are contained in Table 4 below. There is no speed change data provided by the SDM-G module in the 2000 Chevrolet Malibu and only the pre-crash speed is considered. Impact Speed
Speed Change
SDM (km/h)
New Near Deploy Event
Speed @ -1 second
Run 5th Wheel 5th Wheel 5th wheel (km/h) (km/h) (km/h) 1
2.7
1.7
2.2
n/a
n/a
2
4.4
2.6
4.0
0
Yes
3
5.6
3.4
5.3
0
Yes
4
6.0
3.5
4.4
3.2
Yes
5
5.6
3.4
3.9
3.2
Yes
2nd Series of Tests (with SDM-R) The results for the second series of tests involving seven runs with the 1997 Chevrolet Cavalier as the bullet vehicle are contained in Table 5 below. There is no pre-crash data recorded by the SDM-R module in the 1997 Chevrolet Cavalier and only speed change versus time is considered. Impact Speed
Run 5th Wheel 5th Wheel (km/h) (km/h)
Table 4 - Results of 1st Test Series (2000 Chevrolet Malibu)
The first run resulted in a speed change of 1.7 km/h for the Malibu and did not produce a near deployment event, while the second run resulted in a speed change of 2.6 km/h and did produce a near deployment event. Each of the subsequent runs also produced a near deployment event, even in the last run which was
Duration of Data
SDM (km/h)
SDM (ms)
New Near Deploy Event
Speed Change
1
2.6
2.1
n/a
n/a
n/a
2
3.4
2.7
n/a
n/a
n/a
3
4.5
3.5
n/a
n/a
n/a
4
6.6
5.0
2.8
40
Yes
5
7.2
5.5
4.2
60
Yes
6
7.1
5.4
-
-
No
7
8.4
6.4
4.9
60
Yes
Table 5 - Results of 2nd Test Series (1997 Chevrolet Cavalier)
Proceedings of the Canadian Multidisciplinary Road Safety Conference XII; June 10-13, 2001; London, Ontario Actes de la XIIe Conférence canadienne multidisciplinaire en sécurité routière; 10-13 juin 2001; London, Ontario
10
The first three runs, resulting in speed changes of 2.1, 2.7 and 3.5 km/h for the Cavalier, did not produce a near deployment event. However, it was noted that a previous near deployment event had been recorded by the Cavalier’s SDM, prior to any of the tests being conducted. The previously stored event registered a maximum SDM recorded speed change of 0.3530 km/h (0.2194 mph) 7.5 milliseconds after algorithm enable. The fact that this event was not overwritten in the first three runs indicates that the speed change of that event, over a finite time, was not exceeded.
Case Studies Since EDR technology is still evolving and only the data from SDMs on certain GM vehicles are readily accessible, there are relatively few cases with EDR data to consider. Even if a vehicle equipped with an EDR is involved in a collision, the data may be limited due to the nature of the crash. Refer to Table 6 for a summary of cases in this study involving vehicles equipped with an EDR and the data that has been downloaded from them.
The fourth and fifth runs with the Cavalier resulted in speed changes of 5.0 and 5.5 km/h, respectively, and did produce near deployment events each time. The sixth run resulted in a speed change of 5.4 km/h and did not produce a new near deployment event, as the previously recorded speed change was not exceeded. This is consistent with the data limitation information for the SDM-R module in the 1997 Chevrolet Cavalier. The seventh and final run produced a new near deployment event as the 6.4 km/h speed change recorded was greater than previously stored.
# Vehicle
The speed change recorded by the SDM-R module in the Cavalier was lower than the speed change measured by the fifth wheel. However, in the three runs (4, 5 and 7) where a new near deployment event was recorded, the speed change was only recorded for 40 to 60 milliseconds by the SDM. The fifth wheel data and strip chart analysis from these three runs indicated impact durations over 100 milliseconds. Previous studies have also shown typical impact durations of 100 to 300 milliseconds in low speed vehicle-to-vehicle rear impacts. [23] These results suggest that only a portion of the crash pulse was captured by the SDM-R in the 1997 Chevrolet Cavalier used in the second series of low speed tests.
SDM
Crash Type
Pre-crash Speed Belt Speed Change Use (km/h) (km/h)
1
2000 Buick Regal
G
Angled impact
24
12.7
Yes
2
1999 Pontiac Sunfire
R
Narrow impact
n/a
6.0
No
3
1998 Saturn SC2
R
Sideswipe
n/a
0
Yes
4
1997 Chevrolet Monte Carlo
R
Side impact
n/a
0
Yes
5
1996 Pontiac Grand Am
R
Multievent
n/a
0
Yes
Table 6 - Summary of Case with EDR Data
Only the first two cases are discussed below. The other three cases did not result in recorded speed data for the event of interest, however, the algorithms were enabled and seatbelt usage by the drivers recorded. Case # 1 This case involved a 2000 Buick Regal, initially stopped at an intersection, turning left in front of a 1997 Plymouth Voyager travelling at approximately 60 km/h. The front end of the Voyager struck the right front side of the Regal. The airbags in both vehicles deployed and minimal injuries were sustained. The resultant damage to the vehicles from the primary impact is illustrated in Figure 9. There was evidence of subsequent contact between the vehicles during the separation phase.
In the fourth run, the SDM only recorded speed change for 40 milliseconds and was 2.2 km/h less than the speed change measured at the fifth wheel. In the fifth and seventh runs, where 60 milliseconds of data was collected, the SDM data more closely matched the fifth wheel speed change, underestimating the speed change by 1.3 and 1.5 km/h, respectively.
Proceedings of the Canadian Multidisciplinary Road Safety Conference XII; June 10-13, 2001; London, Ontario Actes de la XIIe Conférence canadienne multidisciplinaire en sécurité routière; 10-13 juin 2001; London, Ontario
11
2000 Buick Regal
The SDM crash data showed a 12.7 km/h adjusted algorithm velocity change 80 milliseconds after the SDM algorithm was enabled on the Regal. Since the crash data only presents the forward component of velocity change and is an adjusted value, the physical evidence from the scene and vehicle still need to be assessed. A PC-Crash simulation of the accident yields a principal direction of force (PDOF) of approximately 50 degrees for the Regal, resulting in a longitudinal speed change of 13 km/h for the Regal when combined with an analysis of the damage using WinCrash.
1997 Plymouth Voyager
Figure 9 - Diagram Showing Damage to Vehicles
An accurate PDOF is important in assessing the forward or longitudinal velocity change in an angled impact. Figure 11 illustrates the variance that may result in under or over estimating the PDOF in an angled impact. In this case, using a PDOF of 45 to 55 degrees in the analysis would have resulted in a longitudinal speed change between 11 and 14 km/h.
The Regal was equipped with an SDM-G module that recorded both pre-crash and crash data. Refer to Figure 10 for the pre-crash data downloaded from the Regal. The SDM did not capture the entire acceleration sequence of the Regal, however, the data did reveal that the Regal accelerated from a speed of 13 km/h (8 mph) at the -5 second reading up to a maximum speed of 24 km/h (15 mph) at the -2 second reading. This data represents an average acceleration of 0.1 g.
100 80 60 % Variance in Forward Delta V
The pre-crash data also revealed that the brake pedal was applied up to 1 second prior to algorithm enable. Since the pre-crash data is not synchronized with the enabling of the algorithm and there is uncertainty in the amount of braking that may have occurred, the actual vehicle speed at impact could still vary between 0 and 23 km/h.
+/- 5 degrees
+/- 10 degrees
40 20 0 -20 -40 -60 -80 -100 0
10
20
30
40
50
60
70
80
90
PDOF (Degrees)
Figure 11 - Variance in Velocity Change vs. PDOF
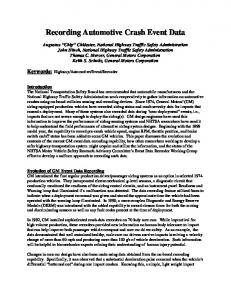
Case # 2 This case involved a narrow impact by an oncoming vehicle at the left front of a 1999 Pontiac Sunfire. Figure 12 illustrates the damage sustained by the Sunfire. The airbags deployed and data was recorded. Since there is no pre-crash data for the SDM-R module in the Sunfire, only crash data is considered. Figure 13 contains a graph of the SDM recorded speed change for the deployment event.
Figure 10 - Pre-Crash Data from 2000 Buick Regal
Proceedings of the Canadian Multidisciplinary Road Safety Conference XII; June 10-13, 2001; London, Ontario Actes de la XIIe Conférence canadienne multidisciplinaire en sécurité routière; 10-13 juin 2001; London, Ontario
12
5 4 3 2
Acceleration (g's)
1 0 -1 -2 -3 -4 -5 -6 -7 -8 -9 -10 0
30
60
90
120
150
180
210
240
270
300
Time (milliseconds)
Figure 12 - 1999 Pontiac Sunfire Damage
Figure 14 - Calculated Acceleration
The maximum recorded velocity change of 6.0 km/h is less than the severity of a barrier equivalent speed of 13 to 22 km/h (8 to 14 mph) typically referenced as a threshold range for airbag deployments. This case illustrates that speed change is not the sole variable or criteria used to make a decision to deploy airbags. Reference 20 discusses various sensing algorithms used with electronic sensors, which include such common variables as speed change, acceleration, jerk, energy and displacement.
The data commences with a -2 g acceleration and reaches a maximum of -7 g within 60 milliseconds, before registering a +2 g acceleration 20 milliseconds later. All of the accelerations are integer values. Discussion Motor vehicle accidents may be investigated by law enforcement personnel, government and academic researchers, vehicle manufacturers, and consultants to the insurance/legal industry. Although each of these entities may investigate an accident for a different purpose, all have a common goal - to determine what happened in the accident.
0 -1
Velocity Change (km/h)
-2 -3 -4
In the pursuit of that goal, accident investigators have utilized data recorded by various types of EDRs in the past. The source of recorded data has previously included tachographs, electronic recorders, engine control modules, and aftermarket accident data recorders, all used to monitor driver and/or vehicle performance.
-5 -6 -7 -8 -9 -10 0
30
60
90
120
150
180
210
240
270
300
Time (milliseconds)
The introduction of airbags and the use of electronic sensors to sense and process crash signals, has made common recording of crash event data more feasible. This opportunity was highlighted in recommendations from JPL and NTSB to NHTSA and the automotive industry to collect better real world crash data.
Figure 13 - SDM Recorded Velocity Change
Figure 14 contains the corresponding accelerations calculated over the 10 millisecond intervals in the SDM data.
Proceedings of the Canadian Multidisciplinary Road Safety Conference XII; June 10-13, 2001; London, Ontario Actes de la XIIe Conférence canadienne multidisciplinaire en sécurité routière; 10-13 juin 2001; London, Ontario
13
The potential uses and benefits of EDR data from airbag sensing modules include:
Conclusions The following conclusions are derived from this study:
Real Time - Use of EDR data in conjunction with automatic collision notification (ACN) systems would aid in quickly locating crashes and dispatching emergency personnel with better crash information in advance.
1. The evolution of transportation EDRs suggests that electronic airbag sensors will be used on more vehicles to routinely record crash events and that CDR systems will become a mainstream tool for accident investigators.
Law Enforcement - Obtaining impartial EDR data from a collision would help in more accurate determination of facts surrounding an incident.
2. Recorded event data is currently available from a variety of aftermarket EDR systems and OEM recording devices, such as electronic control modules on diesel engines and electronic airbag sensors in certain vehicles.
Government - Collection of EDR data facilitates government in furthering regulatory initiatives to help reduce fatalities, injuries and property loss. Vehicle Design - EDRs allow manufacturers to collect better real world data to monitor system performance and improve vehicle design.
3. GM’s SDM provides additional objective data to accident investigators for vehicles involved in crashes where a sufficient forward change in velocity is experienced, however, physical evidence from the vehicle and scene still needs to be analysed.
Highway Design - The use of EDR data can assist in assessing roadside safety and managing roadway systems.
4. In the low speed tests conducted during this study, the threshold for data recording with an SDM-G module on a 2000 Chevrolet Malibu was between 1.7 and 2.6 km/h. Some underestimation was also observed in the lower speed changes recorded by the SDM-R module on a 1997 Chevrolet Cavalier. Additional testing is required to further investigate and qualify the data recorded in various collisions and conditions.
Insurance/Legal Additional objective data provided by EDRs advance quicker and fairer resolution of insurance and liability issues. Research - EDR data could provide objective databases on driver behaviour and performance, as well as other research related topics. Owners/Drivers - EDRs can help fleet owners and drivers monitor vehicle and driver performance to ensure the safe and efficient movement of people and cargo.
5. At present, the data elements recorded by GM’s SDMs are limited to select pre-crash and crash parameters for limited times during an accident sequence. EDR technology needs to be adopted by more manufacturers with standardized data elements and performance criteria to provide more widespread and well defined data for investigators and researchers.
There are undoubtedly numerous benefits to be gained from the data that can be provided by automotive EDRs, including electronic airbag sensing modules. A crash data retrieval system, such as the CDR tool from Vetronix, brings those benefits to all accident investigators in the form of additional objective data to utilize in the analysis and reconstruction of motor vehicle accidents.
Proceedings of the Canadian Multidisciplinary Road Safety Conference XII; June 10-13, 2001; London, Ontario Actes de la XIIe Conférence canadienne multidisciplinaire en sécurité routière; 10-13 juin 2001; London, Ontario
14
9. National Transportation Safety Board; Multiple Vehicle Crossover Accident: Highway Accident Report; NTSB/HAR-98/01; 1998
References References identified in the paper are listed below and where applicable a URL link to the reference has been provided, current as of May 2001.
(http://www.ntsb.gov/Publictn/1998/HAR9801.htm)
10. National Transportation Safety Board; Bus Crashworthiness Issues: Highway Special Investigation Report; NTSB/SIR-99/04; 1999
1. Grossi, D.R.; Aviation Recorder Overview: Proceedings from the International Symposium on Transportation Recorders; pp. 153-164; 1999
(http://www.ntsb.gov/Publictn/1999/SIR9904.htm)
(http://www.ntsb.gov/Events/symp_rec/proceedings/author s/grossi.htm)
11. National Highway Traffic Safety Administration; Truck and Bus EDR Working Group; U.S. D.O.T. Docket NHTSA-2000-7699
2. Tachographs: Fleet Systems; VDO North America; 2000
(http://dms.dot.gov/) & Search ‘7699'
(http://www.vdona.com/fleet/fleet tacho frames.html)
12. Manual for the Evaluation and Use of the Original Kienzle Tachograph Chart; VDO, Germany; 1998
3. Transportation Safety Board of Canada; TSB Statistical Summary of Aviation, Marine and Railway Occurrences; 1998
(http://www.vdokienzle.com/download/flotte/leitf_en.pdf)
13. Blevins, J.R. and McQuillan, C.M.; A Portable Electronic Vehicle Use Recorder; SAE Paper 840312
(http://www.tc.gc.ca/pol/en/t-facts_e/Safety_Data_Menu.htm)
4. Transport Canada; Canadian Motor Vehicle Traffic Collision Statistics; TP3322; 1999
14. Teel, S.S., Peirce, S.J., and Lutkefedder, N.W.; Automotive Recorder Research - A Summary of Accident Data and Test Results; SAE Paper 740566
(http://www.tc.gc.ca/roadsafety/tp/tp3322/1999/en/page1_ e.htm)
5. Phen, R.L., et al; Advanced Air Bag Technology Assessment; Jet Propulsion Laboratory; JPL Publication 98-3; 1998
15. Fincham, W.F., Kast A., and Lambourn, R.F.; The Use of a High Resolution Accident Data Recorder in the Field; SAE Paper 950351
(http://csmt.jpl.nasa.gov/airbag/index.html)
6. National Transportation Safety Board; Proceedings of the NTSB Public Forum on Airbags and Child Passenger Safety; 1997
16. Lehmann, G. and Cheale A.; The Contribution of Onboard Recording Systems to Road Safety and Accident Analysis: 16th International Technical Conference on the Enhanced Safety of Vehicles; pp. 462-465; 1998
(http://www.ntsb.gov/Publictn/1997/RP9701.htm)
7. National Highway Traffic Safety Administration; Event Data Recorder Working Group Minutes; U.S. D.O.T. Docket NHTSA-1999-5218
17. Melvin, J.W., et al; Investigation of Indy Car Crashes Using Impact Recorders; SAE Paper 962522
(http://dms.dot.gov/) & Search ‘5218'
8. National Transportation Safety Board; Proceedings from the International Symposium on Transportation Recorders; 1999
18. Wright, P.G.; The Analysis of Accident Data Recorder (ADR) Data in Formula 1; SAE Paper 2000-01-3551
(http://www.ntsb.gov/Events/symp_rec/proceedings/symp _rec.htm)
Proceedings of the Canadian Multidisciplinary Road Safety Conference XII; June 10-13, 2001; London, Ontario Actes de la XIIe Conférence canadienne multidisciplinaire en sécurité routière; 10-13 juin 2001; London, Ontario
15
19. Goebelbecker, J.M. and Ferrone, C.; Utilizing Electronic Control Module Data in Accident Reconstruction; SAE Paper 2000-01-0466 20. Chan, C-Y; Fundamentals of Crash Sensing in Automotive Air Bag Systems; Society of Automotive Engineering, Warrendale, PA; 2000 21. Chidester, A., et al; Recording Automotive Crash Event Data: Proceedings from the International Symposium on Transportation Recorders; pp. 8598; 1999 (http://www.ntsb.gov/Events/symp_rec/proceedings/author s/chidester.htm)
22. Vetronix Crash Data Retrieval Tool; Version 1.19; Vetronix Corporation; 2000 (http://www.invehicleproducts.com/cdr.html)
23. Siegmund, G.P., Bailey, M.N., and King, D.J.; Characteristics of Specific Automobile Bumpers in Low-Velocity Impacts; SAE Paper 940916
Proceedings of the Canadian Multidisciplinary Road Safety Conference XII; June 10-13, 2001; London, Ontario Actes de la XIIe Conférence canadienne multidisciplinaire en sécurité routière; 10-13 juin 2001; London, Ontario
16