Virginia Tech. United States .... CEF0301. 2003 Lincoln Towncar. 40.0. 0 ... to 3.2 kHz using the NHTSA program PlotBrowser. ..... Lincoln Towncar (with EDR time shift of .013s). -50. -45. -40. -35. -30 ..... Speed Collisionsâ Society of Automotive.
EVALUATION OF EVENT DATA RECORDERS IN FULL SYSTEMS CRASH TESTS Peter Niehoff Rowan University United States Hampton C. Gabler Virginia Tech United States John Brophy Chip Chidester John Hinch Carl Ragland National Highway Traffic Safety Administration United States Paper No: 05-0271
ABSTRACT The Event Data Recorders (EDRs), now being installed as standard equipment by several automakers, are increasingly being used as an independent measurement of crash severity, which avoids many of the difficulties of traditional crash reconstruction methods. Little has been published however about the accuracy of the data recorded by the current generation of EDRs in a real world collision. Previous studies have been limited to a single automaker and full frontal barrier impacts at a single test speed. This paper presents the results of a methodical evaluation of the accuracy of newgeneration (2000-2004) EDRs from General Motors, Ford, and Toyota in laboratory crash tests across a wide spectrum of impact conditions. The study evaluates the performance of EDRs by comparison with the laboratory-grade accelerometers mounted onboard test vehicles subjected to crash loading over a wide range of impact speeds, collision partners, and crash modes including full frontal barrier, frontaloffset, side impact, and angled frontal-offset impacts. The study concludes that, if the EDR recorded the full crash pulse, the EDR average error in frontal crash pulses was just under six percent when compared with crash test accelerometers. In many cases, however, current EDRs do not record the complete crash pulse resulting in a substantial underestimate of delta-V. INTRODUCTION The Event Data Recorders, now being installed as standard equipment by several automakers, are designed to record data elements before and during a collision that may be useful for crash reconstruction.
Although manufacturers have assigned many different names to these devices, NHTSA refers to them generically as Event Data Recorders (EDRs). Perhaps the single data element most important to crash investigation is the vehicle’s change in velocity or delta-V, a widely accepted measure of crash severity. The traditional method of determining delta-V, based upon correlations with post-crash vehicle deformation measurements, has not always been successful or accurate [Smith and Noga, 1982; O’Neill et al, 1996; Stucki and Fessahaie, 1998; Lenard et al, 1998]. By directly measuring vehicle delta-V, EDRs have the potential to provide an independent measurement of crash severity, which avoids many of the difficulties of crash reconstruction techniques [Gabler et al, 2004]. Little has been published however about the accuracy of the data recorded by the current generation of EDRs in a crash. Previous studies on the accuracy of older-generation EDRs exist, but have been somewhat limited in the range of conditions used. In a study conducted by Transport Canada and General Motors (GM), Comeau et al (2004) examined the accuracy of the delta-V versus time data recorded by GM EDRs in eight separate crash tests involving three vehicle models. EDR delta-V was reported to be ± 10% of the delta-V as measured by the crash test instrumentation. The paper stated that this EDR accuracy was within the manufacturer’s tolerances on cumulative delta-V. Chidester et al (2001) examined the performance of EDRs from model year 1998 GM passenger vehicles. Accuracy was considered to be acceptable, however occasionally the EDRs would report slightly lower velocity changes than crash test accelerometers. Lawrence et al (2003) evaluated the performance of GM EDRs in 260 staged low-speed
Niehoff 1
collisions and found that the EDRs underestimated delta-V. It was found that errors of greater than 100% were experienced during collisions with a delta-V of 4 km/hr. These errors declined to a maximum of 25% at 10 km/hr. OBJECTIVE The primary objective of this study is to establish the accuracy of EDR measurements recorded during full systems crash tests. APPROACH Our approach was to evaluate the performance of EDRs in laboratory crash tests across a wide spectrum of impact conditions. The study is based upon crash tests conducted by both the National Highway Traffic Safety Administration (NHTSA) and the Insurance Institute for Highway Safety (IIHS). In a crash test, passenger vehicles are instrumented with high-precision laboratory-grade accelerometers that can be used as a benchmark against which to compare EDR measurements. By validating the EDRs against crash test instrumentation onboard the subject vehicles, this paper will investigate EDR performance across a range of impact speeds, collision partners, and crash modes including full frontal barrier, frontal-offset, side impact, and angled frontal-offset impacts. As shown in Table 1, data used in this evaluation was collected from thirty-seven separate crash tests. These collisions varied in both severity and type. Twenty-seven of these crash tests were performed by the NHTSA. The remaining ten tests were conducted by the IIHS. Most collisions were frontal impacts of some sort, with approach velocities ranging from 25 to 40mph. Our data set included one side impact. Twenty-five of the NHTSA tests were full frontal rigid-barrier collisions. Eighteen of these collisions were conducted with a vehicle approach speed of 35mph, two at 30mph and five at 25mph. The remaining NHTSA tests include one 25mph 40% offset frontal collision, and one vehicle-to-vehicle collision. The vehicle-to-vehicle collision was conducted using a principal direction of force of 345 degrees and a closing velocity of 68mph. Nine of the IIHS tests were frontal offset tests conducted at an approach velocity of 40mph and an overlap of 40% into a deformable barrier. IIHS conducted the only side-impact test in our data set. Several other EDRs were to be used for the comparisons, but were omitted due to malfunction of the EDR.
ANALYSIS EDR Data Collection For all GM vehicles and two of the Ford vehicles, the EDR data were retrieved using the Vetronix Crash Data Retrieval System. This device provides interfacing hardware and software, which permits data retrieval for certain passenger vehicles. Currently, the Vetronix system can retrieve data from most General Motors vehicles manufactured since model year 1996, some pre-1996 GM models, and a limited number of Ford models. For EDRs not readable by the Vetronix system, Ford and Toyota Motor Companies downloaded the EDR data for this study using a different technique. Thirty of the thirty-seven vehicles tested employed GM EDRs. The GM EDRs in these vehicles have a maximum recording time of 150ms in most cases, with a typical recording duration between 100 and 150ms. Change in velocity is recorded at 10ms intervals. With the exception of the Chevrolet Malibu, the GM EDR records only longitudinal deltaV. The 2004 Chevrolet Malibu, the most advanced GM EDR used in this study, records delta-V in both the longitudinal and lateral directions for up to 300 ms. The remaining vehicles were Fords and Toyotas, which utilize a different type of data recorder. The EDRs used in Ford vehicles record acceleration at 1ms intervals. Of the four Ford EDRs, two are of an older type that record for a duration of approximately 70ms, and two are a newer version that record for approximately 120ms. Toyota EDRs used in this study record velocity for 150ms in 10ms intervals. Both the Ford and Toyota data recorders only record velocity along the longitudinal axis. Crash Test Instrumentation Selection The EDRs used in our study measured the acceleration of the occupant compartment during the crash event. Measurements were compared with crash test accelerometers, which were also mounted in the occupant compartment. The accuracy of the crash test accelerometers was evaluated by comparison with other accelerometers in the occupant compartment to ensure that they were internally consistent with one another. Crash test accelerometers mounted in either the crush zone or to the non-rigid occupant compartment components, e.g. the instrument panel, were not used in this study.
Niehoff 2
Table 1. Data Set Description
1 2
Test Number
Vehicle Description
3851 3952 4198 4238 4244 4437 4445 4453 4454 4464 4472 4487 4567 4702 4714 4775 4846 4855 4890 4899 4918 4923 4955 4984 4985 4987 5071 CEF0107 CEF0119 CEF0209 CEF0221 CEF0326 CEF0301 CEF0313 CEF0401 CES0403 CEF0406
2002 Chevrolet Avalanche 2002 Buick Rendezvous 2002 Saturn Vue 2002 Cadillac Deville 2002 Chevrolet Trailblazer 2003 Chevrolet Suburban 2003 Chevrolet Cavalier 2003 Chevrolet Silverado 2003 Chevrolet Tahoe 2003 Chevrolet Avalanche 2003 Chevrolet Silverado 2003 Saturn Ion 2003 Chevrolet Suburban 2002 Saturn Vue 2002 Saturn Vue 2004 Pontiac Grand Prix 2004 Toyota Sienna 2004 Toyota Solara 2004 Ford F-150 2004 Cadillac SRX 2004 GMC Envoy XUV 2004 Chevrolet Colorado 2000 Cadillac Seville 2004 Saturn Ion 2005 Chevrolet Equinox 2005 Ford Taurus 2004 Toyota Camry 2001 Chevrolet Silverado 2002 Chevrolet Trailblazer 2003 Cadillac CTS 2003 Cadillac CTS 2004 Cadillac SRX 2003 Lincoln Towncar 2003 Lincoln Towncar 2004 Chevrolet Malibu 2004 Chevrolet Malibu 2004 Chevrolet Malibu
Closing Impact Speed1 Angle Overlap (mph) (deg)
35.1 35.1 35.0 35.3 35.1 24.8 34.7 24.3 24.3 35.1 34.7 34.8 35.0 29.7 29.7 34.7 35.1 34.7 35.0 35.1 35.0 35.2 70.4 24.8 35.0 25.0 24.6 40.0 40.0 40.0 40.0 40.0 40.0 40.0 40.0 31.0 40.0
0 0 0 0 0 0 0 0 0 0 0 0 0 0 0 0 0 0 0 0 0 0 330 0 0 0 0 0 0 0 0 0 0 0 0 90 0
0 0 0 0 0 40% 0 0 0 0 0 0 0 0 0 0 0 0 0 0 0 0 50% 0 0 0 0 40% 40% 40% 40% 40% 40% 40% 40% 0% 40%
EDR Model Barrier
Rigid Rigid Rigid Rigid Rigid Rigid Rigid Rigid Rigid Rigid Rigid Rigid Rigid Rigid Rigid Rigid Rigid Rigid Rigid Rigid Rigid Rigid Vehicle Rigid Rigid Rigid Rigid Deformable Deformable Deformable Deformable Deformable Deformable Deformable Deformable MDB2 Deformable
SDMG2001 SDMDG2002 SDMD2002 SDMGF2002 SDMGT2002 SDMGF2002 SDMG2001 SDMGF2002 SDMGF2002 SDMGT2002 SDMGF2002 SDMDW2003 SDMGF2002 SDMD2002 SDMD2002 SDMDW2003 89170-08060 89170-06240 ARM481+ SDMGF2002 SDMGT2002 SDMGF2002 SDMG2000 SDMDW2003 SDMDW2003 ARM481+ 89170-33300 SDMG2000 SDMGT2002 SDMGF2002 SDMGF2002 SDMGF2002 3W1A 3W1A N/A N/A N/A
This is the closing velocity, which is not necessarily the vehicle speed. Moveable Deformable Barrier
Niehoff 3
All crash test accelerometer data used was obtained from the NHTSA’s public database [NHTSA, 2005], or from the IIHS database [IIHS, 2005].
An algorithm, described below, was developed to find the time of algorithm enable, and apply the appropriate time shift.
The EDR crash sensor and the crash test accelerometer were not positioned at the same locations in the car. This may complicate this comparison is some types of crashes. In full frontal barrier crash tests, there should be no difficulty as the EDR accelerometer and a crash test accelerometer located in the occupant compartment should experience the same acceleration. In other types of crash tests such as frontal offset or angled impacts, however, the impact may be characterized by significant vehicle rotation. In these cases, the EDR and crash test accelerometer may experience a different acceleration due to this rotation. One objective of this research study was to quantify this difference.
Adjustment for Differences in Sampling Rate
Time Zero Alignment
GM EDRs sample acceleration at 3.2 kHz. In contrast, the high precision accelerometers used in NHTSA and IIHS tests are sampled at rates between 10 and 20 kHz. As the sampling rate for the crash test instrumentation is substantially higher than that of the EDR, the crash test data was first sub-sampled to 3.2 kHz using the NHTSA program PlotBrowser. The sub-sampled crash test data were then averaged and integrated identically to the method used by the EDR.
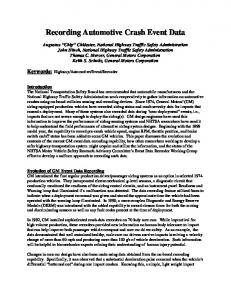
EDRs and crash test procedures use different definitions for the beginning of the event. In the NHTSA and IIHS tests, the beginning of the event is defined as the time when the subject vehicle contacts the opposing barrier/vehicle. In an EDR, the beginning of the event is defined to be the time of algorithm-enable or algorithm-wakeup. Algorithm enable occurs when the EDR experiences a deceleration on the order of 1-2 G’s. At this point, the EDR, believing that a crash may be occurring, begins to record data. Because the crash is already underway before the EDR begins recording, the EDR will not capture the small change in velocity which occurs before algorithm enable. Hence, the two data sets will not be aligned along either the time axis or the velocity axis, and some time and/or velocity shifting will be necessary for an accurate comparison. Figure 1 shows an example of the time and velocity shift resulting from the difference in time zero definition. -0.05
0 -5 0
0.05
0.1
0.15
0.2
0.25
-10 NCAP
Time S hift
-25 -30 -35
Methods for Finding the Time of Algorithm Enable Aligning the EDR velocity change plot with the crash test data has one purpose: to correct for the discrepancies that occur at time zero. The lack of agreement regarding time zero results in error throughout the crash pulse. After evaluating several alignment algorithms, it was found that the most effective method of alignment was to apply a time shift to the EDR based on the sequence of incremental delta-Vs between every two consecutive points. Details of the alternative alignment algorithms considered for this study are described by Niehoff (2005).
EDR
-20
Velocity S hift
MPH
-15
To find the time of algorithm enable, the strategy used with GM EDRs was to process the acceleration measured by crash test accelerometer using the same method by which the EDR processed measurements from its internal crash sensor. Comeau et al (2004) report that GM EDRs sample acceleration at 3.2 kHz. These EDRs average the four acceleration samples measured over each 1.25 ms period. The resulting average acceleration values are integrated to obtain the delta-V over a time interval of 10ms. By comparing crash test data processed in this manner with the actual EDR, the time of algorithm enable can be estimated for cases with air bag deployment.
-40 -45 time
Figure 1. The need for a shifting method.
Essentially, this method checks that the delta-V recorded every 10 ms by the EDR agrees with the delta-V experienced by the crash test accelerometers over the same 10 ms interval. This method first computes the error or difference between the EDR and crash test incremental delta-Vs for each of the 10 ms recording intervals. A 150 ms curve would have 15 such interval error estimates. The EDR curve is then time-shifted to minimize the sum of the squares
Niehoff 4
of these errors. The advantage of this method is that if the EDR suffered an error in one 10 ms recording interval, the effect of this error was restricted to this interval. Errors occurring in the middle of the pulse do not affect the values at the end of the pulse, as they would if the plots were aligned to minimize the cumulative delta-V error. For consistency with the GM EDR performance analysis, the Ford and Toyota EDRs were also processed in a similar manner. To align the Ford EDR data, the EDR acceleration was integrated over
every 10 ms intervals and aligned using the algorithm described above. RESULTS This section presents the results of the comparison of EDR measurements against laboratory-grade instrumentation in 37 full systems crash tests. Velocity plots are composed of the unfiltered, integrated crash test data and the EDR velocity curve with the applied time shift.
0
0 0
0.05
0.1
0.15
0.2
0
0.25
-10
0.1
0.15
0.2
0.25
-10
Crash Test EDR
-15
0.05
-5
-5
Crash Test
-15 MPH
MPH
EDR
-20 -25
-20 -25
-30
-30
-35
-35 -40
-40
-45
time
-45
time
Figure 2. NHTSA Test 3851 – 2002 Chevrolet Avalanche (with EDR time shift of –.002s).
Figure 3. NHTSA test 3952 – 2002 Buick Rendezvous (with EDR time shift of .001s). 0
0 0.05
0.1
0.15
0.2
0
0.25
-10
-10
-15
-15
0.1
0.15
0.2
0.25
EDR
-20
Crash Test EDR
-25
-25 -30
-35
-35
-40
Crash Test
-20
-30
-45
0.05
-5
MPH
MPH
-5
0
-40
time
Figure 4. NHTSA test 4198 – 2002 Saturn Vue (with EDR time shift of -.017s).
-45
time
Figure 5. NHTSA test 4238 – 2002 Cadillac Deville (with EDR time shift of -.012s).
Niehoff 5
0
0 0
0.05
0.1
0.15
0.2
0.25
0
0.05
0.1
0.15
0.2
0.25
-5
-5 -10 Crash Test EDR
-15
-10 EDR
MPH
mph
Cras h Tes t
-20 -25 -30
-15
-20
-35
-25
-40 -45
time
-30
Figure 6. NHTSA test 4244 – 2002 Chevrolet Trailblazer (with EDR time shift of .002s).
time
Figure 7. NHTSA test 4437 – 2003 Chevrolet Suburban (with EDR time shift of .010s).
0
0 0
0.05
0.1
0.15
0.2
0.25
0
-5
0.05
0.1
0.15
0.2
0.25
-5 -10 -15
-10
Crash Test EDR
EDR
MPH
MPH
Crash Test
-20 -25 -30
-15
-20
-35
-25
-40 -45
time
-30
Figure 8. NHTSA test 4445 – 2003 Chevrolet Cavalier (with EDR time shift of -.006s).
time
Figure 9. NHTSA test 4453 – 2003 Chevrolet Silverado (with EDR time shift of .007s).
0
0
0
0.05
0.1
0.15
0.2
0.25
0
0.05
0.1
0.15
0.2
0.25
-5
-5
-10
-10 -15
EDR
-15
Crash Test
-20
MPH
MPH
Crash Test
EDR
-25
-20
-30
-25 -35
-30
-40
time -45
Figure 10. NHTSA test 4454 – 2003 Chevrolet Tahoe (with EDR time shift of .008s).
time
Figure 11. NHTSA test 4464 – 2003 Chevrolet Avalanche (with EDR time shift of .007s).
Niehoff 6
0
0 0
0.05
0.1
0.15
0.2
0.25
0
-5
0.05
0.1
0.15
0.2
0.25
-5 Crash Test
-10
-10 -15
-20
-20
MPH
MPH
EDR
-15
-25
EDR
-30
-30
-35
-35
-40
-40 time
-45
time
-45
Figure 12. NHTSA test 4472 – 2003 Chevrolet Silverado (with EDR time shift of .004s).
Figure 13. NHTSA test 4487 – 2003 Saturn Ion (with EDR time shift of .002s). 0
0 0
0.05
0.1
0.15
0.2
0
0.25
-5
0.05
0.1
0.15
0.2
-5
-10
-10
-15
-15 Crash Test
-20
EDR
-25
MPH
M PH
Crash Test
-25
Crash Test
-20
EDR
-25 -30
-30
-35
-35
-40
-40
time
-45
Figure 14. NHTSA test 4567 – 2003 Chevrolet Suburban (with EDR time shift of .006s).
time
Figure 15. NHTSA test 4702 – 2002 Saturn Vue (with EDR time shift of .002s). 0
0 0
0.05
0.1
0.15
0.2
0.25
0
0.05
0.1
0.15
0.2
0.25
-5
-5
-10
-10
-15 MPH
Crash Test EDR
-20
MPH
-15
-20
-25
-30
-30
-35
EDR
-40
-35 -40
Crash Test
-25
time
Figure 16. NHTSA test 4714 2002 Saturn Vue (with EDR time shift of .003s).
-45 time
Figure 17. NHTSA test 4775 – 2004 Pontiac Grand Prix (with EDR time shift of -.001s).
Niehoff 7
0
0 0
-5
0.05
0.1
0.15
0.2
0
-5
-10
Crash Test
0.05
0.1
0.2
-10
Crash Test EDR
-15 MPH
-20 -25 -30
-20 -25 -30
-35
-35
-40
-40 time
-45
time
-45
Figure 18. NHTSA test 4846 2004 Toyota Sienna (with EDR time shift of .010s).
0 -5 0
Figure 19. NHTSA test 4855 2004 Toyota Solara (with EDR time shift of -.004s). 0
0.05
0.1
0.15
0.2
0.25
-10 -15
0.3
0
0.35
0.05
0.1
0.15
0.2
0.25
-5
Crash Test
-10
EDR
-15
-20 MPH
MPH
0.15
EDR
-15 MPH
0.25
-25
-20
Crash Test EDR
-25
-30 -30
-35
-35
-40
-40
-45 tim e
tim e
-45
Figure 20. NHTSA test 4890 – 2004 Ford F150 (with EDR time shift of .009s).
Figure 21. NHTSA test 4899 – 2004 Cadillac SRX (with EDR time shift of .007s).
0
0
0
0.05
0.1
0.15
0.2
0.25
0.3
0.35
0
0.05
0.1
0.15
0.2
0.25
0.3
0.35
-5
-5
-10
-10
-15
MPH
Crash Test EDR
-20
MPH
-15 EDR -25
-25
-30
-30
-35
-35
-40
-40
time
Figure 22. NHTSA test 4918 – 2004 GMC Envoy XUV (with EDR time shift of .002s).
Crash Test
-20
-45
tim e
Figure 23. NHTSA test 4923 – 2004 Chevrolet Colorado (with EDR time shift of .002s).
Niehoff 8
0
0 0
0.05
0.1
0.15
0.2
0
0.25
0.05
0.1
0.15
0.2
0.25
-5
-5 Crash Test
-10
EDR
MPH
-10 MPH
-15
Crash Test EDR
-15
-20
-25
-20
-30 time
time
-25
Figure 24. NHTSA test 4955 – 2000 Cadillac Seville (with EDR time shift of -.003s).
Figure 25. NHTSA test 4984 – 2004 Saturn Ion (with EDR time shift of .001s).
0
0
0
0.05
0.1
0.15
0.2
0
0.25
-5
0.05
0.1
0.15
0.2
0.25
-5
-10 -10
-15 Crash Test
EDR
-20
-15
EDR
MPH
MPH
Crash Test
-25
-20
-30 -25
-35 -30
-40 -45
time
tim e
-35
Figure 26. NHTSA test 4985 2005 Chevrolet Equinox (with EDR time shift of -.005s
Figure 27. NHTSA test 4987 – 2005 Ford Taurus (with EDR time shift of .006s). 0
0 0
0.05
0.1
0.15
0.2
0
0.25
0.05
0.1
0.15
0.2
0.25
0.3
0.35
0.4
-5
-5 -10
Crash Test EDR
-15
MPH
MPH
-10
-15
-20
Crash Test
-20
EDR
-25 -30 -35
-25 -40
-30
time
Figure 28. NHTSA test 5071 – 2004 Toyota Camry (with EDR time shift of -.003).
-45
time
Figure 29. IIHS test CEF0107 – 2001 Chevrolet Silverado (with EDR time shift of -.001s).
Niehoff 9
0
0 0
0.05
0.1
0.15
0.2
0.25
0.3
0.35
0
0.4
0.05
0.1
0.15
0.2
0.25
0.3
0.35
0.4
-5
-5
-10
-10
-15
-15
-20 Crash Test
MPH
MPH
Crash Test
-20
EDR
-25
NCAP
-25 -30
-30
-35
-35
-40
-40
-45 time
-45
Figure 30. IIHS test CEF0119 2002 – Chevrolet Trailblazer (with EDR time shift of .007s).
Figure 31. IIHS test CEF0209 – 2003 Cadillac CTS (with EDR time shift of -.001s).
0
0 0
0.05
0.1
0.15
0.2
0.25
0.3
0.35
0.4
0
-5
-5
-10
-10
-15
-15
-20
MPH
EDR
-25
0.06
0.08
-35
-35
0.12
0.14
0.16
Crash Test
-40
-45
-45 time
-50
-50
Figure 32. IIHS test CEF0221 – 2003 Cadillac CTS (with EDR time shift of -.001s).
0.05
0.10
0.15
0.20
time
Figure 33. IIHS test CEF0326 – 2004 Cadillac SRX (with EDR time shift of .001s).
0
0 0.00 -5
0.25
0.05
0.10
0.15
0.20
0.25
-10
-10
-15
-15
Crash Test
-25
EDR
MPH
-20 -20 MPH
0.1
EDR
-30
0.00 -5
0.04
-25
-30
-40
0.02
-20
Crash Test
MPH
time
-50
Crash Test
-25
EDR
-30
-30
-35
-35
-40
-40
-45 -50
-45
tim e -50
time
Figure 34. Figure 40. IIHS test CEF0301 – 2003 Lincoln Towncar (with EDR time shift of .013s).
Figure 35. IIHS test CEF0313 – 2003 Lincoln Towncar (with EDR time shift of .010s).
Niehoff 10
0 -5
0
0.05
0.1
0.15
0.2
0.25
0.3
12
0.35
-10
10
-20
Crash Test
-25
EDR
8
MPH
MPH
-15
Crash Test
6
EDR
-30 4
-35 -40
2
-45 tim e
-50
0 0
0.05
0.1
0.15
0.2
0.25
0.3
0.35
0.4
tim e
Figure 36. IIHS test CEF0401 – 2004 Chevrolet Malibu, Longitudinal Delta-V (with EDR time shift of -.047s).
Figure 37. IIHS test CEF0401- 2004 Chevrolet Malibu, Lateral Delta-V (with EDR time shift of -.047s).
16 14 12
MPH
10 8 Crash Test
6
EDR
4 2 0 0
0.05
0.1
0.15
-2
0.2 time
0.25
0.3
0.35
0.4
Figure 38. IIHS test CES0403 – 2004 Chevrolet Malibu, Lateral Delta-V (with EDR time shift of -.047s). 0
12
0
0.05
0.1
0.15
0.2
0.25
0.3
0.35
0.4
-5 10
-10 -15
8
-25
Crash Test
MPH
MPH
-20 EDR
6
Crash Test
EDR
-30
4
-35 2
-40 -45
0
-50
time
0
0.05
0.1
0.15
0.2
0.25
0.3
0.35
0.4
time
Figure 39. IIHS test CEF0406 – 2004 Chevrolet Malibu, Longitudinal Delta-V (with EDR time shift of -.037s).
Figure 40. IIHS test CEF0406 – 2004 Chevrolet Malibu, Lateral Delta-V (with EDR time shift of .037s).
Niehoff 11
DISCUSSION Delta-V Data Analyses All of the delta-v measurements were analyzed to determine if a full crash pulse had been recorded, and also at 100 milliseconds after time zero. First, all units were evaluated, regardless of manufacturer or crash type. Then subsets were examined. Due to there being very few Ford and Toyota units, individual manufacturers were not compared. EDR delta-Vs were compared to the crash test data measurements and percent errors were calculated based on absolute values of the delta-V. Table 2 presents the data for the full crash pulse analyses. Table 2. Percent Error, Full Crash Pulse Analyses of EDR Delta-V Full OffsetAll Frontal Lateral Frontal Frontal Count 31 28 3 21 7 Avg 7.05 5.82 18.56 5.75 6.04 St dev 5.63 4.23 3.70 4.08 4.98 Min 0.19 0.19 14.40 0.19 1.19 Max 21.47 14.85 21.47 13.41 14.85 For all frontal crashes, the average error was slightly less than 6 percent. When frontal crashes were analyzed by crash offset, the observed error was similar, slightly less than 6 percent for full frontal crashes and slightly more than that value for offset frontal crashes. In some cases, the error was nearly zero. For lateral crash pulses, the observed error approached 19 percent. Two of the tests where lateral measurements were observed were offset frontal crashes with vehicles that have lateral measurement capabilities. In this configuration, the vehicle yaws considerably during the test. The resulting spinning motions will produce different lateral acceleration measurements (and hence different measurements of delta-V) if the sensors are mounted at different locations. Since the EDR and crash test sensors are not mounted together, it is quite possible this factor could have magnified the error percentage. Table 3 presents similar data for the 100-millisecond delta-V interval analyses. This comparison includes more cases, as well as examines the accuracy of the EDR without penalization for its recording duration. As can be seen from the averages, adding 6 additional EDR comparisons did not change the results significantly.
Table 3. Percent Error, 100-msec Crash Pulse Analyses of EDR Delta-V
Count Avg St dev Min Max
All 37 6.30 4.49 0.60 21.80
Frontal 34 5.50 3.43 0.60 12.60
Lateral 3 15.43 5.78 10.50 21.80
Table 4 illustrates the problem of insufficient EDR recording duration. The majority of the EDRs did not record the entire event. In one-third of the GM tests (10 of 30), 10% or more of the crash pulse duration was not recorded. In two of the four Ford tests, the last 100 ms of the crash pulse was not recorded. A data loss of this magnitude would prevent an crash investigator from using an EDR to even estimate the true delta-V of a vehicle. We note that the latest generation of Ford EDRs, downloaded from tests 4890 and 4987, has a greatly increased recording duration sufficient to capture the entire crash pulse in a barrier collision. As previously discussed, EDRs begin recording a collision after experiencing a deceleration of 1-2 G’s. Accordingly, one would believe that a corrective time shift would be positive to compensate for the time lost before algorithm-enable, however this was not always the case. Time shifts varied from negative 17ms to positive 13ms, except for two of the Malibu collisions. In the two Malibu tests, the EDR recorded zero delta-V for the first 40ms. These cases resulted in time shifts of negative 47 and negative 37ms. GM has indicated that these large shifts for the Malibu are the result of an error in the Vetronix software which is being corrected. The problem of negative time shifts was restricted to GM and Toyota EDRs in our dataset. None of the Ford EDRs in our study required a negative time shift. Negative EDR time shifts can occur for several reasons. First, they may be an artifact of the test. In a crash test, the car is towed down a track and mechanically disconnected from the towing mechanism 8-18 inches from the barrier. The shock of this mechanical disconnect could theoretically prematurely trigger algorithm enable. For our study, we examined pre-crash test data from each crash test, but could find no evidence of a sufficiently high acceleration to prematurely trigger algorithm enable.
Niehoff 12
Table 4. Summary of the accuracy of EDR performance in crash test
Test Axis Number
3851 3952 4198 4238 4244 4437 4445 4453 4454 4464 4472 4487 4567 4702 4714 4775 4846 4855 4890 4899 4918 4923 4955 4984 4985 4987 5071 CEF0107 CEF0119 CEF0209 CEF0221 CEF0326 CEF0301 CEF0313 CEF0401 CEF0401 CES0403 CEF0406 CEF0406
Long Long Long Long Long Long Long Long Long Long Long Long Long Long Long Long Long Long Long Long Long Long Long Long Long Long Long Long Long Long Long Long Long Long Long Lateral Lateral Long Lateral
Vehicle Year, Make and Model
2002 Chevrolet Avalanche 2002 Buick Rendezvous 2002 Saturn Vue 2002 Cadillac Deville 2002 Chevrolet Trailblazer 2003 Chevrolet Suburban 2003 Chevrolet Cavalier 2003 Chevrolet Silverado 2003 Chevrolet Tahoe 2003 Chevrolet Avalanche 2003 Chevrolet Silverado 2003 Saturn Ion 2003 Chevrolet Suburban 2002 Saturn Vue 2002 Saturn Vue 2004 Pontiac Grand Prix 2004 Toyota Sienna 2004 Toyota Solara 2004 Ford F-150 2004 Cadillac SRX 2004 GMC Envoy XUV 2004 Chevrolet Colorado 2000 Cadillac Seville 2004 Saturn Ion 2005 Chevrolet Equinox 2005 Ford Taurus 2004 Toyota Camry 2001 Chevrolet Silverado 2002 Chevrolet Trailblazer 2003 Cadillac CTS 2003 Cadillac CTS 2004 Cadillac SRX 2003 Lincoln Towncar 2003 Lincoln Towncar 2004 Chevrolet Malibu 2004 Chevrolet Malibu 2004 Chevrolet Malibu 2004 Chevrolet Malibu 2004 Chevrolet Malibu
Crash Crash Crash Delta- EDR Pulse EDR EDR Pulse Test V Time Duration Delta-V Recording Duration Delta-V Error Shift – @100ms @100ms Time (ms) Error (%) (ms) Estimated (mph) (%) (mph) (ms) 35.9 36.9 -2.8 -3 125 110 12.0 41.0 41.4 -0.9 1 103 100 2.9 40.3 38.3 4.9 -17 102 120 None 39.8 37.2 6.5 -12 102 110 None 38.1 36.0 5.5 3 96 100 None 13.5 12.7 6.2 9 169 150 11.2 40.4 36.4 9.9 -6 105 110 None 25.6 23.9 6.6 6 117 100 14.5 27.5 25.4 7.5 8 101 100 1.0 36.6 36.9 -0.7 5 119 100 16.0 36.8 36.0 2.3 4 127 100 21.0 39.3 38.6 1.9 2 148 110 25.5 36.8 37.5 -1.9 5 128 100 21.9 33.3 33.5 -0.6 3 94 100 None 32.3 33.9 -5.1 2 104 100 3.8 37.8 37.3 1.2 -1 116 110 4.8 38.3 39.8 3.8 10 105 150 None 36.3 38.9 6.7 -4 123 150 None 39.7 38.1 4.2 9 99 114 None 36.27 39.05 7.1 7 95 100 None 33.8 36.7 7.8 2 129 100 22.5 35.7 38.9 8.2 2 121 100 17.4 18.4 17.9 2.5 -3 157 110 29.9 28.3 25.9 8.4 2 101 110 None 40.4 35.3 12.6 -4 113 110 2.7 28.9 28.2 -2.5 6 95 114 None 27.9 27.6 1.1 -3 89 150 None 25.0 26.1 -4.4 -1 143 140 2.1 32.8 29.1 11.1 7 131 130 0.8 32.8 29.1 11.2 -1 127 130 None 33.8 29.8 11.9 -1 134 110 17.9 37.5 34.4 8.3 1 129 110 14.7 N/A 19.4 N/A 10 70 56 154 N/A 19.3 N/A 13 75 50.3 151 38.0 36.0 -5.6 -47 220 None 140 -47 7.5 8.7 14 220 None 140 -10.5 -47 300 None 13.6 12.3 144 -5 190 None 37.3 35.5 -37 145 21.8 -37 190 None 6.8 8.7 145
Niehoff 13
Table 5. Accuracy of Pre-Crash Measurements Driver Agree- EDR Actual EDR Seat ment? PrePreTest Vehicle Year, Make and Belt Reported Crash Crash Number Model Buckled Buckled Vehicle Vehicle (y/n) (y/n) Speed Speed (mph) (mph) 3851 2002 Chevrolet Avalanche Y Y Y 35 35.1 3952 2002 Buick Rendezvous Y Y Y 35 35.1 4198 2002 Saturn Vue Y Y Y 35 35 4238 2002 Cadillac Deville Y Y Y 34 35.3 4244 2002 Chevrolet Trailblazer Y Y Y 34 35.1 4437 2003 Chevrolet Suburban Y Y Y 24 24.8 4445 2003 Chevrolet Cavalier Y Y Y 35 34.7 4453 2003 Chevrolet Silverado N N Y 24 24.3 4454 2003 Chevrolet Tahoe N N Y 24 24.3 4464 2003 Chevrolet Avalanche Y Y Y 34 35.1 4472 2003 Chevrolet Silverado Y Y Y 35 34.7 4487 2003 Saturn Ion Y Y Y 35 34.8 4567 2003 Chevrolet Suburban Y Y Y 35 35 4702 2002 Saturn Vue N N Y 30 29.7 4714 2002 Saturn Vue N N Y 29 29.7 4775 2004 Pontiac Grand Prix Y Y Y 35 34.7 4846 2004 Toyota Sienna Y Y Y 34.8 35.1 4855 2004 Toyota Solara Y Y Y N/A 34.7 4890 2004 Ford F-150 Y Y Y N/A 35 4899 2004 Cadillac SRX Y Y Y 35 35.1 4918 2004 GMC Envoy XUV Y Y Y 35 35 4923 2004 Chevrolet Colorado Y Y Y 35 35.2 4955 2000 Cadillac Seville Y Y Y 35 34.7 4984 2004 Saturn Ion N N Y 25 24.8 4985 2005 Chevrolet Equinox Y Y Y 35 35 4987 2005 Ford Taurus N N Y N/A 25 5071 2004 Toyota Camry N N Y N/A 24.6 CEF0107 2001 Chevrolet Silverado Y Y Y 39 40 CEF0119 2002 Chevrolet Trailblazer Y Y Y 40 40 CEF0209 2003 Cadillac CTS Y Y Y 40 40 CEF0221 2003 Cadillac CTS Y Y Y 40 40 CEF0326 2004 Cadillac SRX Y Y Y 39 40 CEF0301 2003 Lincoln Towncar Y Y Y N/A 40 CEF0313 2003 Lincoln Towncar N/A Y Y Y 40 CEF0401 2004 Chevrolet Malibu N/A Y N/A N/A 40 CES0403 2004 Chevrolet Malibu Y N/A N/A N/A 0 CEF0406 2004 Chevrolet Malibu Y N/A N/A N/A 40
% Error
0.3 0.3 0.0 3.7 3.1 3.2 0.9 1.2 1.2 3.1 0.9 0.6 0.0 1.0 2.4 0.9 0.9 N/A N/A 0.3 0.0 0.6 0.8 0.8 0.0 N/A N/A 2.5 0.0 0.0 0.0 2.5 N/A N/A N/A N/A N/A
Niehoff 14
The negative time shifts could also be an artifact of our alignment algorithm. Inspection of the velocity plots however indicates that reasonable alignment has been achieved. As a more analytical check, we performed a sensitivity analysis of variations on time shift, and found that in all cases the alignment algorithm had found the optimal time shift.
100ms, for frontal crashes the average error is also about 6 percent. •
For lateral measurements, the small sample produced large error, but much of the error could be associated with different sensor locations, hence the estimate may be flawed and is not reported in the conclusions.
•
In nearly all cases, the delta-V recorded by the Event Data Recorders was less than the true delta-V. One exception is the new Chevrolet EDRs in the Malibu tests. These units consistently recorded a larger delta-V than the crash test instrumentation.
•
The majority of the EDRs examined in this study did not record the entire event. In one-third of the GM tests (10 of 30), 10 percent or more of the crash pulse duration was not recorded. In two of the four Ford tests, the last 100 ms of the crash pulse was not recorded. A data loss of this magnitude would prevent an crash investigator from using an EDR to even estimate the true delta-V of a vehicle. Although data recorders generally under-predict delta-V, crash investigators can examine a pulse and determine if it completed recording, which reduces the uncertainty of the measurement. In the future, if EDR manufacturers were to extend the recording duration of their products, significant improvement in accuracy would be seen.
The GM EDRs in our dataset recorded driver seat belt buckle status. The Toyota and Ford EDRs recorded both driver and right front passenger seat belt buckle status. The driver seat belt buckle status as reported in each crash test final report was compared against seatbelt buckle status as recorded by the EDRs. In all cases, the driver seatbelt status was correctly recorded by all EDRs.
•
In all tests, the EDRs correctly measured and recorded driver seat belt buckle status.
•
Regarding pre-crash data, of the 28 tests where EDR and test speed were known, the average error was 1.1 percent.
CONCLUSIONS
The authors wish to acknowledge the Insurance Institute of Highway Safety for graciously contributing a large portion of the crash test and EDR data used in our analysis. We also wish to express our special appreciation to Ford and Toyota for retrieving their EDR data. In addition, we express our gratitude to the crash-test facilities that supplied us with the EDRs: Transportation Research Center (East Liberty Ohio), KARCO Engineering (Adelanto, CA), MGA Research Corporation (Akron, NY), and CALSPAN (Buffalo, NY).
Finally, it is possible that the EDR time zero is not always the time of algorithm enable. It is difficult to believe, for example, that the 2004 Chevrolet Malibu EDR, which required a 47 ms negative time shift, could have detected the crash this far in advance of the actual impact without the advantage of exotic technology such as radar crash detection. Pre-Crash Velocity Measurements The GM EDRs and some of the Toyota EDR models in our dataset also stored 5 seconds of pre-crash data including a record of vehicle speed, accelerator/engine throttle position, engine revolutions per minute and brake application. None of the Ford EDRs in our dataset contained pre-crash data. In a total of 28 of the tests, the EDR was capable of recording vehicle speed. As can be seen in Table 5, in general the EDRs performed very well regarding pre-crash measurements. For these EDRs, the error in the vehicle speed was less than 1mph in all cases. Seat Belt Buckle Status
This paper has presented the results of a methodical evaluation of the accuracy of Event Data Recorders in thirty-seven (37) laboratory crash tests across a wide spectrum of impact conditions. •
Results from comparing crash test accelerometers with Event Data Recorders show that if a full pulse is recorded in a frontal crash, the average error is about 6 percent, with some EDRs almost exactly duplicating the crash test instrumentation. If examining the pulse at
ACKNOWLEDGEMENTS
Niehoff 15
REFERENCES 1.
Smith, R.A. and Noga, J.T., “Accuracy and Sensitivity of CRASH3”, SAE Paper 821169 (1982) 2. O’Neill, B, Preuss, C.A., and Nolan, J.M., “Relationships between Computed delta V and Impact Speeds for Offset Crashes”, Paper No. 96-S0-O-11, Proceedings of the Fifteenth International Technical Conference on the Enhanced Safety of Vehicles, Melbourne, Australia (May 1996) 3. Stucki, S.L. and Fessahaie, O., “Comparison of Measured Velocity Change in Frontal Crash Tests to NASS Computed Velocity Change”, SAE Paper 980649 (February 1998) 4. Lenard, J., Hurley, B., and Thomas, P., “The Accuracy of CRASH3 for Calculating Collision Severity in Modern European Cars”, Proceedings of the Sixteenth International Conference on Enhanced Safety Vehicles, Paper Number 98-S6O-08, Windsor, Canada. (June 1998) 5. Gabler, H.C., Hampton, C.E., and Hinch, J., “Crash Severity: A Comparison of Event Data Recorder Measurements with Accident Reconstruction Estimates”, SAE Paper 2004-011194 (2004) 6. Comeau JL, German A, Floyd D; Comparison of Crash Pulse Data from Motor Vehicle Event Data Recorders and Laboratory Instrumentation; Canadian Multidisciplinary Road Safety Conference XIV; (June 2004) 7. Chidester AB, Hinch J and Roston TA; Real World Experience With Event Data Recorders; 17th International Technical Conference on the Enhanced Safety of Vehicles; Paper no. 247 (2001) 8. Lawrence, J.M., Wilkinson, C.C., King, D.J., Heinrichs, B.E., Siegmund, G.P., “The Accuracy and Sensitivity of Event Data Recorders in LowSpeed Collisions” Society of Automotive Engineers Paper No. 01-0679 (2003) 9. Niehoff, P., “Evaluation of Accident Reconstruction Estimates of Delta-V using Event Data Recorders”, M.S. Thesis, Rowan University (May 2005). 10. NHTSA Vehicle Crash Test Database, http://www-nrd.nhtsa.dot.gov/database/nrd11/veh_db.html (2005) 11. IIHS Crash Test Database, http://cedata.iihs.org/ (2005)
Niehoff 16