Proceedings of the International Multiconference on Computer Science and Information Technology pp. 11–16
ISSN 1896-7094 c 2006 PIPS
V-Detector algorithm with tree-based structures Andrzej Chmielewski1 , Slawomir T. Wierzcho´ n2 1
2
Faculty of Computer Science , Technical University of Bialystok, Poland
[email protected] Institute of Computer Science , Polish Academy of Sciences, Warsaw, Poland
[email protected]
Abstract. V-Detector is real-valued negative selection algorithm designed to detecting anomalies in datasets. Many of previous experiments were focused on analysis usability of this algorithm to detection intruders in computer network. Intrusion Detection Systems (IDS) should be efficient and reliable due to large number of network connection and their diversity. Additionally, every connection is described as a record containing tens of numerical and symbolic attributes. Choosing proper structures to store samples of normal connections and detectors can meaningfully speed up the processes of learning and classification of observations; further reduced utilization of processor can be gained. In this paper we examine usefulness of some tree-based structures to represent data in an IDS.
1
Introduction
Generally, the task of anomaly detection can be formulated as an attempt to the identification of nontypical behavior in a system under control. Such a formulation, although very intuitive, is rather vaguely stated from the engineering perspective. This justifies a number of terms and approaches developed to cover the topic, like: novelty detection [9], damaging detection [17], virus detection [15], falsification detection [3], intrusion detection [2], change detector [10], to mention a few. Wide bibliography dedicated to these issues is presented in [2] and [16]. In this paper, we focus on a problem of intrusion detection in computer system. Perfect IDS should recognize not only all intruders, but also should utilize as little as possible of computer resources. The approach we advocate for is based on biologically inspired mechanism of negative selection, [10]. It is a main mechanism used by the immune system to censor so-called T-lymphocytes. Namely, young T-lymphocytes produced in the thymus are tested against self proteins: only those T-cells that do not recognize any self cells can survive with the hope that they will be able to detect any dangerous (or non-self) substances. The results presented in [7] and [8] show that V-Detector algorithm described in Section 4, after some modifications, is quite robust and effective in comparison to e.g. a Support Vector Machine (SVM) classifier which is a strong classification tool [18]. Classification time is very similar for both the algorithms. On the other hand, in the learning stage, time increases linearly with the size of samples of normal connections for V-Detector while for SVM learning time increases logarithmically. It should be noticed that previous experiments performed on V-Detector algorithm were focused mainly on obtaining as high as possible detection rate. Further both the detectors and samples of normal connections were stored in the list structures. In this paper we focus on selecting efficient structures which can speed up V-Detector algorithm.
2
Negative selection
One of the major algorithms developed within emerging field of artificial immune systems (AIS) is Negative Selection Algorithm, proposed by Forrest et al., [10]. It is based on principles of self/nonself discrimination in the immune system. More formally, let U stands for the problem space, e.g. a set of all possible bit strings of fixed length, and S stands for the set of strings representing typical behavior. Then the set of strings characterizing anomalous behavior, N can be viewed as the set-theoretical complement of S: N = U \S (1) The elements of S are called self, and those of N are termed as non-self. To apply negative selection algorithm it is necessary to generate a set D ⊂ N of detectors, such that each d ∈ D recognizes at least one element n ∈ N , and does not recognize any self element. Thus, we 11
12
Andrzej Chmielewski, Slawomir T. Wierzcho´ n
must designate a rule, match(d, u), specifying when d recognizes an element u, consult [19] for details. This approach, although intuitive and simple, admits at least two serious drawbacks. First, it is hard to specify the full set S; typically we observe only a subset S ′ ⊂ S. Second, majority of detection rules induce so-called holes, i.e. regions of N which are not covered by any detector. Surely, instead of the binary representation of the space U we can use real-valued representation, originally proposed in [11]. This paper is focused only on real-valued detectors, described in Section 4.
3
Testing dataset
KDD Cup 1999 [13] is very popular dataset used to evaluate intrusion detection algorithms and other classification algorithms. It contains almost 5 millions records. Each record describes a network connection as a vector of 41 attributes (38 numerical and 3 symbolic) with additional end-label (normal value means self connection). Examples of self and nonself connections are given below: 91, udp, domain u, SF, 87, 45, 0, 0, 0, 0, 0, 0, 0, 0, 0, 0, 0, 0, 0, 0, 0, 0, 1, 1, 0.00, 0.00, 0.00, 0.00, 1.00, 0.00, 0.00, 147, 140, 0.95, 0.01, 0.18, 0.00, 0.00, 0.00, 0.00, 0.00, normal. 0, icmp, eco i, SF, 18, 0, 0, 0, 0, 0, 0, 0, 0, 0, 0, 0, 0, 0, 0, 0, 0, 0, 1, 1, 0.00, 0.00, 0.00, 0.00, 1.00, 0.00, 0.00, 1, 153, 1.00, 0.00, 1.00, 1.00, 0.00, 0.00, 0.00, 0.00, ipsweep. In our experiments all redundant connections was eliminated first. As a result we obtained reduced set Sunique containing 1074994 (almost fivefold reduction) unique connections (812813 normal and 262181 anomalous).
4
V-Detector algorithm
V-Detector algorithm was formally proposed by Ji and Dasgupta [14]. It operates on (normalized) vectors of real-values attributes being points in the d-dimensional unit hypercube, U = [0, 1]d . Each self sample, si ∈ S, is represented as a hypersphere with center at ci ∈ U and constant radius rs , i.e. si = (ci , rs ), i = 1, . . . , l, where l is the number of self samples. Every point u ∈ U belonging to any hypersphere is considered as a self element. Also, detectors dj are represented as hyperspheres: dj = (cj , rj ), j = 1, . . . , m where m is a number of detectors. In contrast to self elements, the radius rj is not fixed but is computed as the Euclidean distance from a randomly chosen center cj to the nearest self element (this distance must be greater than rs , otherwise detector is nor created). Formally we define rj as rj = min dist(cj , ci ) − rs 1≤i≤l
(2)
The algorithm terminates if predefined number Tmax of detectors is generated or the hypercube is sufficiently well covered by these detectors (parameter co).
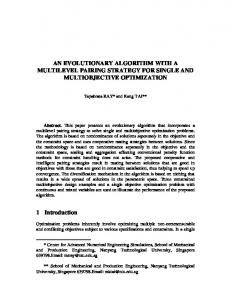
Fig. 1. Example of performance modified V-Detectors for 2-dimentional problem. Grey circles denotes self samples, dashed circles denotes V-detectors, dashed area denotes detector which recognize all samples laying outside the space stretched on self samples and white areas denotes holes.
V-Detector algorithm with tree-based structures
13
Improved version of V-Detector algorithm and technique of dividing dataset which allow achieving very promising results was presented in [7]. More detailed experiments are described in [8] where VDetector was compared with SVM, which is known as very strong classification tool. As a test dataset KDD Cup 1999 was used. The main goal of that investigation was to achieve as high as possible detection rate and low false alarm rate. Performed experiments showed that both rates were really good and comparable to SVM. Additionally, time of learning and classification were measured; although V-Detector was not optimized with respect to its time behaviour, the results was even better than for SVM. Detectors and self samples were stored in corresponding list structures. Consequently, during censoring new candidates for detectors, the following operations, with time complexity of brutal force method, was performed: – checking, if candidate detector is covered by existing detectors, – if not, the distance to all self samples is computed to search the nearest neighbor. Therefore, for a fixed-size dimension d, overall pessimistic computational complexity of creating a detector is of order O(d · (l + m)) where m is the number of existing detectors and l is the number of self samples. Similarly, during the classification process, each tested sample is compared with all detectors; in pessimistic case O(d · m). When l, m, or d increase, this process becomes time consuming. It seems natural to use specially designed methods for identifying best neighbor to a given location of a potential detector. Particularly, we can apply specialized tree-based structures allowing traversing the tree with logarithmic complexity. The main disadvantage of such a method is that it usually offer approximate results. 4.1
Propositions of tree-based structures
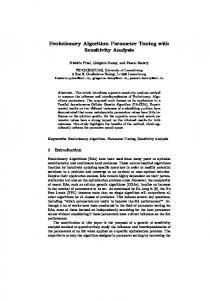
We will focus on two algorithms: the first one identifies the nearest self sample (represented as hypersphere) to a given point q ∈ [0, 1]d and the second one checks if given point q ∈ [0, 1]d is covered by at least one detector from D. Searching for the nearest self sample Since all self samples has fixed-size radius (rs ), problem of searching the nearest hyphersphere to a given point q can be reduced to finding the nearest centre of hypherspheres (see Equation 2). It is the well known problem of searching k-nearest points for a given point q. To solve this problem, several hierarchical data structures have been proposed for handling multi-dimensional point data: k-d tree [4] or grid method [5] to mention a few. In our experiments we decide to use k-d tree structure to store self samples. As reported in [6] this structure is very efficient, especially when the dimension of the data space is small. When the number of dimensions increases then for very large databases its performance degrades exponentially and then it is suggested to use another structure, for example NN-Cell [6]. Since the number of self samples in our experiments is less then 1 million and number of attributes for KDD Cup 1999 dataset can be reduced to about 20 (see [7] do details), we can expect that time for both algorithms will be comparable. k-d tree and its variants k-d tree structure [4] is a binary search tree that stores points of a k-dimensional space. At each intermediate node, the k-d tree divides the k-dimensional space in two parts by a (k − 1)-dimensional hyperplane. The direction of hyperplane, i.e. the dimension on which the division is made, alternates between the k possibilities from one tree level to the next. Each splitting hyperplane contains at least one point, which is used as the hyperplanes representation tree. To obtain balanced k-d tree there is a need to choose a hyperplane that divides the space in two-subspaces with equal number of points. Fig. 2 illustrate balanced 2-d tree with some data point in it. With k-d tree it is possible to traverse the structure with average complexity O(log n + f ) where n is the total number of points and f is the number of points reported in leaf. Building a static k-d tree takes O(n log n) time, whereas list structure takes only O(n). Determining that observation is covered by detector In contrast to self samples, detectors has not constant radius and this implies that other structure than k-d tree must be applied. Fig. 3 shows two detectors d1 = (c1 , r2 ) and d1 = (c1 , r2 ) and an observation q.
14
Andrzej Chmielewski, Slawomir T. Wierzcho´ n
Fig. 2. A distribution of points in the plane and the corresponding balanced 2-d tree.
Fig. 3. Observation q is placed nearer the point c2 that c1 . It will be detected only by the detector d1 because it has larger radius then dist(c2 , q).
Here, it is assumed that the distance between c2 and q is less that the distance between c1 and q, and q is covered only by d1 . For spatial objects the most popular is the R-tree structure [12] and its variants. However, they were developed to store large numbers of objects. Since the number of generated detectors for KDD Cup dataset is rather small (several detectors), complexity of building R-tree (and other tree-based structures) makes that it is not worth to use. We can expect that in this case it is difficult to obtain better results than for list structures.
5
Experiments
Main goal of this paper is to find a recipe allowing acceleration of V-Detector algorithm. Since the usage of structures other than list seems to be ineffective for classification of KDD cup dataset, only time of learning was measured and results are compared for two versions of algorithm: with list structures and with tree-based structures. It is worth to notice, that the learning process includes the following stages: binarization (KDD Cup dataset is text file), normalization and generation of receptors. Therefore, we can not expect that usage of tree-based significantly reduce overall time of mentioned process. To our tests full KDD Cup dataset was divided into two parts: KL and KC (KC is complementary for KL ). KL was used for learning purposes and KC for classification. In the experiments the size of KL was set to: 1%, 10%, 30%, 50%, 70%, 90%, 100% of K. Moreover, the detectors were generated for (see [7] for details): 1. full dataset (DF ULL ), 2. three disjoint subsets (DT CP , DUDP , DICMP ), divided by protocol attribute, 3. each subset of pair attributes protocol and service (for example DT CP,http , DT CP,smtp , DICMP,eco i ). Modified V-Detector algorithm was running with following parameters: rs = 0.005, Tmax = 1000 and with two different values of estimated coverage: co = 0.99 and co = 0.9999. All experiments were repeated 20 times.
6
Results
Table 1 shows the time of generating the detectors for full KDD Cup dataset, TCP protocol and HTTP service with different values of estimated coverage (co) and different parts of learning file. Since DT CP is bigger than DUDP and DICMP datasets, detectors for UDP and ICMP protocols are generated much faster and consequently the time benefits are smaller. Similarly, dataset DT CP,http is the biggest one
V-Detector algorithm with tree-based structures
15
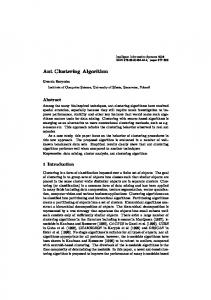
among the all services. In the case of tree-based structures was realized about 25% profit. Overall time for learning process was reduced in average about 7% (see Fig. 4). It follows from the fact that binarization and normalization are computationally complex. In despite of applying structures offering approximately searching of nearest points and detectors, average values of both detection rate and false alarm rate were not change relative to the result obtained with list structures (see [8] for details). This is probably related with the fact that during classification, not only hypersphere detectors are used [7]. (a) List
(b) Tree-based
120
120 FULL TCP HTTP
60 30 0
FULL TCP HTTP
90 Time [s]
Time [s]
90
60 30
1 10
30 70 50 Learning File [%]
90 100
0
1 10
30 70 50 Learning File [%]
90 100
Fig. 4. Average time consumption of overall learning process for full data set, TCP protocol and HTTP service and co = 0.99.
Table 1. Time of generating detectors for different subsets of KDD Cup dataset and different parts of learning file. Dataset DF U LL DT CP DT CPhttp DF U LL DT CP DT CPhttp
7
co 0,99 0,99 0,99 0,9999 0,9999 0,9999
Time of generating receptors [s] 50% of Learning File 70% of Learning File 100% of Learning File List Tree-based List Tree-based List Tree-based 3,4