Rowland, T. (Ed.) Proceedings of the British Society for Research into Learning Mathematics 21(1) March 2001
LISTENING: A CASE STUDY OF TEACHER CHANGE Alf Coles Kingsfield School, South Gloucestershire, and University of Bristol The data for this study is taken from a project [1] looking into the development in year 7 students (aged 11-12) of a ‘need for algebra’ (Brown and Coles, 1999) in four teacher’s classrooms in the UK. I introduce the notions of evaluative, interpretive and transformative listening, (adapted from Davis, 1996), to analyse three transcripts from lessons of one teacher on the project. The project design and case study were informed by ideas of enactivist research (Varela, 1999, Reid, 1996). A change occurred in Teacher A’s classroom, as shown in the transcripts, and the listening of both students and teacher became transformative. There is evidence that specific teaching strategies were linked to this change in listening. Once the change occurred the students started asking their own questions within the mathematics. BACKGROUND In the summary of findings (Coles, 2000) from a one year teacher-research grant (awarded by the UK’s Teacher Training Agency (TTA)) I identified teaching strategies that were effective in establishing a ‘need for algebra’ (Brown and Coles 1999) in a year 7 class (students aged 11-12 years) whom I taught. Evidence for students finding a ‘need for algebra’ was that they were able to ask their own questions about complex mathematical situations and structure their approach to working on these questions. The results of the TTA research formed part of the background to a current research project [1], funded by the Economic and Social Research Council (ESRC). This project involved three other teachers, who had all been part of a steering group on the TTA research, and wanted to work at developing a ‘need for algebra’ in their own year 7 classes (the first year of secondary school in the UK). Since a ‘need for algebra’ was linked to students asking their own questions, whole class discussions in which students developed these questions were seen by all the teachers on the project as being a vital component of their lessons. If discussions amongst a whole class (around twenty six students for each teacher) are to be effective in allowing students to develop their own ideas, then the quality of listening of the students is a key factor. LISTENING AND HEARING I take listening to involve an act of will or decision on the part of the listener. There is an important distinction however between a listening that is active but where no connection is felt with what is said and times where a connection is made and the hearer is changed by what they hear. I have found this distinction useful in thinking about discussions but, in analysing dialogue, I needed a finer grained, observable categorisation. I found this from adapting Davis (1996)'s forms of listening. From Informal Proceedings 21-1 (BSRLM) available at bsrlm.org.uk © the author - 1
Rowland, T. (Ed.) Proceedings of the British Society for Research into Learning Mathematics 21(1) March 2001
THREE FORMS OF LISTENING (1) Evaluative listening If a teacher is listening in an evaluative manner then they will characteristically have a ‘detached, evaluative stance’ (Davis, 1996 p.52) and they will deviate ‘little from intended plans’ (ibid). For such a teacher 'student contributions are judged as either right or wrong ... listening is primarily the responsibility of the learner’ (ibid). The teacher makes assumptions based on a supposed ‘knowledge of the other’s subjectivity’ (ibid) or rather the assumption is the students have knowledge of the teacher’s subjectivity - hence it is the student’s responsibility to listen and learn from the unproblematic access they will thus have to the teacher’s thinking. If students or teacher are listening in an evaluative manner then they would see what others say in terms of right or wrong, and see listening as the others’ responsibility. This is indicated by, for example, someone responding immediately to another’s suggestion with a judgement that it is incorrect (or correct). (2) Interpretive listening Interpretive listening is characterised by an awareness of the ‘fallibility of the sense being made’ (Davis, 1996 p.53). If I hear someone while listening in an interpretive manner then along with whatever connection I make, or any idea that arises, or whatever meaning I take from the words, I am aware that this may not be the connection, idea or meaning the speaker intended. There is a recognition that listening requires: ‘an active interpretation - a sort of reaching out rather than taking in’ (ibid). A response might offer feedback to the speaker not by evaluating what is said but e.g. by offering an interpretation and asking for clarification. (3) Transformative listening When I listen in a transformative mode, then as well as an awareness that what I hear may not be what the speaker intended (characteristic of the hearing of interpretive listening) I am open to change and to the interrogation of assumptions. Evidence of transformative listening in a classroom includes a willingness to alter ideas in a discussion, to engage in dialogue, to entertain other points of view, and hold them as valid, independent of whether they are accepted or not. If a student makes a connection to a previous piece of work or links something that has been said before, this would indicate the transformation of experience, the re-structuring of categories. Similarly, if a student creates a new categorisation, this indicates a creative attention to what is happening: the seeing of ‘a new world’ (Thera, 1996 p.32). CASE STUDY - TEACHER A Methodology There are four researchers on the ESRC project (one of whom is myself), each responsible for a different strand of analysis (e.g. teaching strategies, algebra). From Informal Proceedings 21-1 (BSRLM) available at bsrlm.org.uk © the author - 2
Rowland, T. (Ed.) Proceedings of the British Society for Research into Learning Mathematics 21(1) March 2001
The whole project design has been informed by ideas of enactivist research (Varela, 1999, Reid, 1996, Brown and Coles, 1999, 2000) and a key component of the research process has been that we take multiple views of a wide range of data. We will often look at one piece of data, e.g. a short piece of a videotape of a lesson, and discuss what we see from each of our perspectives. We also tell stories of the changes that are happening over time for the students, teachers and researchers on the project. The three transcripts (see Appendix 1) that I use in this paper are part of a story about learning and about teacher change. All four researchers have written about an expanded version of the last transcript (Brown et al, 2000) weaving a different story to the one I present here. There is no sense of there being a ‘best’ theory for our work or, for example, of the perspective of listening in this paper being ‘better’ than a previous analysis of the same data. An explicit part of the project is that we see ‘research about learning as a form of learning’ (Reid, 1996 p.208). From an enactivist viewpoint learning is the telling of multiple stories and the awareness of ever finer grained distinctions. Methods used for this case study There were four teachers on the project who were videotaped in each of the six halfterms that make up an academic year. The camera was fixed at the back of the classroom - focused on the board but with around half the students in view. The data for this study is taken entirely from the videotapes of one teacher, Teacher A (TA). I was looking at times during the lesson of whole class discussion, i.e. when there was a single conversation occurring in the room. I initially watched the videotapes and noted - at 5 second intervals - whether a student or the teacher was speaking. This record helped me identify times when students responded directly to each other or when there was significant interaction between teacher and students. I then transcribed those sections of dialogue from the video recording. I chose Teacher A for the study because, of the four teachers on the project, there was the clearest evidence of a change in listening on the videotapes of his lessons. Appendix 1 contains three transcripts selected to highlight these changes. Analysis The dialogue in Transcript 1 shows evidence of evaluative listening. After the comments of both S1 and S2, Teacher A says ‘they do’ thus evaluating and confirming the students’ contributions. S3’s comment is greeted with a ‘thank you’ which the other comments were not, suggesting to me that this is the comment that the teacher wanted (although the comment is unclear, from Teacher A’s response I interpret S3 as saying something about the first and last digits of the three numbers under consideration). Further evidence for the teacher having a pre-given idea of what he wanted the students to say is that having started with the general question: ‘Any comments about those three numbers?’, Teacher A then asks: ‘what can you tell me about the first and the last?’. Having started with an open question, since the
From Informal Proceedings 21-1 (BSRLM) available at bsrlm.org.uk © the author - 3
Rowland, T. (Ed.) Proceedings of the British Society for Research into Learning Mathematics 21(1) March 2001
students were not offering what was wanted, the teacher directs their attention to a specific aspect of the problem. I believe the listening in Transcript 2 moves from interpretive to transformative. A student makes a suggestion: ‘It’s got six lines of symmetry’, which is dealt with in a different manner to the ones just before. Rather than continuing the interpretive listening pattern of repeating each student’s contribution and asking for other comments, Teacher A says: ‘Where’s your lines of symmetry then?’. The teacher cannot know where S1’s lines of symmetry are, hence he is genuinely involved in making meaning of the comment. Teacher A then asks for the rest of the class’ opinion: ‘Who thinks it’s a line of symmetry? Hands up’. After S5’s comment, Teacher A gets an A4 piece of paper and starts folding it the ways S5 and then other students suggest. The teacher responds directly to suggestions from students. The task for the class (in this case deciding what is a line of symmetry and how many there are on a rectangle) emerges from the interaction of students and teacher. I read Teacher A’s comment at the start of the transcript: ‘right, we’re talking symmetry’ - which was said with a slightly higher tone of voice, as further evidence that he had not anticipated dealing with issues of symmetry. There is a feel of collaboration and participation in the dialogue characteristic of transformative listening. The participatory nature of discussion is even more evident in Transcript 3 (taken from later in the same lesson as Transcript 2) in which the listening is also transformative. The teacher here is not running the discussion (e.g. posing questions for students to respond to). It is the students who are asking questions: e.g. ‘What would just a straight line be?’. Students are now talking directly to each other and extending each other’s ideas e.g. ‘S3: And a quarter times 48 is twelve’. The transcripts provide evidence that there was a significant change in the listening in Teacher A’s classroom. The listening in videotapes of lessons up to Transcript 2 was interpretive or evaluative and in all later videotaped discussion the listening was transformative, so the change appears to have been a lasting one. CONCLUSION - TEACHING STRATEGIES It is beyond the scope of this paper to deal with what factors have contributed to the change in listening in Teacher A’s classroom, however it is striking that there are a number of teaching strategies in evidence in Transcript 2 (and later discussions) that were not being used in Transcript 1. These strategies include: - the teacher asking a question they do not know the answer to. Teacher A says: ‘Where’s your line of symmetry then?’ Having made this comment there is immediately the possibility for other students to engage with S1 in dialogue. - responding to students’ suggestions. There is evidence of this particularly in the sequence when Teacher A gets a piece of paper and starts folding it.
From Informal Proceedings 21-1 (BSRLM) available at bsrlm.org.uk © the author - 4
Rowland, T. (Ed.) Proceedings of the British Society for Research into Learning Mathematics 21(1) March 2001
- asking for feedback from the whole class. Teacher A asks for ‘Hands up’ in response to the question ‘Who thinks it’s a line of symmetry then?’. Feedback from this response allows the teacher to use the next strategy. - asking a student to explain their idea to the class. These strategies can all be seen as slowing down and opening up discussion. They are strategies that encourage and allow different students to engage in dialogue with each other. In Transcripts 2 and 3 over a quarter of the class speak in a period of a few minutes. Another way of characterising the strategies is that they all depend on the teacher’s contingency upon the responses of the students. It is important to note this does not imply the teacher will do anything the students suggest but only that students’ voices can be heard and can play a part in the creation of the lesson focus. It is striking that in Transcript 3 it is not the teacher who is ‘asking a question they do not know the answer to’, or ‘responding to students’ suggestions’, but the students themselves. It seems that students are taking over some of the roles in discussion previously performed by the teacher - a culture of transformative listening is becoming established in the classroom. In Transcript 3, for the first time on any of Teacher A’s videotapes, students raise their own questions, which they could work on, related to the mathematical activity. 1 ‘Developing algebraic activity in a ‘community of inquirers’’ Economic and Social Research Council (ESRC) project reference R000223044. Contact:
[email protected]. Thanks to the headteacher, governors and staff of Kingsfield School for their unfailing support.
REFERENCES Brown, L. and Coles, A.: 1999, 'Needing to use algebra - a case study.' In Proceedings of the 23rd conference of the International Group for the Psychology of Mathematics Education (PME), Vol. 2 (pp.153-160). Haifa. Brown, L. and Coles, A.: 2000, 'Same/different: A ‘natural’ way of learning mathematics.' In Proceedings of the 24th conference of PME, Vol. 2 (pp. 153-160). Hiroshima. Brown, L., Coles, A., Sutherland, R. and Winter, J.: 2000, 'Developing algebraic activity in a ‘community of inquirers’.' Conference paper presented at BERA, Cardiff, 2000, download from: www.leeds.ac.uk/educol/. Coles, A.: 2000, 'Developing a need for algebra.' In The Teacher Research Grant Scheme, Summaries of findings 1998-1999, Pub. No. 150/8-00. London: Teacher Training Agency. Davis, B.: 1996, Teaching Mathematics: Toward a Sound Alternative. London: Garland. Reid, D. A.: 1996, 'Enactivism as a methodology.' In Proceedings of the 20th Annual Conference of PME, Vol. 4 (pp. 203-209). Valencia. Thera, N.: 1996, The Heart of Buddhist Meditation. Sri Lanka: Buddhist Publication Society. Varela, F.: 1999, Ethical Know-How: Action, Wisdom, and Cognition. Stanford, California: Stanford University Press. From Informal Proceedings 21-1 (BSRLM) available at bsrlm.org.uk © the author - 5
Rowland, T. (Ed.) Proceedings of the British Society for Research into Learning Mathematics 21(1) March 2001
APPENDIX 1
Transcript 2: March 2000
[NB The numbering of students in each transcript is done independently.]
S6: It’s got four sides
S5: Well, if you get like a A4 paper, that’s a rectangle, you can fold it diagonally so that it goes all [unclear]
TA: It’s got four sides, okay, very good, anything else?
Transcript 3: March 2000
Transcript 1: September 1999 TA: Any comments about those three numbers? [The numbers referred to are: 92101, 29810, 54321]
S7: It’s got four equal angles
S1: They all have two in them.
TA: Six lines of symmetry, right, we’re talking symmetry. Where’s your lines of symmetry?
TA: They all have two in them [pause] they do anything else? S2: They all have one in them. TA: They do [Two more students offer suggestions, which TA responds to.] TA: Now remember what we were saying ... when we were looking at four digits we were comparing the first and the last, we were comparing the two middle ones. What can you tell me about the first and the last with those ones ... what can you tell me about the first and the last? S3: [unclear]
TA: Four equal angles, yes S1: It’s got six lines of symmetry
S1: Across the right hand top corner to the bottom left hand corner
TA: Excellent. Oh, lovely. Well done. [Students applaud] So, 3 times 4 is 12, 2 times 6 is twelve, 1 times 12 is twelve and a half times 24 is also 12.. S3: And a quarter times 48 is twelve TA: And a quarter times 48 ... S3: And an eighth times ... S4: Three quarters.
TA: This is a line of symmetry? [TA holds up a ruler along a diagonal of the rectangle] [pause] he’s unsure. Who thinks it’s a line of symmetry? Hands up [pause] a couple of you. [pause] Who thinks it’s not a line of symmetry? [lots of hands go up] Oooh, okay, S3, convince those that think it is why is it not a line of symmetry do you think?
TA: And an eighth times ...
S3: You can only have diagonals in a square
TA: Well, it would be a sixth of a unit. Very small.
TA: Oh right, okay
TA: Thank you S3: nine is bigger than one, S4: Or a circle two is bigger than zero, five is bigger than TA: Why is that one not a line of symmetry one. though? S5 From Informal Proceedings 21-1 (BSRLM) available at bsrlm.org.uk © the author - 6
S: I’m not saying. S: You can actually go on. TA: We could carry on forever couldn’t we? Ss: What about 100? How could you draw it though?
S: If you drew it really big so one square was 6 S: Sir, what would just a straight line be?
Rowland, T. (Ed.) Proceedings of the British Society for Research into Learning Mathematics 21(1) March 2001
EVALUATING TEACHERS’ KNOWLEDGE IN RELATION TO THEIR CHILDREN’S LEARNING Constantia Hadjidemetriou and Julian Williams University of Manchester We report a study of 12 secondary school teachers’ knowledge of their pupils’ errors and misconception in graphical reasoning. A diagnostic test, previously given to their pupils, was used as a questionnaire to these teachers with instructions that they should record their perception of the difficulties of the items on a Likert scale, and suggest misconceptions students might have that would cause difficulty. We built a rating scale and the item-perception-difficulty measures that resulted were correlated with the children’s actual difficulty as estimated by the test analysis. In addition we sought to confirm the teachers' responses through informal interviews. The teachers’ mis-estimation of (relative) difficulties could be explained by one of two reasons: sometimes teachers apparently misunderstood the actual question themselves thus underestimated the difficulty of the item. At other times teachers overestimated the difficulty because they did not realise that children could answer the question without a sophisticated understanding of some concepts i.e the gradient. INTRODUCTION AND BACKGROUND Extended research in Mathematics Education (Clement, 1985; Bell et al., 1987; Even, 1998; Janvier, 1981; Kerslake, 1993; Sharma, 1993; Swan, 1985) has identified common errors and misconceptions in pupils’ graphical thinking which are significant for their learning. These misconceptions are valuable indications and should not be avoided. Cornu (1991) argued that we should lead students to meet them and treat them as ‘constituent parts of the revised mathematical concepts which are to be acquired’. However, as Leinhardt et al said about graphical research: ‘of the many articles we reviewed almost 75% had an obligatory section at the end called something like ‘Implications for teaching’ but few dealt directly with research on the study of teaching these topics’ (Leinhardt et al, 1990, pp. 45).
We would add that the ‘teaching implications’ drawn from research on the psychology of learning mathematics are in any case in general problematic: for many reasons these implications rarely impact on practice. Williams and Ryan (2000) argued that research knowledge about students’ misconceptions and learning generally needs to be located within the curriculum and associated with relevant teaching strategies if it is to be made useful for teachers. This involves a significant transformation and development of such knowledge into pedagogical content knowledge (Even, 1998) which requires its own study. Shulman (1986) refers to the pedagogical content knowledge as knowledge ‘which goes beyond knowledge of subject matter per se to the dimension of subject-matter knowledge for teaching’ (p.9), which includes ‘the ways of representing and formatting the subject that make it comprehensible to others’ (p.10). From Informal Proceedings 21-1 (BSRLM) available at bsrlm.org.uk © the author - 7
Rowland, T. (Ed.) Proceedings of the British Society for Research into Learning Mathematics 21(1) March 2001
This study: • developed an instrument from the research literature to assess children's learning and misconceptions on a scale related to their curriculum, which we suggest is a prerequisite for transforming this knowledge into professional practice, and • explored the development of this into an instrument for assessing this aspect of teachers' pedagogical content knowledge. The development of the assessment instrument involved the tuning of, or the development of, diagnostic items from the research literature on graphicacy to fit the school curriculum. This developed from an analysis of the key work in the field of children’s thinking, identifying items which related appropriately to: 1. Slope-height confusion: pupils failure to distinguish between two graphical features, the slope and the highest value (Clement, 1985); 2. The Linearity prototype: pupils tendency to sketch linear graphs in situations were they are not supposed to (Leinhardt et al, 1990); 3. The ‘y=x’ prototype: pupils’ tendency to believe that all the graphs have a slope of one; 4. The ‘Origin’ prototype: graphs are drawn through the origin; 5. Graph-as-picture: many pupils, unable to treat the graph as an abstract representation of relationships, appear to interpret it as a literal picture of the underlying situation (Clement, 1985); 6. Co-ordinates: pupils’ tendency to reverse the x and the y co-ordinates and their inability to adjust their knowledge in unfamiliar situations (Kerslake, 1993); 7. Scale: pupils prototypically read a scale to a unit of one, or more rarely ten (Williams and Ryan, 2000). METHODOLOGY The study sample (N=425) was of year 9/10 pupils from 7 schools in the North West of the UK. The pupils’ test results were subjected to a Rasch analysis. The result is a single difficulty estimate for each item and an ability estimate for each pupil (see Hadjidemetriou and Williams, under review for PME 2001). The pupils’ teachers were interviewed (N=12) to check that the test was regarded as fair and valid. Our test was also given to the teachers but beyond answering all the questions they were asked to: • predict how difficult their children would find the items (on a five-point scale starting form Very Easy, Easy, Moderate, Difficult, Very Difficult) • suggest likely errors and misconceptions the children would make and • suggest methods/ ideas they would use to help pupils overcome these difficulties
From Informal Proceedings 21-1 (BSRLM) available at bsrlm.org.uk © the author - 8
Rowland, T. (Ed.) Proceedings of the British Society for Research into Learning Mathematics 21(1) March 2001
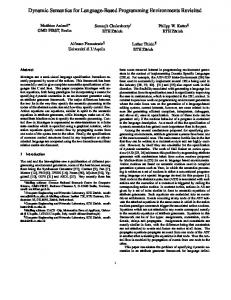
This data is used here to explore the validity of the research data on misconceptions and also the state of the subject matter and pedagogical content knowledge of this small group of teachers. Teachers' responses were also confirmed through informal interviews, where we began to explore their teaching practices. RESULTS As mentioned before, the test was given as a questionnaire to the teachers with instructions that they should record their perception of the difficulties of the items on a five point Likert scale. These data were subjected to a rating scale analysis and the item-perception-difficulty measures that resulted were correlated with the children’s actual difficulty as estimated by the test analysis (rho = 0.395). However, the teachers’ estimates were significantly incorrect on a number of items 5
4
Difficulty scale (in logits)
3
2
1 P u p ils T e a c h e rs 0
-1
-2
-3
2 Tr Ma an r y sp o Tr an rt1 sp or t2 C ar di ff1 C ar di ff2 st or y1 st or y2 st or C y3 ha rit y1 C ha rit y2 W ei gh W t1 ei M gh t 2 ul tip l M es1 ul tip l M e s2 ul tip le s Sq 3 ua re Sq 1 ua re Sq 2 ua r C h a e3 ng e C h a s1 ng e C ha s2 ng es C 3 C han on ge st a n s4 tR at e G re at es In te t rv a l In te 1 rv al 2
ks es
es D
D
ks
1
-4
Q u e s tio n
(see above figure, in which teachers’ ratings of difficulty were scaled on a rating scale analysis, and plotted against 'actual' scaled values of the pupils difficulties). In this paper we will only discuss two items: the ‘Transport 1’ item where teachers overestimated its difficulty and the ‘Story 3’ item whose difficulty was underestimated. ‘Transport 1’ (shown below) was an easy question according to pupils’ answers but some teachers seem to have given quite high difficulty ratings. These teachers believed that pupils had to be aware that the slope of the distance-time graph represents the speed of each transport. However, pupils’ transcripts verify that they could find the answer by looking at the time taken for each transport to travel to school: Interviewer: how can you see that it (A) is quick and that D is slower?
From Informal Proceedings 21-1 (BSRLM) available at bsrlm.org.uk © the author - 9
Rowland, T. (Ed.) Proceedings of the British Society for Research into Learning Mathematics 21(1) March 2001
Sara:
Because …
Andrew:
It takes more time.
Sara:
Yes it takes more time. It takes more time to get to the same part. It takes 40 minutes to get to school and the others it takes 15, 10… The graph shows journeys by four different means of transport from home to school, a distance of two kilometers: Bus, Car, Walking, Bicycle. Match each line with the appropriate transport Distance traveled from home
Distance travelled in Kilometers
5 10 15 20 25 30 35 40
Time in minues
Some pupils identified (after the interviewer’s intervention) that the lines differ as far as steepness is concerned but none of them mentioned that the slope of the graph represents the speed. So, sometimes teachers may overestimate the difficulty of an exercise because they overestimate the level of knowledge needed to answer it correctly. On the other hand, teachers underestimated the difficulty of some other questions such as ‘Story 3’. This item requires pupils to draw the ‘Height of a person’ from Birth up to late thirties. A closer look at teachers’ graphs illustrates the problem.
Two teachers’ graphs for the ‘Story 3’ Item
Prototypes such as the ‘Origin’ and ‘Linearity’ are dominant in these graphs. These graphs not only underestimate the difficulty of the item but also show that these
From Informal Proceedings 21-1 (BSRLM) available at bsrlm.org.uk © the author - 10
Rowland, T. (Ed.) Proceedings of the British Society for Research into Learning Mathematics 21(1) March 2001
teachers have low expectations from their pupils since none of those two graphs would receive full credit, if given by a pupil. In the questionnaire and interviews, the teachers were encouraged to list the misconceptions that children might exhibit. Here we summarise the misconceptions mentioned by the 12 teachers we worked with: TEACHER MISCONCEPTION
1*
2*
10*
11*
12*
‘y = x’ prototype
The Origin prototype
3I
4I
5I
Slope-height
7*
8*
9*
Linearity prototype
Picture-as-graph
Co-ordinates Scale
6Q
*=Interview and Questionnaire, Q = Questionnaire only, I = Interview only
Teacher knowledge of the seven different misconceptions varies dramatically, with half the teachers mentioning only one or two of them, and two of the teachers mentioning all but one of them. These indications of teachers’ knowledge seem highly sensitive to whether the data comes from Questionnaire or Interview data: we suspect the different data sources may relate to whether the teachers’ knowledge is tacit (elicited when provoked by an example question) versus explicit (suggested spontaneously in the interview without the questionnaire prompt). We believe this aspect of the research has interesting potential. CONCLUSION The ‘discrepant’ items were examined for face validity and found perfectly acceptable as test items. However, the teachers’ mis-estimation of their (relative) difficulty could be explained by one of two reasons: • in at least three items the teachers underestimated the difficulty for the children because they apparently misunderstood the actual question themselves, i.e. they had the misconception the item was designed to elicit, or they had a limited understanding that did not receive full credit; or • on two items the teachers' overestimated the difficulty because they did not realise the children could answer the question without a sophisticated understanding of a cocept. This paper presents the part of a research project that deals with evaluating teachers’ subject matter and pedagogical content knowledge. Another part of the research evaluates pupils’ graphical literacy by identifying their common errors and
From Informal Proceedings 21-1 (BSRLM) available at bsrlm.org.uk © the author - 11
Rowland, T. (Ed.) Proceedings of the British Society for Research into Learning Mathematics 21(1) March 2001
misconceptions and by group discussions as a way to get an insight into their mathematical thinking process. However, the aim of the project as a whole is to bring all the findings together and to help inform teachers about their pupils’ actual difficulties and pupils’ actual arguments in order to encourage them to use these in their practices as a starting point for more effective teaching. However, the initial aim of this paper is not to generalise about teachers’ pedagogical content knowledge but to suggest a methodology for evaluating and maybe developing this knowledge. There seems to be a gap between pupils’ difficulties and teachers’ perception of these difficulties. Our concern is to provide research findings and propose a methodology that will help to bridge this gap. BIBLIOGRAPHY Bell, A.., Brekke, G. and Swan, M.: 1987, ‘Diagnostic teaching: 5, graphical interpretation teaching styles and their effect.’ Mathematics Teaching, 120, 50-57. Clement, J.: 1985, ‘Misconceptions in graphing.’ Proceedings of the 9th Conference of the International Group for the Psychology of Mathematics Education, Vol. 1, pp. 369 - 375. Cornu, B.: 1991, ‘Limits.’ In D. Tall (ed.), Advanced Mathematical Thinking (pp. 153-166). London: Kluwer Academic Publishers Even, R.: 1998, ‘Factors Involved in Linking Representations of Functions’. Journal of Mathematical Behavior, 17(1), 105-121. Hadjidemetriou C. and Williams J.S.: (2001, under review) ‘Children's graphical conceptions: assessment of learning for teaching.’ Proceedings of the 25th Conference of the International Group for the Psychology of Mathematics Education. Janvier, C.: 1981, ‘Use of Situations in Mathematics Education’. Educational Studies in Mathematics, 12, 113-122. Kerslake, D.: 1981, ‘Graphs.’ In K. M. Hart (ed.), Children’s understanding of mathematics 11-16 (pp. 120-136) London: John Murray Leinhardt, G., Zaslavsky, O. & Stein, M. S.: 1990, ‘Functions, Graphs and Graphing: Tasks, Learning, and Teaching.’ Review of Educational Research, 60, 1, 1-64. Sharma, S. S.: 1993, ‘Graphs: Children’s strategies and errors.’ London: Kings College. Shulman, L. S.: 1986, ‘Those who understand: Knowledge growth in teaching.’ Educational Researcher, 15 (2), 4-14 Swan, M.: 1985, The language of functions and Graphs, An examination Module for Secondary Schools. Joint Matriculation Board, Shell Centre for Mathematical Education.
From Informal Proceedings 21-1 (BSRLM) available at bsrlm.org.uk © the author - 12
Rowland, T. (Ed.) Proceedings of the British Society for Research into Learning Mathematics 21(1) March 2001
Williams, J. S & Ryan, J. T.: 2000, ‘National Testing and the improvement of Classroom Teaching: can they coexist?’ British Educational Research Journal, 26(1), 49-73.
From Informal Proceedings 21-1 (BSRLM) available at bsrlm.org.uk © the author - 13
Rowland, T. (Ed.) Proceedings of the British Society for Research into Learning Mathematics 21(1) March 2001
A CATEGORISATION OF UPPER SIXTH-FORM STUDENTS' BELIEFS ABOUT MATHEMATICS Katrina Daskalogianni and Adrian Simpson Mathematics Education Research Centre, University of Warwick. The purpose of this paper is to present a categorisation of high achieving upper sixth-form students' beliefs about mathematics as a discipline, about themselves as learners and when working in mathematics. The analysis of data suggests that there are three coherent categories of macro-beliefs among students and within each one there is a system of micro-beliefs. We will argue that these systems of macro-beliefs act as a potential medium of predicting students' working habits and approaches in a given mathematical problem and we will discuss possible ways in which coherent systems of beliefs may change over time. INTRODUCTION The study and analysis of students' mathematical behaviour is better interpreted though theories of cognition that integrate the affective domain. The focal point of this paper is the presentation of an interrelation between affect and cognition by describing students' beliefs about mathematics and by further examining a possible link between these beliefs and their mathematical performance. We ground our research on the understanding that learners' affective responses in mathematics guide their learning and working habits and that this is at least as big an influence on their studies as the cognitive mechanisms that control the form of their learning. The existing literature disaggregates affect into attitudes, beliefs and emotions, which vary significantly in their level of intensity and in their stability. While aspects of all three factors will play a role in the research reported here, we will concentrate on belief. Lester et al (1989) define beliefs as "the individual's subjective knowledge about self, mathematics, problem solving, and the topics dealt with in problem statements." (p. 77). Students form certain beliefs about mathematics during their route through the school environment and these beliefs vary in their domains of attention. Students develop beliefs about the nature of mathematics, about the setting of exercises, about themselves when working in mathematics and the role of the teacher according to their experiences in school. These beliefs are affected by external factors such as the teaching style, the syllabus structure, the exercises and exam requirements and by internal factors as students' own abilities in mathematics and achievement, their preferences of mathematical topics, their confidence and motivation. The beliefs that students develop over time are structured in a hierarchical way according to their centrality within a given belief system. Adapting the theory of Rokeach (1975) concerning the organisation of beliefs within a "central-peripheral dimension" for the individual, we suggest that students' beliefs are constructed in From Informal Proceedings 21-1 (BSRLM) available at bsrlm.org.uk © the author - 13
Rowland, T. (Ed.) Proceedings of the British Society for Research into Learning Mathematics 21(1) March 2001
central belief systems that we call macro-beliefs which in their turn can be seen as an inner structure of peripheral belief systems, varying in depth and stability that we call micro-beliefs. McLeod's suggestion that beliefs are "thought to be relatively stable and resistant to change" can be re-evaluated in the light of Rokeach's ideas and we suggest that the broader macro-beliefs change relatively slowly over time, while the more detailed micro-beliefs may be modified more easily in response to changed circumstances. The analysis of our data suggests that there exist three dominant macro-belief systems among students, which act as a potential medium of predicting their mathematical behaviour in a given mathematical problem. The data presented in the following sections will exemplify the three prevalent macro-belief systems, the "systematic", the "exploratory" and the "utilitarian" and their links with students' respective manifested working habits in mathematics. METHODOLOGY The study presented here focuses on the systems of beliefs and mathematical behaviour of upper sixth-form students. This is the first phase of a longitudinal PhD project that aims to monitor students' development of attitudes towards mathematics in relation to cognitive aspects through the transition from school to university. 27 students participated in this phase of the study, chosen because they had each been offered a place at Warwick's Mathematics Department to study for a pure mathematics degree. Semi-structured interviews were conducted with them three months before their A-level examinations and a mathematical problem was given to the participants at the end of the interview. The selection of the problem was made in a way so that it was comprehensible by the students but without the need for specialist mathematical knowledge, in order to be open to a range of different approaches that we could interpret as the manifestations of different beliefs. This problem also provides us with an opportunity to compare the students' espoused beliefs with their mathematical behaviour. CATEGORISATION OF BELIEFS Analysing data that contain valuable information on the affective domain required the use of an analysis tool that could form a solid theoretical framework for explaining the "delicate" and dynamic characteristics of students' beliefs. Thus we adopted a "Grounded Theory" approach (Strauss and Corbin, 1998) from which three predominant categories of macro-beliefs emerged. In addition the analysis of students' behaviour on the mathematical problem indicated a connection between students' espoused beliefs and expressed practices when working in mathematics. In the following figure we present a synopsis of the emerged macro-beliefs along with their peripheral micro-belief characteristics.
From Informal Proceedings 21-1 (BSRLM) available at bsrlm.org.uk © the author - 14
Rowland, T. (Ed.) Proceedings of the British Society for Research into Learning Mathematics 21(1) March 2001
MACRO - BELIEFS Systematic
Exploratory
Utilitarian
methodical, logical
problem-solving, linking things
tool for other subjects, applied in life
Focus of exercises
follow a series of steps
understand different ways of thinking
obtain correct exam answer
Working in mathematics
exact answer, similar exercises
explore things, enjoy challenge
known algorithms, study techniques
Didactical contract
dependence on notes and teacher
dependence on own abilities
dependence on teacher
MICRO- BELIEFS
Nature of mathematics
In the following paragraphs we will illustrate the belief profile of three students, Katherine, Lara and Andy, who we see as representative of learners belonging to the three key macro-belief systems, "systematic", "exploratory" and utilitarian respectively. It is important to note that the categorisation we have given is one of tendency. For example, some of those categorised as 'systematic' may well accept some of the micro-beliefs from other categories, but it is through the 'systematic' lens that these students come most sharply into focus. Macro-belief 1: "Systematic". The case of Katherine. Students whose beliefs fall into the "systematic" system of macro-beliefs view mathematics as a static and rigid body of knowledge and they like what they perceive as the systematic and methodical way of working in it. Their micro-beliefs also include mathematical exercises having a definite answer that can be approached through following a series of steps. They feel confident with exercises where they have to apply strategies that they have used before in previous problems. Throughout the interview with Katherine we note expressions of views representative of a "systematic" believer and we cite below some indicative extracts from her interview. I: K: I: K:
To rephrase the question a little bit, what do you think that you gain from learning maths? It meant to be some methodical, work through and logical, uhm, it just teaches you how to see things through systematically. Why do you think you prefer maths in relation to other subjects? I'd always liked maths. I think I just, uhm during the lower school and GCSEs I just got sick of writing essays! ☺ And I preferred the scientific
From Informal Proceedings 21-1 (BSRLM) available at bsrlm.org.uk © the author - 15
Rowland, T. (Ed.) Proceedings of the British Society for Research into Learning Mathematics 21(1) March 2001
approach, just an answer and sort of short explanation answer rather than 3 pages essay! ☺
When it comes to the approach of the given mathematical problem, Katherine firstly attempts a specialisation by trying out specific numeric examples but fails to generalise a pattern either algebraic or numeric without being prompted to do so. When she was asked about how she found the exercise she replied: K:
Uhm, it's quite interesting […] I didn't know where to start really.
The 'systematic' macro-belief seems at odds with risk taking and exploration. While attempting a few numerical examples fits, the beliefs about the nature of mathematics leave her with no strategy for tackling an open problem. Macro-belief 2: "Exploratory". The case of Lara. Students whose macro-belief systems are better explained by the "exploratory" category believe that mathematics is a dynamic subject, characterised by the discovery of truths and the exploration of new concepts and approaches to exercises. Their initial views about working in mathematics are focused on the problem-solving nature of it and on the existence of more than one correct answer. They also like the challenge of a new exercise and they are always looking to make interesting links between the concepts involved. Lara, as a typical student of the "exploratory" category, expresses these views in the following passage from the interview with her. I: L:
Is there any topic that you prefer the most among the others? The question is that when I'm doing it, it tends to be the one that there always isn't a straight way obviously, but the more you think about it, the more it makes sense, which is the normal when you link things together rather one particular topic area…I like interesting questions the ones that stick with algebra rather than being difficult because you have to play with the numbers.
When Lara was presented with the mathematical problem she attacked it by considering two different approaches to it. She could immediately make the connections between all the elements of the exercise and she finally proceeded with an algebraic one, which led her to the correct answer. In contrast to students whose macro-beliefs are "systematic" or "utilitarian", Lara felt challenged by the exercise and she tried to understand the meaning of it without immediately complaining that she could not solve it because she had not seen a similar one before. Macro-belief 3: "Utilitarian". The case of Andy. Students whose central belief systems follow the categorisation of the "utilitarian" macro-beliefs consider mathematics to be a tool for other subjects and are mainly concerned with its real life applications. They focus more on study techniques and they are interested in obtaining a correct answer in their homework and exams. Andy's appears characteristic of a utilitarian believer: I:
Right! So no problem at all so far? From Informal Proceedings 21-1 (BSRLM) available at bsrlm.org.uk © the author - 16
Rowland, T. (Ed.) Proceedings of the British Society for Research into Learning Mathematics 21(1) March 2001
A:
No. Sometimes it's a little…deep, but I came out of it eventually. But some of the P1 Step, Special Paper questions I don't like. The P3 and P4 I can do fine. I've got the P1 that's strange. I don't get it. It just tends to be harder I think. Just 'cause P3 and P4 they just tend to be what it is in an A-level really but just with a little bit extra. Imagine a student who's a GCSE student and he or she is asking you "Oh, could you tell me just a few words about A-levels maths?". What would you say to him or her? …It's just the same but more homework! What about the level of difficulty of maths? It is more difficult. You do a lot more work.
I:
A: I: A:
Because utilitarian believers hold practical views of mathematics they tend to be based on known algorithms and numerical approaches on their working in mathematics. When Andy tries the problem he doesn't write anything on the given piece of paper; he is working the whole time in the calculator instead. And when he finds a pattern for the solution he can't move on and says "I can't see how to prove that they all are [divisible by 11]". He finally admits that A:
I just didn't know what you wanted me to do. […] Uhm, I prefer it gives me something I can do this to it, something to get the head on.
We suggest that it is his "utilitarian" beliefs about mathematics that drive him to work solely with his calculator and he neither works systematically in search of a pattern, nor relishes the exploratory nature of the problem. DISCUSSION In the above illustrations of the three distinct categories of macro-belief systems we can observe a relation between students' expressions of conceptions of mathematics and their engagement in a mathematical problem. This same general match between the espoused belief and the student's behaviour can be seen in all the students who participated in the study, suggesting we have a sound basis for the postulating that knowledge of students' systems of macro-beliefs can be a medium for predicting their mathematical behaviour. In the case of a "systematic" believer, such as Katherine, a synopsis of micro-beliefs includes mathematics being systematic and methodical and mathematical exercises following a series of logical steps, which were used in previous exercises. This, along with her successful previous mathematical experiences while approaching a task by using subsequent valid steps, results in her idiosyncratic way of approaching the palindrome question by trying to apply numerical and then algebraic steps but without making all the necessary connections among them in order to have a successful strategy of solving the problem. For the "exploratory" believer Lara, her micro-beliefs of mathematics being a problem-solving activity of challenge, exploration and the search for meaning influence the way she approaches the problem first by assigning meaning to the given question and second by considering more than From Informal Proceedings 21-1 (BSRLM) available at bsrlm.org.uk © the author - 17
Rowland, T. (Ed.) Proceedings of the British Society for Research into Learning Mathematics 21(1) March 2001
one approach to it. Finally Andy, an example of a "utilitarian" believer, whose views about mathematics are summarised as mathematics being a subject related and used by other subjects with exercises that are straightforward and easy to do if you have done some practice, finds himself in a difficult situation when faced with a problem he has never seen before and does not know how to approach, apart from trying some examples in his calculator. Although the observations of this research are focused only in a short instance of students' mathematical behaviour, interesting findings emerged concerning the interrelation between students' affective expressions and their tendencies to respond in a mathematical problem. In some cases, "systematic" and "utilitarian" learners the macro-beliefs about mathematics they hold hinders the development of polymorphous and flexible styles of working in a mathematical environment, a finding that accords with Schoenfeld's (1989) exploration of students' beliefs and behaviour in mathematics. As Daskalogianni and Simpson (2000) have noted in a previous paper, students' "predisposition becomes activated in a mathematical task and influences their cognitive processes and consequently their mathematical behaviour while working in it." (p.223). The question raised, of course, is how can we challenge and enrich students' existing macro-belief systems order to ameliorate their performance in mathematics? REFERENCES Daskalogianni, K. and Simpson, A.: 2000, "Towards a definition of attitude: the relationship between the affective and the cognitive in pre-university students", in T. Nakahara and M. Koyama (Eds.), Proceedings of the 24th Conference of the International Group for the Psychology of Mathematics Education, Vol. 2, Hiroshima, Japan, pp. 217-224. Lester, F. K., Garofalo, J. and Kroll, D. L.: 1989, "Self-Confidence, Interest, Beliefs and Metacognition", in D.B. McLeod and V.M. Adams (eds.), Affect and Mathematical Problem Solving, (pp. 75-88). New York: Springer-Verlag. McLeod, D. B.: 1989, "Beliefs, Attitudes, and Emotions: New Views of Affect in Mathematics Education", in D.B. McLeod and V.M. Adams (eds.), Affect and Mathematical Problem Solving, (pp. 245-258). New York: Springer-Verlag. Mason, J., Burton, L. & Stacey, K.: 1982, Thinking mathematically. London: Addison-Wesley. Rokeach, M.: 1975, Beliefs, Attitudes and Values. San Francisco: Jossey Bass Publishers. Schoenfeld, A. H.: 1989, "Explorations of students' mathematical beliefs and behavior". Journal for Research in Mathematics Education, 20 (4), pp. 338-355. Strauss, A. & Corbin, J.: 1998, Basics of Qualitative Research. London: Sage Publications. From Informal Proceedings 21-1 (BSRLM) available at bsrlm.org.uk © the author - 18
Rowland, T. (Ed.) Proceedings of the British Society for Research into Learning Mathematics 21(1) March 2001
DEVELOPING A VYGOTSKIAN PRACTICE IN MATHEMATICS EDUCATION Chris Day Cheadle Hulme College This paper introduces some problems encountered during my research, which was based on a Vygotskian, Activity Theory approach to the teaching of mathematics. It attempts to focus attention on the dialectical complexities of practical problem solving activity. INTRODUCTION
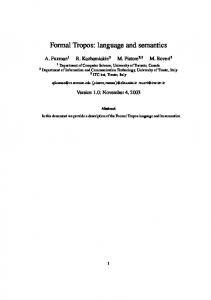
When the man in this picture looks into the mirror his image appears to be reversed from left to right. This is a pragmatic model of his activity. Pragmatic theory has been advocated by a wide range of prominent theoreticians (such as Dewey, Bruner, Piaget or Habermas) and will be familiar to most readers. The best pragmatists realise the limitations of their theories, however, and as Ricco has put it: "There is no claim that conceptualisations are separable from matters of fact and thus might constitute true or false representations of 'real' facts in the world. The claim is only that it is useful to think of the matters of fact from within these conceptualisations. The utility of theories or models, however, is a thoroughly empirical question." Ricco (1993 p142). The man above is not reversed from head to toe, for example, although light rays are unaffected by gravity and as we can see, the left/right reversal does not happen to this fish.
I will present some brief examples from my research to illustrate problems, which can arise when we try to develop such practical understanding in mathematics classrooms. DIALECTICAL LOGIC Investigating the reflection problem further would be an exercise in dialectical logic. An apparent contradiction leads us to re-examine the theory that mirrors only From Informal Proceedings 21-1 (BSRLM) available at bsrlm.org.uk © the author - 19
Rowland, T. (Ed.) Proceedings of the British Society for Research into Learning Mathematics 21(1) March 2001
transform images from left to right. From the perspective of dialectical logic, a thought directed to the immediate goal of explaining a reflection in a mirror is necessarily accompanied by a thought about that thought in terms of the nature of reflections in general. In this way we can move towards a deeper and therefore more truthful understanding of reflections in mirrors. The new understanding affects or mediates how we look at other similar problems. This mediation is carried out by means of speech and other semiotic objects and perhaps the key difference between Piagetian and Vygotskian theory concerns the importance attributed to the notion that the form of objects changes within language. While Piaget considered language unimportant, for Vygotsky, language was the key attribute separating humans from animals. LINGUISTIC TRANSFORMATIONS AND FLUENCY One important aspect of semiotic mediation is the fluency of the linguistic transformations that we carry out. Russian research (Talyzina 1981) suggests that fluency depends upon the amount of abbreviation the verbal actions have undergone and determines the ease and the speed of their execution. Fluency is especially important because it also determines how much will be remembered in the longer term. MEDIATION THROUGH FORMAL AND DIALECTICAL LOGIC The nature of the relationship between this mediational activity and material activity is itself an important and complex factor in human activity. Davydov (1999) has described two types of transformation that take place in the creation of the new ideal images that people form to guide practical activity. These are external and internal transformations and are differentiated in terms of a notion of essence. Those changes that relate to an object externally are concerned with the notion of essence as described in formal Kantian logic. In this system, the essence of an object is just something it has in common with other similar objects. Equations, for example, would be seen as essential elements of mathematics. Within this perspective, fluency in transforming equations could become a central goal for teachers and the practical relevance of the work could be ignored. My first example of difficulties arising during the introduction of Vygotskian theory into mathematics teaching concerns problems arising from a traditional tendency to use overly formal and abstract teaching methods. A teacher from School 2 in an experimental teaching program I recently carried out was a specialist in Mathematics and was responsible for the teaching of mathematics in the school. This specialist mathematics teacher decided to move prematurely away from material examples given in the research program to more abbreviated abstract operations on symbols. This caused problems because important information was left out which made his examples meaningless.
From Informal Proceedings 21-1 (BSRLM) available at bsrlm.org.uk © the author - 20
Rowland, T. (Ed.) Proceedings of the British Society for Research into Learning Mathematics 21(1) March 2001
The teacher began a lesson with a series of examples he had prepared. He wrote a number of sets of symbols for rate such as V1, V2, V3 on the board and asked how, for example, Vo (overall rate) could be found from them. He was attempting to develop fluency of mathematical actions separately from their material origins. This caused some concern to the children because no contextual information was given. He did not indicate, for example, whether addition or subtraction actions were necessary. I passed him a note and he quickly readjusted his questioning in line with the ethos of previous lessons. When this was done answers came steadily and mostly correctly from the class. Some of his examples were wrong, however, and were not corrected. For example: "One man walks at a speed of 5 miles per hour and a second walks at a speed of 7 miles per hour. Their combined speed is 12 miles per hour." The speeds are clearly not additive in this example. Dialectical essence, on the other hand, is a universal relation that traces a mediating object back to its social origins. It is a law of development of any system rooted in human activity. Formal logic constructs classifications in order to orient a person in future practical activity. Rearranging the existing order of things in formal logic is then extended when rearranging them in terms of dialectical essence. In dialectical logic it is also necessary to relate these objects to an essence which gives birth to all the terms that are only described abstractly in formal logic. This activity releases the practical potential of an object of study and we are then in a position to change it. My second example refers to some classroom practice carried out naturally according to the logic of dialectical essence. The teacher from school 3 of the same teaching program was keen to make connections between material reality and algebraic symbols. Teacher: (Writing on the board as he is talking) "If Jim and I have 25 apples, together. Jim has 12. How many have I got?". "Nice and simple, isn't it. What value is this? .. So = 25 .. S1 = 12 .. I need to find S2, don't I? You can work it out in your head .. the value is 13 .. but how do you get it? Its So - S1 isn't it. .. yes. Some of you are messing this up. Its so easy isn't it .. on the first question .. I know some of you have got it. Then some of you are messing it up on question three. It really is that simple. Think about it. Its not hard."
In this example symbolic mental actions involving thoughts such as such as S1 and S2 introduced in the teaching program were fluently combined with more concrete notions of apples belonging respectively to Jim and the teacher. By moving fluently from the general to the particular in this way, the teacher connected the formal notions with their essence in practical relations between people.
From Informal Proceedings 21-1 (BSRLM) available at bsrlm.org.uk © the author - 21
Rowland, T. (Ed.) Proceedings of the British Society for Research into Learning Mathematics 21(1) March 2001
GENERALISATION My final example of problems arising during my attempts to develop a vygotskian practice in mathematics education concerns another important notion in the development of dialectical understanding. The degree of generalisation is determined by the extent to which an action is distinguished from other similar objects. In this example the notion of rate of pumping water is being generalised by applying it to a similar practical situation involving children running. The following extracts from a video transcript will illustrate some difficulties that can arise in a mathematics classroom when more complex practical problems are generalised in this way. My example involves a class teacher who was a specialist in Information Technology and a keen amateur actor. He clearly had problems understanding some of the ideas we were introducing. The problems which arose within the substantive mathematical content of more complex problems would suggest that while a non specialist mathematics teacher might be less resistant to the practical nature of the innovation presented in this program, training in the new dialectical techniques of mathematical education will be an important requirement. Khalid, a student from schoo1 in the program, has written a problem for the class to discuss: "Two boys run towards each other. The first runs at speed V1 and covers distance S1. The second runs at speed V2 and covers distance S2 before they meet. How long did they run for?"
(Khalid returns to his place and Ranjit sits down in the swivel chair) Teacher:
"Um .. put down the bits. .. What do you know?"
(Ranjit begins her solution): Teacher:
"Right, so we've got a V1. You've got an S1, from which you can find T1 .. yes .. and why not. So that's how long the first boy was running. We know his speed. We know how far he went .. so we can get how long it took him."
Teacher:
"Now .. second person .. we know his speed and we know how far he ran .. so we'll know how long it took him. You are now about to trip up over your shoe laces."
The teacher has seen Khalid's alternative solution and assumes Ranjit is going wrong. (Ranjit completes her solution):
From Informal Proceedings 21-1 (BSRLM) available at bsrlm.org.uk © the author - 22
Rowland, T. (Ed.) Proceedings of the British Society for Research into Learning Mathematics 21(1) March 2001
There are a number of unclear parts to this question. If the boys did not start and finish together, so that T1 and T2 were different, the time they were running could be seen as the time of whoever started first. If they did start and finish together the time running would be the same for each. ⎞ ⎛ S1 S 2 = = T1 = T 2 = To⎟ ⎜ ⎠ ⎝V1 V 2
In either case Ranjit's answer would be correct since she does not suggest adding the two times together. (She may have been tempted to carry this out if she had been asked how to find To). Teacher:
"Now .. the point is .. let's just think about this ..stand up Ranjit .. by that door .. just to show you where this problem becomes difficult .. in terms of real time .. Ranjit starts running towards me (general laughter). She covers the distance .. to there in .. what .. three seconds. So run to there please. Right .. so .. that's how long it's taken her. At the same time I'm running towards her (general laughter). We collide, but .. go back to where you were .. that's all right. She took this long and I took this long. Wait a minute .. Go! (They run towards each other again amid general laughter) ..bumf .. right .. so what .. it didn't take that amount plus that amount did it? It took ..however long the whole thing was .. which is not quite the same."
The teacher has constructed a situation in which the actions do actually start and finish together and thus demonstrates that he has missed the point of Khalid's example. He is thus unable to be part of the zone of proximal development that Khalid was attempting to establish. He is aware of the need to clarify things, however and calls upon Khalid to give his solution to the problem, perhaps partly to give himself time to think. Teacher:
"The amount of distance we covered is that distance plus that distance. Our combined .. our impact speed is her speed plus my speed, but the time we took is not the time Ranjit took and the time that I took. Its a different concept. So its not really To. Its how long did they run for .. its not exactly what we found out. That's why I say you are going to trip over your shoe laces."
Teacher:
"In the green corner Khalid has seen the solution to his own problem. Off you go ..(laughter) .. you and your big mouth Khalid."
Khalid puts in his solution. He has arranged the diagram to find So and Vo directly from their components: Khalid's solution does not actually fit his question. He appeared to be looking for a problem like the ones on rate of pumping in the worksheet he had been working on and which could have ended:
From Informal Proceedings 21-1 (BSRLM) available at bsrlm.org.uk © the author - 23
Rowland, T. (Ed.) Proceedings of the British Society for Research into Learning Mathematics 21(1) March 2001
"How long would they have taken to cover this distance, running at these speeds, if they started and finished together?"
This question would have led to the answer: ⎛ S1 + S 2 ⎞
⎜ ⎟ = To ⎝V1 + V 2⎠
Since they started and finished together in is question, To and T1 are equal and so both answers are correct. Teacher:
Right ..excellent! .. so .. the approach then .. If you want to find To .. you've got to find Vo and So .. then you can find To. (Points to Ranjit's solution). That looks totally logical ..but it doesn't actually find us To .. because of this thing about time.
The complexity Khalid wanted to introduce into his problem thus uncovered a serious lack of clarity in the teacher's own understanding. CONCLUSION In this presentation I have viewed dialectical logic, not simply as a system of subjective laws, but as a developing process of teaching and learning practice. In my view this involves more than thinking logically. It involves both the logical development of the science of teaching and learning and the reflection of the development of teaching and learning practice in thought. The discussion that follows my presentation will be part of this process. BIBLIOGRAPHY Davydov, V.V.: 1999, ‘The Content and Unsolved Problems of Activity Theory.’ In Engelström Y. Meittinen R. and Punamäki. R Perspectives on Activity Theory. Cambridge: Cambridge University Press. Ricco, R.: 1993, ‘Revising the Logic of Operations as a Relevance Logic.’ From Hypothesis Testing to Explanation: Human Development 36(3) 125-146. Talyzina, N. F.: 1981, ‘The Psychology of Learning.’ Theories of Learning and Programmed Instruction. Moscow: Progress Publishers.
From Informal Proceedings 21-1 (BSRLM) available at bsrlm.org.uk © the author - 24
Rowland, T. (Ed.) Proceedings of the British Society for Research into Learning Mathematics 21(1) March 2001
PUPILS' PARTICIPATION IN THE CLASSROOM EXAMINED IN RELATION TO 'INTERACTIVE WHOLE CLASS TEACHING' Hazel Denvir and Mike Askew Leverhulme Numeracy Research Programme King's College, University of London Longitudinal case study data are informing the different ways that pupils engage and manage their participation within the lesson. Drawing on observations of two children in the "mental and oral" starter of the Numeracy Lesson we develop the argument that, within the whole class sessions, pupils appear engaged with the mathematics in the way the teacher expects them to be while in fact they are engaged in other ways and for reasons other than interest in the mathematics. INTRODUCTION The Leverhulme Numeracy Research Programme (LNRP, e.g. Brown et al, 2000) is a longitudinal study of the teaching and learning of numeracy investigating factors leading to low attainment in primary numeracy in English schools, and testing out ways of raising attainment. It sets out to shed light on several aspects of mathematics in the primary school, including: •
knowledge of how classroom practices, including teaching methods, teaching organisation and curriculum influence standards of attainment;
•
understanding how schooling and social factors interact in the development of numerate pupils.
Our research has included collection of both quantitative and qualitative data. This present paper focuses on "critical incidents" , that is classroom episodes in which there is an opportunity for learning to take place or when such an opportunity is missed. Our concern with children's mathematical learning includes their attitudes, working practices and interest in numeracy. A key factor in the development of children's mathematical thinking is their engagement. The Mental and Oral Starter Our study began in September 1997 and the National Numeracy Strategy (NNS) was implemented in schools in September 1999. Since that time the teaching of mathematics in English primary schools has been affected profoundly: Few schools at the time of writing do not follow the form and content set out in the NNS document 'Framework for Teaching Mathematics". A central tenet of the NNS is the need for increased emphasis on ‘interactive whole class teaching’. All mathematics lessons are expected to begin with a ten minute ‘oral and mental’ starter, where the whole class joins in activities that usually require everyone to show answers (through, for example, use of digit cards or individual white boards) or require that individuals respond to questions posed. The end of each From Informal Proceedings 21-1 (BSRLM) available at bsrlm.org.uk © the author - 25
Rowland, T. (Ed.) Proceedings of the British Society for Research into Learning Mathematics 21(1) March 2001
lesson is also expected to have a whole class ‘plenary’ which may also involve question and answer interactions about the lesson. Our observation of some 150 lessons over the past year show that the main part of lessons, between ‘starter’ and ‘plenary’, also frequently includes a substantial element of ‘public’ answering of questions. The use of questioning is promoted as a major teaching tactic: there is also strong encouragement for lessons to have ‘pace’ and much of the whole class work that we have observed places emphasis on speed as well as correctness. Thus a strong ‘performative’ element of being able to produce correct answers to closed questions and appropriate explanations is entering into English primary mathematics lessons. The characteristic behaviours that children develop in order to be seen to participate in such sessions are likely to affect learning outcomes and is the focus of this paper. THEORETICAL BACKGROUND Our theoretical starting point for examining the sort of learning that might arise through such whole class sessions is analysis of pupils 'participation in sociocultural activities' (Rogoff, 1994). Working together in the whole class ‘mental and oral starter’ provides a microcosm ‘community of practice’ (Rogoff, 1994). Coffield (1999), discussing post 16 education and arguing for a social theory of learning sees learning as located in social participation and dialogue as well as the heads of individuals; and it shifts the focus from a concentration on individual cognitive processes to the social relationships and arrangements which shape, for instance, positive and negative 'learner identities... (p. 493)
To explore more deeply our notions of participation we draw on data for two case study children now aged seven years: Meg and Oscar. Through this case study data we seek to elaborate the notion of participation and, in particular, to ask: how do pupils present themselves during whole class sessions? what motivates pupils’ to take part? is it fruitful in terms of mathematical learning? MEG Episode 1. As part of a whole class session, the teacher is working on halving numbers. Each child has an individual white board and marker pen with which to display answers. Teacher:
Half of 36?
From Informal Proceedings 21-1 (BSRLM) available at bsrlm.org.uk © the author - 26
Rowland, T. (Ed.) Proceedings of the British Society for Research into Learning Mathematics 21(1) March 2001
Meg starts to lift her board up to show the teacher. She has written ‘15’, but before she shows it she notices that others around her have ‘18’. She quickly changes it; the teacher does not notice and says, ‘Well done, Meg.’ Teacher:
Half of 72
Meg puts on an act. She takes the top off her pen, pushes it back again and looks puzzled. She appears to be counting - her lips are moving but it is not clear what she is saying. She turns round and sees what George has written then turns back again and wrinkles her face (as if to say, ‘I'm concentrating hard’). Then she looks around at several boards and see what answer others have got. Next she closes her eyes and screws up her face. After a time her face lights up as if she’s just made a big discovery and she writes down ‘36’.
Episode 2. The teacher is using a counting stick (metre length rod, with ten divisions but no number marked) to count on from zero in 10s, 5s, 2s going up to 100, 50 or 20 respectively. The children each have a number fan to show their answers. From the way that Meg looks at the rod and nods her head, it seems that she relies a lot with the higher multiples on counting from zero (as opposed to, say, knowing that when counting in 5s the other end is 50, so the ninth mark must designate 45). She is often still searching for the two digits on her fan with which to show her answer when the teacher has moved on to the next question. After two counting on in 10s questions (where Meg was not quick enough to show her answer) the teacher changes to counting in 2s. She points to the 8th division and asks for its value. Meg, again, repeats her nodding and looking at the divisions from zero, notices that the boy sitting next to her has set his fan to show 16. She stops counting on and puts out 16. The teacher then points to the 9th division. Meg nodding and counting from zero, puts out 18 on her fan, the teacher asks her how she got the answer. Meg:
You count in ones to nine and then go backwards and then its like double again.
Teacher:
Meg is using what we did last week, like doubling and halving.
While it is possible that Meg was multiplying by 2 her actions suggested otherwise. Once she had counted along to the number she went straight to showing it on her fan, that is that she arrived at the answer by counting on in twos. There was little suggestion that she was carrying out any operation on a number such as counting along to nine and doubling it. If she had realised that she could get an answer quicker by doubling it is not clear why she talked about "counting in ones to 9" or "going back".
From Informal Proceedings 21-1 (BSRLM) available at bsrlm.org.uk © the author - 27
Rowland, T. (Ed.) Proceedings of the British Society for Research into Learning Mathematics 21(1) March 2001
It seems that Meg is not trying to explain her method but only striving to take part in the ‘game’ of providing an explanation. Time and again, we have observed Meg produce post hoc explanations which do not match what she did but are sometimes not even mathematically correct (add on 9 by adding on 10 and taking off 6). She can do it with great conviction, and even present it in a way that covers up the nonsense. It is not that she is not capable of invoking a learning orientation. On those occasions where she has been encouraged to slow down and think about the mathematics rather than investing her energy to convince others that she knows it all her delight at succeeding is palpable. She often resists admitting that she might need help on. In another incident when she was attempting to shade one quarter of various rectilinear shapes drawn in her book she protested that questions from the researcher were making her terribly confused, rather than saying that she wasn't sure about the work. But when asked if she would welcome some help she looked both pleased and interested, listened carefully and seemed to take on board intelligently the suggestions offered. What motivates Meg when she is relating to the teacher, here and in other examples, is her status. Throughout the four years that we have been observing Meg, her teachers say she is able, hardworking and reliable. Meg strives to continue to appear like this to the teacher. In relation to other children, Meg behaves differently, enjoying having power and some control over them. In one incident, having been entrusted with a set of cards for a fraction game for her group, she insisted they all sit still and quiet while she, playing ‘teacher’, took her time choosing who she would allow to set them out. OSCAR Episode 2 Oscar’s contributions to the whole class guess the number game. Oscar:
Is it lower than 100?
George:
Is it a three digit number? Yes
Teacher to Oscar: So is it lower than a hundred? Oscar says no and shakes his head. Oscar:
Is it above 400?
Oscar:
Is it below 450?
The teacher, after the number has been found, picks up on this and says that the questions were good until they knew that the number was between 400 and 450, and asks what might have further asked. Oscar:
Is it above 410?
Teacher:
Or is it between 410 and 430?
From Informal Proceedings 21-1 (BSRLM) available at bsrlm.org.uk © the author - 28
Rowland, T. (Ed.) Proceedings of the British Society for Research into Learning Mathematics 21(1) March 2001
As children leave the carpeted area to go to text book tasks, Oscar tell me he is in blue group and that he and George are best at maths in that group and ahead even of Harry.
Oscar seems to like being fairly unobtrusive in the classroom and keeps a low profile, offering 'safe' answers and, unlike Meg, sticking with 'Don't know' rather than risking an incorrect response when asked to describe his strategy. Initially he was identified by his teacher as 'average' in mathematical attainment. He used to work quite slowly, taking his time, capable and proficient. Now he works in the same group as George, identified as higher attaining throughout. George and Oscar spend time together as a pair both inside and outside the classroom. The friendship with George is very important to Oscar and this maybe the reason for the culture of speed and competitiveness which is creeping into his work and which prompts him to fall back on getting the answers from George. His desire to maintain his position in the class as George's friend seems to compete with his inclinations to work slowly and steadily. DISCUSSION In the examples quoted above these three children, like many more we have observed in visits to classrooms are participating collectively in the mental and oral starter. Yet, although the teachers set up activities to involve everyone and monitor participation, the ways in which particular pupils manage their involvement and what motivates them to engage with the activities will vary from individual to individual. As Claxton (1999) points out, the ability to learn in a flexible way in our current age of uncertainty needs to emphasise the importance of engagement rather than 'ability'. But, as the examples demonstrate, the reasons that children engage with activities may be far removed from enthusiasm to engage with the mathematics. Pollard and Triggs, et al. (2000) provide an example of this in their case study of four to seven year olds found that: children had only a vague idea of teachers' instructional objectives. Rather than engaging in some synergetic process between teacher and pupil to extend existing understanding, most children were simply concerned to do what they needed to do to avoid being embarrassed or told off or having to do the work again. We found that children felt pressured by classroom constraints to develop task engagement. (p. 302-303)
Pollard also finds that it is ‘necessary to facilitate emotional engagement as well as intellectual challenge’ (Pollard with Filer, 1996), an issue explored in detail by Goleman (1998). Part of the emotional engagement will rest upon maintaining a successful ‘presentation of self’ (Goffman 1959) and may well be a ‘necessary precondition of stable engagement with learning’ (Pollard with Filer, ibid. p310.) These examples support the idea that when children participate in whole class interactive teaching in mathematics they may not be participating in the mathematical thinking which is intended. This arises from other motivations than the desire to learn. From Informal Proceedings 21-1 (BSRLM) available at bsrlm.org.uk © the author - 29
Rowland, T. (Ed.) Proceedings of the British Society for Research into Learning Mathematics 21(1) March 2001
The emphasis on whole class interactive teaching does seem to be connected with the notion that all children should participate in shared discussions of mathematical ideas. A major concern is that the strong "performative" element referred to above prompts children to adopt classroom behaviours which mitigate against them developing good habits as learners. In order to examine in more detail what value children derive form their mathematics lessons we are seeking to distinguish between participation and engagement. Our examples show that Meg, Oscar and George are all participating in the activities of the classroom but not necessarily engaging with the mathematical thinking which the teacher intended when she planned the lesson. The model of engagement that we are developing extends earlier work (Askew et al 1999) and draws on Earle et al's (2000) model of improving performance. REFERENCES Askew M , Denvir H, Rhodes V & Brown M (1999). Numeracy practices in primary schools: towards a theoretical framework. BSRLM Annual publication Brown, M., Denvir, H., Rhodes, V., Askew, M., Wiliam, D. & Ranson, E. (2000) The Effect of Some Classroom Factors on Grade 3 Pupil Gains in the Leverhulme Numeracy Research Programme. Proceedings of the Annual Conference of the International Group for the Psychology of Mathematics Education, Hiroshima (July 2000) Claxton, G. (1999) Wise Up: The Challenge of Lifelong Learning. London: Bloomsbury Coffield, F. (1999) 'Breaking the consensus: lifelong learning as social control', British Educational Research Journal, 25(4), 479 -500 Earle, L.; Fullan, M.; Leithwood, K.; Watson, N.; with Jantzi, D.; Levin, B. & Torrance, N. (2000). Watching and learning: the OISE/UT evaluation of the implementation of the national literacy and numeracy strategies. Toronto: Ontario Goleman, D. (1998) Working with Emotional Intelligence. London: Bloomsbury. Goffman, E. (1959) The Presentation of Self in Everyday Life. Garden City, NY: Doubleday. Pollard, A. (1985) The Social World of the Primary School. London: Cassell. Pollard, A with Filer, A. (1996) The Social World of Children's Learning: Case Studies of Pupils from Four to Seven. London: Cassell. Pollard, A. and Triggs, P. (2000) What Pupils Say: Changing Policy and Practice in Primary Education. London: Continuum. Rogoff, B. (1994) 'Developing Understanding of the Idea of Communities of Learners' Mind, Culture and Activity, 1(4), 209 - 229.
From Informal Proceedings 21-1 (BSRLM) available at bsrlm.org.uk © the author - 30
Rowland, T. (Ed.) Proceedings of the British Society for Research into Learning Mathematics 21(1) March 2001
TRAINING NON-SPECIALISTS TO TEACH NUMERACY Susan Hogan Open University This paper explores the challenge of developing a whole school numeracy strategy involving all staff (including non-teaching staff) of a secondary school for boys with emotional and behavioural difficulties. The first stage is to test all pupils for numeracy. The second stage is to place all pupils in 3 bands and set targets for each band. Thirdly, the aim is to begin numeracy sessions, initially of 20 minutes twice a week. This paper will outline possible approaches to preparing staff for the delivery of the numeracy programme. ‘TRAINING’ VERSUS ‘TEACHING’ The words ‘training’ and ‘teaching’ are interchangeable as dictionary definitions yet each holds different connotations. ‘Teaching’ implies guidance towards a greater level of knowledge and understanding; ‘training’ implies demonstrating “how to” acquire a new skill – it is more directive than teaching. Anyone who has studied the management of change in schools, will know that effective change results from including participants in the decision-making process (Everard and Morris, 1990). In this way each person feels part-ownership of the project. Any attempt to impose change within an institution will meet resistance unless there is general agreement on the need for the initiative. Therefore, it is better to attempt to reach a degree of consensus at the planning stage. Writing about the role of Learning Support Assistants in the mathematics classroom, Watson states: “…non-specialist teachers and LSAs, whose own experience of mathematics might be of techniques and procedures, and associated fears or failures, cannot automatically see ways in which the support they so ably offer in other subjects can be given in mathematics. The temptation is to resort to demonstrating how to do things rather than using adult-pupil interactions which allow more sophisticated knowledge to develop.” (Watson, 2001, p.2)
Houssart (2001) raised the important question of “what LSAs need to know in order to best support children in mathematics lessons and how they can be helped to gain such knowledge and understanding.” (Houssart, 2001, p.14)
Houssart goes on to answer that training is necessary for LSAs to encourage children to make use of calculation strategies. Both researchers identify a need to involve LSAs in a teaching capacity. Therefore, why can they not be taught to teach numeracy? The term training was chosen in From Informal Proceedings 21-1 (BSRLM) available at bsrlm.org.uk © the author - 31
Rowland, T. (Ed.) Proceedings of the British Society for Research into Learning Mathematics 21(1) March 2001
response to the needs and desires of the staff driven by their status as nonmathematicians and expressed anxiety (even refusal to participate). NUMERACY The term ‘numeracy’ is used so frequently that there appears to be a consensus of opinion on what it means. However, a working definition is hard to find. The National Numeracy Strategy produced a necessarily detailed definition: “…the proficiency in number that involves a confidence and competence with numbers requiring an understanding of the number system, a repertoire of computational skills and an inclination and ability to solve number problems in a variety of contexts.” (DfEE, 1998)
To adapt this to a working definition, a numerate person understands number, computes and solves problems, which aggregates to a facility with number. The dictionary definition: “an acquaintance with the basic principles of mathematics” (OED, 1982)
is not strong enough (the numerate would be more than just ‘acquainted’) and lacks clarity (what are the basic principles of mathematics?). The aim within schools should be to improve each child’s facility (ease) with number. In the act of scanning mathematics for its numerate aspects it is difficult to find any that have no relation to number. Therefore, the initial numeracy programme will be necessarily selective. Writing on Numeracy Recovery for young children, Dowker (2001, p.7) describes the 8 components of the scheme, which can be adapted for older children. A six week programme might cover the following aspects: 1. place value; 2. memory for number facts; 3. estimation; 4. word problems; 5. transference from concrete to verbal to numerical; 6. derived fact strategies for calculation. Take point 2. memory for number facts. The adult and child can play memory games, such as pairs. Multiplication cards (4x3) have to be matched to the correct answer card (12). This tests the adult’s memory as well as the child’s. However, any scheme must be suited to the particular needs of the pupils.
From Informal Proceedings 21-1 (BSRLM) available at bsrlm.org.uk © the author - 32
Rowland, T. (Ed.) Proceedings of the British Society for Research into Learning Mathematics 21(1) March 2001
STAGES OF STRATEGY Questionnaire on learning styles At the pre-testing stage (February/March 2001) a questionnaire [1] was given to all (20) staff and (56) pupils at Boxmoor House School (an EBD school for boys) with the aim of determining each person’s predominant learning style, visual, auditory or kinaesthetic. It was hoped that the resulting information could be used to match staff and pupils with the same learning styles, although other factors, such as mathematical ability of pupil (which band) and member of staff and the affective (who gets on with whom) will also be considered. In fact, analysis of the data reveals a majority of visual learners amongst staff (79%) and pupils (45%) which is hardly surprising as human beings are essentially visual. The next largest group among pupils is kinaesthetic learners (24%) then auditory (19%). The rest were combination learners and one boy scored equally as visualauditory-kinaesthetic. The boys were interested in the results and adopted their style of learning quite seriously. Before introducing (or ‘selling’) the numeracy programme to them, further reference will be made to this data. Testing for Numeracy The QCA optional tests (available by March 31 2001) were chosen for KS3 on the advice of the county mathematics advisor. Only Year 10 will be tested in KS4 using a GCSE (OCR) non-calculator paper. The optional tests take the form of two 50-minute multiple choice papers and should be completed by the end of the spring term 2001. (Timing may be delayed due to staff shortages.) Banding From the test results 3 bands will be created such that the middle band (2) will be the largest and bands 1 and 3 smaller (a normal distribution). Targets towards improving numeracy scores (as given by the optional tests) will then be set for each band. It is anticipated that targets will be in the form of x percent of a band raising their score by y percent. All pupils will need to be retested (using the same tests) at the end of the summer term. Numeracy Programme The numeracy programme will be devised to reach the targets set and to meet the particular needs of the pupils in each band. However, the programme will also need to suit the staff who will be implementing it. That is why it is important to consider all factors when pairing child and adult. At the time of writing, all teachers, LSAs and care workers are involved in literacy sessions four mornings a week for 20 minutes each morning. This takes the form of listening to the child read, keeping a record of the book, how many pages are read and words for the child to learn. The only real difficulties that arise from this programme are when children are reluctant to read. In general, the participating adults perceive literacy to be less challenging to them than numeracy - many are unsure of what will be expected of them in a numeracy session. From Informal Proceedings 21-1 (BSRLM) available at bsrlm.org.uk © the author - 33
Rowland, T. (Ed.) Proceedings of the British Society for Research into Learning Mathematics 21(1) March 2001
Staff Training How do the managers of the programme ensure that each adult is confident about delivering it to their chosen pupil? It is a question of how best to present the initiative so that they feel able to meet a set of agreed aims. Staff will be more likely to accept the need for the initiative if they agree with its aims. However, they may still feel that they are not qualified to achieve such aims and that a mathematics teacher is the best person to deliver numeracy. It has already been mooted that the mathematics teacher and the I.T. teacher will teach the pupils in band 3 with the greatest difficulties. However, those in band one are possibly in greater need of an able mathematician to provide them with an adequate challenge. First Step The first step may be to invite the participants to share their fears and expectations with each other and the managers, who then have the opportunity to allay the majority of the fears and any false expectations. Reassurances need to be given that no-one will be asked to do anything about which they feel unhappy. If they are, the programme simply will not work. To be successful, the adults must feel that their actions will make a difference to the child’s understanding of number. Planning and preparation is the key. At this point the numeracy consultant for the local authority will become involved in explaining the National Numeracy Strategy to those unfamiliar with it. Once the aims and objectives of the Strategy are set out, the teachers with mathematical backgrounds can (through consultation) adopt the parts of the programme that are best suited to the needs of the pupils in the school. Second Step Initially, when considering the details of the school programme, the question is how to present it to the staff. Among the options are two extreme approaches. 1. To be entirely prescriptive and present the contents as a package with detailed instructions on how to teach each session to the children. 2. To take a laissez-faire approach and provide an aim for each session (eg. practise their times tables) and leave it to staff to decide how they will achieve this. In reality, the approach should be somewhere between the two extremes, although it is tempting to take a more prescriptive approach in order to guide the less confident adults. Training Requirements of Staff The inset should be tailored to the different training needs of the staff, in the same way that the numeracy programme should suit the needs of the pupils. Those adults with more mathematical knowledge will need less input and be able to take on the role outlined by Watson, developing the child’s knowledge through the quality of their interactions and interventions.
From Informal Proceedings 21-1 (BSRLM) available at bsrlm.org.uk © the author - 34
Rowland, T. (Ed.) Proceedings of the British Society for Research into Learning Mathematics 21(1) March 2001
Everyone will be given time to consider the objectives and content for each session, so that they are fully prepared. This is a luxury for most LSAs as they are usually in the same position as the pupils, moving between subjects, adapting to the differing demands of those subjects. Pupils like to know what they will be doing in today’s lesson but they are not usually told until they walk through the classroom door – the same can be said for LSAs. It is vital that LSAs and RSWs feel fully prepared for their new role. SUMMARY In setting out the task in terms of planning stages, the intention has been to break down the challenge of implementing the aims of a whole school numeracy strategy into manageable ‘chunks’. No conclusion has been reached on the ‘best’ approach to preparing staff. Instead, a strategy that aims to harness the existing skills and knowledge of each adult in an agreed programme, planned in consultation with staff, is seen as most desirable. POSTSCRIPT The follow-up to this paper will chart the progress of the school strategy and it is hoped that this will be reported in November 2001. ENDNOTE [1] Courtesy of Tom Harwood, learning consultant
REFERENCES DfEE: 1998, Implementation of the National Numeracy Strategy. London: DfEE. Dowker A.: 2001, ‘Numeracy recovery: a pilot scheme for early intervention with young children with numeracy difficulties.’ Support for Learning, 16, 1, 6-10. Everard B. and Morris G.: 1990, Effective School Management. London: Paul Chapman. Houssart J.: 2001, ‘Counting difficulties at Key Stage two.’ Support for Learning, 16, 1, 11-16. Watson A.: 2001, ‘Editorial.’ Support for Learning, 16, 1, 2-3.
From Informal Proceedings 21-1 (BSRLM) available at bsrlm.org.uk © the author - 35
Rowland, T. (Ed.) Proceedings of the British Society for Research into Learning Mathematics 21(1) March 2001
From Informal Proceedings 21-1 (BSRLM) available at bsrlm.org.uk © the author - 36
Rowland, T. (Ed.) Proceedings of the British Society for Research into Learning Mathematics 21(1) March 2001
IDENTIFYING DIFFERENCES IN STUDENTS' EVALUATION OF MATHEMATICAL REASONS Dietmar Küchemann and Celia Hoyles Institute of Education, University of London We report on responses of high attaining thirteen-year-old students to a multiplechoice geometry question (G3) that formed part of a written survey designed to test mathematical reasoning. We describe trends in the choices made and put forward some suggested reasons for these trends. INTRODUCTION A 50 minute written survey designed to test mathematical reasoning was administered in June 2000 to 2799 high attaining Year 8 students from 63 randomly selected schools within nine geographical areas across England. All the questions in the survey were developed over a period of three months, the starting point in each case being an issue concerned with proving, followed by a trawl of the literature around this issue and a search for relevant tasks in the curriculum. The survey contained 9 questions in all, of which two were in multiple-choice format, including the question that is the subject of this paper. CHOICES OF ARGUMENT TO EXPLAIN A CONJECTURE In question G3 (Figure 1, below), students were presented with a mathematical conjecture and a range of arguments in support of it (options A, B, C and D). They were asked to make two selections from these arguments--the argument that would be nearest to their own approach and the argument they believed would receive the best mark from their teacher. The question matches the format of the multiple-choice questions used by Healy and Hoyles (2000) in a survey of high attaining Year 10 students, though the current question offers fewer choices. As with the previous research, during pre-piloting the question was given to groups of high-attaining students in an open format during task based interviews with the researchers. We then collected a range of response-types that helped us to devise the choices presented in G3. Also, we made sure we presented pragmatic and more conceptual choices following Balacheff’s distinctions (Balacheff, 1988): Avril’s answer involves measuring, Bruno’s the use of some geometrical knowledge in a specific case, Chandra's involves a general, conceptual argument based on the introduction of parallel lines and knowledge of alternate angles and Don's provides a counter example based on an incorrect diagram. The question was deliberately couched in dynamic terms (“Point P can move …”) to invite students to adopt a dynamic approach. Fischbein (1982) suggests that this can be an effective way of accessing generality and of gaining insight, and option C (Chandra's answer) is similar to an approach that he recommends for tackling the angle sum of a triangle. Frant and Rabello (2000) also suggest that a dynamic From Informal Proceedings 21-1 (BSRLM) available at bsrlm.org.uk © the author - 37
Rowland, T. (Ed.) Proceedings of the British Society for Research into Learning Mathematics 21(1) March 2001
P
G3
In the diagram, A and B are two fixed points on a straight line m.
z˚ Point P can move, but stays connected to A and B (the straight lines PA and
y˚
x˚
PB can stretch or shrink).
m A
B
Avril, Bruno, Chandra and Don are discussing whether this statement is true: x˚ + y˚ is equal to 180˚ + z˚.
Avril's answer
Bruno's answer
I measured the angles in the diagram and found that angle x is 110˚, angle y is 125˚ and angle z is 55˚. 110˚ + 125˚ = 235˚,
I can move P so that the triangle is equilateral, and its angles are 60˚.
and 180˚ + 55˚ = 235˚.
So x is 120˚ and y is 120˚.
60˚
60˚
60˚
120˚ + 120˚ is the same as 180˚ + 60˚. So Bruno says it's true
So Avril says it's true
Chandra's answer
Don's answer
I drew three parallel lines. The two angles marked with a are the same and the two marked with a are the same.
I thought of a diagram where the angles x, y and z are all 170˚.
Angle x is 90˚+
170˚ 170˚
90˚
and angle y is 90˚+ .
So x plus y is 180 +
170˚
90˚
So in my diagram x + y is not equal to 180 + z.
+ , which is 180 + z.
So Chandra says it's true
So Don says it's not true
a)
Whose answer is closest to what you would do?
...........
b)
Whose answer would get the best mark from your teacher?
...........
Figure 1: Question G3 parts a) and b)
approach can be useful at an intuitive level and for forming conjectures (though they seem to argue that a static approach is needed for a formal proof). As mentioned above, students were asked to select the choice that was closest to their own approach, and then to select the choice that they thought would get the best mark from their teacher. Table 1 shows the distribution of choices for the total sample. It From Informal Proceedings 21-1 (BSRLM) available at bsrlm.org.uk © the author - 38
Rowland, T. (Ed.) Proceedings of the British Society for Research into Learning Mathematics 21(1) March 2001
Best mark
indicates that by far the most popular choices for own approach were A (40 %) and B (35 %), both of which are pragmatic and particular arguments, with only 10 % choosing the conceptual argument, C. On the other hand, 50 % chose C for best mark, which suggests that many of the students could Own approach appreciate the power of the conceptual argument, G3 A B C D other total even if they felt that they would not have been able A 0.08 0.03 0.01 0.00 0.00 0.12 to devise such an argument themselves. Broadly, of the students who opted for choice A, B or D for B 0.09 0.10 0.01 0.01 0.00 0.22 own approach, about a quarter (slightly more in C 0.18 0.17 0.08 0.05 0.00 0.50 the case of D) stuck with it for best mark and about a half abandoned it in favour of the conceptual D 0.03 0.03 0.01 0.04 0.00 0.11 argument, C. Most of those who chose C for own approach, stuck with it for best mark. A similar other 0.01 0.01 0.00 0.00 0.03 0.06 response pattern occurred with a parallel algebra total 0.40 0.35 0.10 0.11 0.04 1.00 question, and with the questions used by Healy Table 1: G3 - frequencies for own and Hoyles (ibid). The difference between the approach and best mark (N = 2799) distribution of choices for own approach and for 2 best mark was highly significant: χ = 1759.5, df = 16, p < 0.0001, perhaps not surprising given the large number of students involved, but nonetheless supporting the conjecture that students' conceptions of a proof can vary according to the question they are asked.
Rank
The relative frequencies for choice A, which involved measurement, and B, which involved the special case of an equilateral triangle, are also of interest. Overall, choice B was rated more highly than A, since more students chose B (22 %) than A (12 %) for best mark, even though A was more popular than B for own approach (40 % compared to 35 %). Thus whilst students might well resort to measurement as a way of generating data, there is perhaps some awareness that measurement provides an unreliable basis for justifying arguments in geometry, and that in this respect choice B is superior to A. Choice B might also have been Choice G3 preferred because it involves a constructive use of A B C D geometric knowledge. However, in one respect at least, A 4 7 96 0 1st can be regarded as superior to B: the essentially arbitrary position of the point P in the diagram used in A means that 81 0 5 2nd 30 the diagram can be treated as a ‘crucial experiment’ 11 3 7 3rd 61 (Balacheff, ibid) or as a generic example. This contrasts with the highly symmetrical case in B which might well 4 0 0 85 4th possess properties that do not always hold. The mathematics teachers of the students involved in the survey were also presented with question G3, and asked to mark each argument out of 10. These data provided us with the teachers' ranking of the choices A, B, C and D and these are shown in Table 2. As can be seen, there is a very clear
5
5
5
7
total 104
104
104
104
other
Table 2: G3 - frequencies for teacher rankings of choices A, B, C and D (N = 104)
From Informal Proceedings 21-1 (BSRLM) available at bsrlm.org.uk © the author - 39
Rowland, T. (Ed.) Proceedings of the British Society for Research into Learning Mathematics 21(1) March 2001
preference for C and a strong rejection of D. The ranking of A and B is not as clear cut, but the general preference for B over A matches that of the students. Gender differences in choices
0.50 Female
0.40 Male
0.30 0.20
Figure 2 shows the frequency of choices for own approach for girls and for boys 0.10 in the total sample. Clearly there are gender differences with girls showing a 0.00 A B C D other bias towards choice A, boys a (lesser) Figure 2: G3 - frequency of choices for own approach for girls (N = 1430) and boys (N = 1369) in total sample bias towards C and D. Gender differences in choices were statistically significant for own approach and for best mark, though the latter were less pronounced, especially with regard to choice C. It is possible, therefore, that of the students who appreciate the merits of choice C, more boys than girls are prepared to claim it for their own approach. However, there may well be other reasons for the differences, and they would seem to be worth further investigation, especially as similar differences occurred in the parallel algebra multiple choice question and with some other items in the survey. HOW THE STUDENTS EVALUATED THE ARGUMENTS PRESENTED There may be many reasons why students selected an argument for own approach and for best mark. To shed light on this, students were asked to rate the validity of each argument and to indicate how well they felt each argument explained the truth (or in the case of argument D, the falsehood) of the original statement. Validity rating Regarding validity, students were asked whether they agreed, didn't know or disagreed with these two statements, for each of the choices A, B and C: The answer shows you that the statement is always true The answer only shows you that the statement is true for some examples.
For choice D, students were presented with this single statement: The answer shows you that the statement is not true.
Students could achieve a total validity rating of 7 for the four choices, if they assessed each statement correctly. In the event, the mean validity rating for the total sample was less than 3. Table 3 shows the mean total validity rating for the four choices, for those students who chose A, B, C and D respectively for own approach (row X) and for best mark (row
Mean total validity rating Question
for students in total sample who chose
G3
A
B
X
2.75
2.54
C
D
other
for own approach
3.41
2.88
0.87
2.61
1.36
for best mark
Y
2.38
2.35
3.06
Table 3: G3 - mean total validity rating of all four choices, for students in the total sample who chose A, B, C or D, for own approach (X) and for best mark (Y) (N = 2799)
From Informal Proceedings 21-1 (BSRLM) available at bsrlm.org.uk © the author - 40
Rowland, T. (Ed.) Proceedings of the British Society for Research into Learning Mathematics 21(1) March 2001
Y). Those who chose C were generally best able to assess the validity of the choices as a whole, whether one considers those who chose C for own approach (who had a mean total validity rating of 3.41) or those who chose C for best mark (mean = 3.06). This is perhaps not surprising, but it lends support to the supposition that those choosing C tended to do so for sound mathematical reasons rather than just for some surface feature of the explanation. This supposition is further supported if one compares the mean validity rating of each choice, for all the students in the sample, with the ratings given by just those students who selected the particular choice for own approach and for best mark. Students who selected C, whether for own approach or for best mark, achieved a higher validity rating for that choice (mean = 1.02 and 0.80 respectively) than the students as a whole (mean = 0.62); on the other hand, those who selected any of the weaker choices (A, B or D), whether for own approach or best mark, achieved a lower validity rating for their choice than did the sample as a whole (the one exception was the mean for A, own approach, which was the same as for A, total sample). We hope to investigate whether the students who chose C in particular have any common characteristics, for example whether they performed in a distinct way on any of the other proof survey questions. All the students who completed the proof survey had also taken a baseline mathematics test, and we have examined the distribution of baseline scores. This does not suggest that the students who chose C performed any better than the others, so we have to look beyond general mathematical attainment to characterise this group. EXPLANATORY POWER For each choice, students were also presented with the statement, “The answer shows you why the statement is true” (or, in the case of D, “not true”). Students were given an explanatory power score of 1, 0, or –1 for each choice, depending on whether they agreed, didn't know, or disagreed respectively, with the appropriate statement. It is worth pointing out that, in contrast to the validity rating, this score is subjective, ie it indicates how highly the students rated the explanatory power of an argument, rather than how well their rating might match that of an experienced mathematician. The mean explanation score for the total sample of students was highest for choice C. At the same time, students who selected a particular choice, be it for own approach or for best mark, on average rated the explanatory power of that choice more highly than did the sample of students as a whole. These two findings would seem to convey rather different messages. On the one hand, it is encouraging that the conceptual argument is the one that is rated most highly; on the other hand, it is disappointing that students are perhaps not as objective about the merits of the choices as the differences between the own approach and best mark frequencies (Table 1) had lead us to believe. DISCUSSION These simple statistics suggest that there are substantial differences in student choices of argument that most closely matches their own approach and for best mark. A
From Informal Proceedings 21-1 (BSRLM) available at bsrlm.org.uk © the author - 41
Rowland, T. (Ed.) Proceedings of the British Society for Research into Learning Mathematics 21(1) March 2001
pattern in choices can be identified, with students showing a clear preference for pragmatic approaches for own approach and for a more conceptual approach for best mark. Similarly, trends can be identified where for example students who chose an empirical argument for their own approach switched to a conceptual argument for best mark, while students who chose the latter for own approach stayed with the same choice for best mark. These findings were however subject to gender differences where boys were more likely than girls to claim the conceptual argument for their own approach. Similar findings can be found in algebra, but with rather more uniformity in response than in geometry. There is evidence that students chose the more conceptual argument for best mark for sound mathematical reasons, although they might also have been influenced by surface presentation. It is worth pointing out that, despite the obvious drawbacks of using a multiple choice format, it allowed us to gather evidence about the more conceptual argument which we would not otherwise have obtained (it was clear from the interviews conducted during the development of question G3, that few of our Year 8 students would have generated such an argument themselves). Students who chose the more conceptual argument were also generally better able to assess the validity of all the arguments although these students were not necessarily better in general mathematics attainment. Finally, students generally rated the explanatory power of their choice of argument (whether for own approach or for best mark) more highly than did the other students, which suggests that understanding as much as generality was important to students. Interestingly, students also rated the explanatory power of the conceptual argument more highly than the other arguments, which is a cause of some surprise and optimism. ACKNOWLEDGEMENT We gratefully acknowledge the support of the Economic and Social Research Council (ESRC), Project number R000237777. REFERENCES Balacheff, N.: 1988, ‘Aspects of proof in pupils’ practice of school mathematics.’ In D. Pimm (ed.), Mathematics, teachers and children (pp. 216-235). London: Hodder & Stoughton. Fischbein, E.: 1982, ‘Intuition and proof.’ For the Learning of Mathematics, 3, 2, 918,24. Frant, J and Rabello, M.: 2000, ‘Proofs in geometry: different concepts build upon very different cognitive mechanisms.’ ICME9, Tokyo, Japan. www-cabri.imag.fr/ Preuve/ICME9TG12/ICME9TG12Contributions/BoliteFrantICME00t.html. Healy, L. and Hoyles, C.: 2000, ‘A study of proof conceptions in algebra.’ Journal for Research in Mathematics Education, 31(4), 396-428. From Informal Proceedings 21-1 (BSRLM) available at bsrlm.org.uk © the author - 42
Rowland, T. (Ed.) Proceedings of the British Society for Research into Learning Mathematics 21(1) March 2001
CO-LEARNING PARTNERSHIP: A WAY TO TEACHER DEVELOPMENT Razia Fakir Mohammad The University of Oxford, Department of Educational Studies The aim of this study was to explore teachers' learning in their classrooms by trying to create a co-learning relationship between teachers and a teacher educator. The study was conducted with three mathematics teachers in classrooms in Pakistan. Data was collected through maintaining field notes from the classroom observations, audio-recording conversations in pre and post observations and writing comments in reflective journals. The preliminary analysis uncovered issues of practicality and limitations of a co-learning relationship in teacher development in a real classroom context. A major question arose about the extent of equality in working together. INTRODUCTION The research reported here was carried out as a part of my doctoral study in the context of developing teaching in Pakistani schools. I worked as both teacher educator and researcher with three in-service mathematics secondary school teachers, who had resumed teaching after attending a two-month educational course at a university in Pakistan. The focus of my collaborative work with the teachers was to support them in developing their teaching as well as to investigate my own learning through the creation of a co-learning partnership. This paper suggests that in supporting a process of learning for both partners (teacher and teacher educator) there were issues relating to differences in knowledge and status between the partners leading to a power imbalance. THEORETICAL PERSPECTIVE Wagner first used the term 'co-learning' as a more interactive social approach for the educational research process, when he stated In a co-learning agreement, researchers and practitioners are both participants in processes of education and systems of schooling. Both are engaged in action and reflection. By working together, each might learn something more about the world of the other. Of equal importance, however, each may learn something more about his or her world and it connection to institutions of schooling. (Wagner, 1997, P. 16) The essential feature of the co-learning agreement is that all the partners are colearners-responsible for change or development in their respective roles. Jaworski (2000) extended the co-learning idea to the relationship between teacher and teacher educator, as well as teacher and researcher. Examining the interaction between the partners, under the co- learning agreement, she stated that the consequences of shifting roles (as co-learners) could be a growth of knowledge, although the educator and teachers would have different experiences, expectations and philosophical perspectives. However, the question remained about the extent of equality in making From Informal Proceedings 21-1 (BSRLM) available at bsrlm.org.uk © the author - 43
Rowland, T. (Ed.) Proceedings of the British Society for Research into Learning Mathematics 21(1) March 2001
decisions about such partnership and in acceptance of responsibilities of learning. In my position in which the teachers knew me as a teacher educator or an instructor of the university, or a doctoral research student, it was likely that the teachers would not recognise me as a learner in their context but an authority of knowledge or a problem solver. How could I establish a power balance agreement and environment of learning, where both participants could accept and recognise some kind of equality in the learning process? FINDINGS The findings presented in this paper are from one of the teachers' (Sahib) planning, teaching and evaluating a topic, with the teacher educator (myself) at his school. I shall use one lesson to show aspects of the learning in the developing partnership. Planning together: For this particular lesson, Sahib's focus of teaching was enabling students to solve equations in algebra by the textbook method, though he aimed also to involve the students to participate actively in their learning. It was not clear to me how Sahib would achieve this goal by the textbook method he described. I inquired about other methods of teaching equations from his experiences of learning of the topic. He recalled an activity involving a function machine that he had learned at the university, but he felt that it would be too advanced for the students at the moment because they might get confused with the terms of 'input', 'output' and 'function' of a machine. I asked him what other ways he might have of approaching the topic and achieving students' participation. He then suggested another idea of 'finding a hidden number' that could motivate the students to learn equations as well as guide them to learn a method to find unknowns in equations. He reasoned that as the children deduced the correct number, they would discover also a method to solve the equation and he could then teach the exercise given in the book for solving equations. Teaching the lesson: I was a participant observer, while Sahib was teaching the lesson. I maintained detailed field notes, and highlighted the issues significant to me in the teacher's teaching. Two issues appeared important. 1) Tension between the teacher's new expectations and the students' behaviour: In the lesson, Sahib told a story about a hidden number and wrote it symbolically on the board (? +5=6). He asked the students to find the hidden number in the box to get six, and they gave the correct answer. The teacher gave many similar examples and got answers (numbers) from the students. He then asked students to explain their mathematical thinking in deducing their answers but the students gave no response. Sahib offered them encouragement but did not succeed in getting them to explain. In my view, the tension occurred because the teacher had introduced a new expectation. Students were familiar with giving answers, but not with explaining their From Informal Proceedings 21-1 (BSRLM) available at bsrlm.org.uk © the author - 44
Rowland, T. (Ed.) Proceedings of the British Society for Research into Learning Mathematics 21(1) March 2001
thinking. They were not confident enough to express their thinking in words. The teacher also appeared to be in a rush; he was pushing the students to speak by using encouraging comments but not allowing them to take time to think and organise thinking into words. 2) Tension between the teacher's new role and prior identity: However, the teacher then changed his strategy and called the students to the board to express their thinking. Below I present a part of the conversation between the teacher and a student, in regard to the student's expression of thinking on the board and the teacher's response to it. Teacher:
Somebody has thought of a number, multiplied it by three, subtracted one and got five. Tell me the number he has thought of. (The teacher also wrote on the board, ? *3 -1=5
Student:
Two
Teacher:
How did you find it? (The teacher called that child to the board and asked him to write his method.
The student wrote on the board: 2*3=6 -1 =5 [1] The teacher encouraged the child to explain his thinking in words (as well symbols), but the student was silent. He also asked other students to explain in words what their friend wrote on the board. There was no response. The teacher then told the student: First, you added one to five and you got six on the other side. Then you divided six by three to get two. Working on the blackboard the student multiplied three by two first, getting six, and then subtracted one to get five; while Sahib explained the student's symbolic representation in another way. The teacher's interpretation might have affected the student's level of confidence; because after that example, none of the students offered their thinking process either verbally or in writing. For example, the teacher then gave another example of x * 4 -3 =5 and asked for the answer. One of the children said it was two but none of them then expressed a method to get the answer (symbolically on the board or verbally). In my view, the student had his own way of thinking but the teacher was not really trying to understand the student's way of thinking. Explicitly Sahib wanted the students to explore methods of solving equations themselves, but implicitly he had imposed his own method of solving equations. The reason could be a tension between reconciling new approaches to his teaching with his traditional approaches based on the text book. Evaluating teaching: In the feedback session when I asked Sahib about his reflection on the lesson, he reacted he was not very happy about the lesson. In Sahib's opinion, it was a very time consuming method to involve students and expect them to share their thinking. He said that if he taught the same lesson traditionally he would have finished the exercise From Informal Proceedings 21-1 (BSRLM) available at bsrlm.org.uk © the author - 45
Rowland, T. (Ed.) Proceedings of the British Society for Research into Learning Mathematics 21(1) March 2001
of the textbook. In my view, Sahib appeared frustrated because he thought that he could not achieve the students' level of participation as he had expected. I encouraged him to analyse positive aspects of his teaching with respect to his previous method of teaching and he then talked about further possibilities and outcomes of his effort to teach in new ways. He criticised the traditional method of teaching, as he said For example, the child (during the lesson) was standing [2] and thinking. He took time to think about the process himself. It does not happen in a traditional way of teaching. We do not give them chance to think for themselves. A teacher himself solves and tells them the method.
He stressed the importance of flexibility in lesson planning during the teaching, You saw I changed my planning during the lesson. It was difficult for the students to express their thinking verbally so I called them to the board. I also wanted them to discover a method of solving equations but then I explained it.
Sahib acknowledged possibilities and tensions in achieving a new way of students' learning; he talked about lack of environmental support in the school, The major problem is time and also motivation. Nobody encourages teachers' thinking about providing students with thinking time. The thinking time has value in long-term learning outcomes. I think, as they will get familiar with this way of teaching they will get more confidence.
Sahib also realised that it was an unrealistic expectation to achieve his goal immediately, as the students needed time and experiences of learning through new ways on a regular basis. He attributed the students' difficulty in expressing their thinking to a traditional mode of teaching which had not encouraged students' thinking, explanation and self-confidence. However, the following issue regarding a tension between the teacher educator's expectation and the teacher's behaviour arose. Sahib demonstrated a critical stance in analysing different factors that affected his success as a result of my questions and positive reception of his frustration. However, while teaching the lesson he had rephrased the student' answer according to his own method, which seemed to be different from what the child had presented. This was an important issue for me as a teacher educator relating to the teacher's understanding of his new role. I asked him about his different way of expressing what the student had written. Sahib reasoned that he wanted to teach a proper method. I wanted him to analyse this issue beyond the justification he made. He appeared uncomfortable with my further questions. I stopped then by saying that he could think later and share his writing with me. However, he concluded his learning of our working together in the following way: I cannot teach everyday according to the method I used today. I have to complete the syllabus. If I give more time for thinking then the problem of written work will arise.
From Informal Proceedings 21-1 (BSRLM) available at bsrlm.org.uk © the author - 46
Rowland, T. (Ed.) Proceedings of the British Society for Research into Learning Mathematics 21(1) March 2001
DISCUSSION: The above findings have pointed towards aspects of both the teacher's and the teacher educator's learning. The teacher learned about his teaching whereas the teacher educator learned about the roles in a co-learning partnership. I see the following aspects of this learning: Sahib's translating new ideas: In planning the lesson, Sahib was conscious of the school expectations, the students' needs and difficulties as well as his focus of teaching of solving equations. He considered all of them and adopted alternative ways to improve the quality of teaching and students' interaction and new possibilities of teaching occurred for him. In my view there were two factors involved in his learning: (a) my presence encouraged the teacher's recalling and reviewing of his new experiences at the university, (b) his presence at the school caused him to be realistic about his new teaching in order to reshape his learning according to the school limitations. Sahib's moving to and fro (New and previous teaching): What I found fascinating in Sahib's description in the feedback session was a contrast between his various perspectives of the lesson. In the beginning of his talk, he assessed the students' learning on the basis of their lack of response, and appeared frustrated. Then he acquired a critical stance of talking about valuing students' processes of thinking, which encouraged his confidence in his new practice. Sahib also seemed to be struggling between new ideas about students' learning, e.g. valuing students thinking time, while worrying about a system, e.g. lack of support and encouragement, that does not support such ideas for the teachers in the school. It could be said here that the teacher was trying to adjust his new pratice or modify the previous one through reflecting on their limitations. Teacher educator's learning: I experienced the value of my positive responses to Sahib's teaching in motivating the teacher's attitude, as well as a negative impact of pushing the teacher to explore the issues significant to me. I realised from his conversation that Sahib himself needed time to resolve tensions of his teaching and a positive reinforcement in order to gain confidence of his teaching at the initial stage of practising change. The question remains, was it fair to widen the teacher's perspective according to my own way of thinking, or was it my responsibility to do so? CONCLUSION: I conclude that a concept of equal acceptance of responsibilities and power was difficult to achieve in a short period of research. I made a deliberate effort to build confidence in sharing concerns and capabilities and in promoting development of respective roles. The commitment to be a learner encouraged the teacher educator to make an effort to reduce unseen imposition on her part. The responsibility of the teacher to be a learner at the school increased his confidence to choose his agenda, set limits and act accordingly. It could be said that the co-learning partnership supported From Informal Proceedings 21-1 (BSRLM) available at bsrlm.org.uk © the author - 47
Rowland, T. (Ed.) Proceedings of the British Society for Research into Learning Mathematics 21(1) March 2001
the teacher in exploring practical venues of developing teaching and identifying issues of practice leading to reducing a threat to self-esteem. Consequently I say that the power relationship exists in terms of status, knowledge and understanding of issues between the partners' respective roles, the responsibilities evolve as the relationship grows and needs emerge. Notes: [1] The way it appears in writing is mathematically wrong (since 2 *3 is not equal to 6-1) however, the child was clear in thinking while writing. He first multiplied and wrote the answer and then subtracted one from the product and got the result. [2] One of the norms of a classroom is that a student should stands when the teacher asks him or her for an answer.
REFERENCES: Jaworski, B.: 2000, ‘The Student-Teacher-Educator-Researcher in the Mathematics classroom: Co-learning Partnership in the mathematics teaching and teaching development’, Paper presented at the second conference of the Swedish Society for Research in Mathematics Education at the University of Gothenburg. Wagner, J.: 1997 'The Unavoidable Intervention of Educational Research: A Framework for Reconsidering Researcher-Practitioner Cooperation'. Educational Researcher, 26(7), 13-22.
From Informal Proceedings 21-1 (BSRLM) available at bsrlm.org.uk © the author - 48
Rowland, T. (Ed.) Proceedings of the British Society for Research into Learning Mathematics 21(1) March 2001
DOMAIN, CO-DOMAIN AND RELATIONSHIP: THREE EQUALLY IMPORTANT ASPECTS OF A CONCEPT IMAGE OF FUNCTION Elena Nardi School of Education, University of East Anglia Students' concept images of function often lack in understanding the concept as inextricably connected with its domain, co-domain and relationship. The impact of this on understanding properties such as 1-1 can be dramatic. Drawing on students' responses to a task involving the exploration of whether five given functions were 11, onto, both or neither, I discuss the following distinctive elements in their responses: A. use of graphs to identify properties of the function (from relying completely on the graph for mere identification of the property through to substantiating what the graph suggests with verbal explanations and uses of B and C) B. problematic uses of the formal definitions of 1-1 and onto C. effective use of properties specific to the functions in question (e.g. uniqueness of cubic root). The emphasis here is on B. Studies of perceptions of function that focus on difficulties the students encounter when they are asked to decide whether a given relationship or a graph represents a function (e.g. Barnes 1988) date back in the 1980s when this concept became a wellstudied area of upper secondary and tertiary mathematics education. In these studies (e.g. Dubisnky and Harel 1992), most students do not associate function with its Bourbaki definition - a correspondence between two sets which assigns each element of the first set to an element of the second set: when responding to mathematical problems students usually call upon concept images of function such as a formula, an algebraic relationship, an equation. As observed by Markovits et al (1986) this image is so dominant that it seems to exist at the expense of the equally important notions of domain and co-domain. Here I extend this discussion to include the study of properties of functions such as onto and one-to-one. The evidence on the learning of functions on which I draw here originates in a collaborative study conducted at the School of Education and the School of Mathematics (where my Research Associate, Dr Paola Iannone, teaches first year undergraduates). The study is funded by the Nuffield Foundation and is carried out in two phases. The first phase, regarding Calculus and Linear Algebra, lasted three months (October - December 2000). The second phase, regarding Probability Theory, is now in progress and will also last three months (January - March 2001). For the methodology and aims of this study see Note at the end of the paper. The mathematical question that I wish to discuss here (Question 2.3) was included in the problem sheet of Cycle 2 - fourth week of the students' first semester in the course:
From Informal Proceedings 21-1 (BSRLM) available at bsrlm.org.uk © the author - 49
Rowland, T. (Ed.) Proceedings of the British Society for Research into Learning Mathematics 21(1) March 2001
In his notes to the students and tutors for the course, distributed after the students' submission of their written responses, the lecturer suggests the following answers:
Here I am concerned with the students' responses to whether fi (i = 1, ...5) are one-toone and onto. As far as the last part of Question 2.3 (request for an example of a function that is onto but not one-to-one) is concerned, the students almost unanimously produced f(x) = x(x-1)(x+1), an example accidentally offered by the lecturer in the Question Clinic. As a result I consider this part of the data to be not valid. However a relevant observation on this part of the students' responses is that only a few offered justification for this choice of example. This justification was verbal (applying the definition for 'onto' and offering a counterexample for 'one-toone') or graphical (resorting to the graph of f for drawing a conclusion). I elaborate these and other issues in the following. The major issue that emerged from the scrutiny of the students' responses to Question 2.3 regards an apparent lack in emphasis in the students' understanding of the concept of function as inextricably connected with all three of the following elements: relationship, domain and co-domain. A concern that emerges from this issue is the impact that this lack of emphasis may have on the students' study of properties such as onto and one-to-one. The format of Question 2.3, as appearing in the Problem Sheet, suggests that this lack in emphasis may be partly of curricular origin: the requirement that fi are all defined from ℜ to ℜ appears on the first line. Then the five relationships follow. Is this format reinforcing what is known to be (e.g. FerriniMundy and Graham 1991) the students' strong association (identification?) of the concept of function with an algebraic expression of this sort? From Informal Proceedings 21-1 (BSRLM) available at bsrlm.org.uk © the author - 50
Rowland, T. (Ed.) Proceedings of the British Society for Research into Learning Mathematics 21(1) March 2001
The distinctive elements in the students' responses that I wish to discuss here are: A. Use of graphs to identify properties of the function: the students' responses varied from relying completely on the graph for mere identification of the property (relying on graphical representations for drawing inferences, but then not offering formal validation of their inferences, is a well-known characteristic of the students' reasoning at this stage - see, for example, Artigue and Viennot 1987) through to substantiating what the graph suggests
with verbal explanations that included uses of B and C below. As an example, here is William's response to Q2.3(v):
Here William relies completely on the appearance of his graph for f5: he grounds his claim that f5 is not one-toone on indicating two points of the graph, a and b, that appear to correspond to the same value on the yaxis. He then grounds his claim that f5 is not onto on his graph-based observation that f5 has 'maximum and minimum values in the y-axis'. The step towards a more formal grounding of these claims is not taken leaving William's reasoning vulnerable, for example, to possible
inaccuracies of the graphical representation such as the ones in another student's, Luke's, graph for Q2.3(i):
In the literature I have quoted above the tension between the students' reliance on graphical representations and the need to formalise their insights is a well-researched area of learning difficulties at this level. B. Use of the formal definitions of onto and one-to-one: the majority of the students' verbal statements were found to be confused, vague, often illogical and syntactically incorrect. I exemplify these later in the paper. C. Use of properties specific to fi (e.g. uniqueness of cubic root, uniqueness of solution of linear equation, boundedness of certain trigonometric functions): this usually resulted in not only correct but also justified answers.
The students have discussed most of these properties at GCSE - A'level but resorting to them may impinge on another issue: what is the students' perception of what they are allowed to assume at this stage? If they are told
From Informal Proceedings 21-1 (BSRLM) available at bsrlm.org.uk © the author - 51
Rowland, T. (Ed.) Proceedings of the British Society for Research into Learning Mathematics 21(1) March 2001
that they are only allowed to ground their reasoning on already proved statements, to what degree their knowledge of these properties is established enough to allow this use (Nardi 1997)? As an example here is Wayne's response to Q2.3(ii), where he
assumes the uniqueness of solution of a linear equation:
On the students' use of the formal definitions of onto and one-to-one. A large number of the students' verdicts on whether fi are onto and one-to-one was correct. However these verdicts were rarely justified in sufficiently formal terms. To comment further on the students' responses, let us consider the expressions for f: ℜ→ℜ: E1: ∀x∈ℜ, ∃y∈ℜ, such that f(x) = y E2: ∀y∈ℜ, ∃x∈ℜ, such that f(x) = y E3: ∀y∈Imf, there is exactly one x∈ℜ, such that f(x) = y E1 expresses that f is a function from ℜ to ℜ. E2 that f is onto and E3 that it is one-toone. The difference between E2 and E3 is a subtle one: in E2 there needs to be at least one x in the co-domain, in E3 exactly one in the image of f. Of course an understanding and use of E1-E3 depends heavily on the notion of ℜ as the Domain, the Co-domain and, tentatively, the Image of f. If f is a function, then every element of the domain must be assigned to an element of the co-domain. If f is onto, then for every element of the co-domain, there must be an element of the domain that is assigned to it. If f is onto, then the co-domain and image of f coincide. Therefore, to understand what it means for a function to be onto, one needs to understand the distinction between co-domain and image (a distinction that appears less problematic in the writing of students who resort to the graphs to discuss the properties of fi). Few students directly attempted formal expression such as E1 - E3. Most attempted a translation of their intuitions on fi into verbal statements and it is mostly these statements that I am concerned with here. Amongst the few who engaged with quantified statements*, their formal mathematical writing appeared problematic. As Paola Iannone and I have written elsewhere about the students' attempts at translating their thought into formal mathematical writing (Iannone and Nardi, submitted), I omit further elaboration on this here and turn to a discussion of the students' verbal responses and, in particular, those that are problematic translations of the students' correct intuitions about fi. When engaging with justifying their claims that one of the fi is not onto or one-to-one, the students use counterexamples (indicate x1 and x2 such that f(x1) = f(x2) for one-toone; indicate one y for which there is no x such that f(x) = y for onto). Their approach is often determined by the use of a graphic calculator for identifying these values which are often estimates. These responses* appear to be a product of a different
From Informal Proceedings 21-1 (BSRLM) available at bsrlm.org.uk © the author - 52
Rowland, T. (Ed.) Proceedings of the British Society for Research into Learning Mathematics 21(1) March 2001
process to, for example, Luke's 0 and 2π (see his response earlier) who seems to enact an understanding of trigonometric functions as periodic. Moreover, as when relying on graphs (see A earlier), the student's responses are vulnerable to possible inaccuracies of the estimate. Where the students appear less comfortable is with establishing an affirmative response, namely that one of the fi is onto or one-to-one. Their resort to the formal definitions often is restricted to a mere citation of the definitions in the abstract*. Apart from citing definitions in the abstract, students seem to confuse E1 with E3 when they claim, for example, that f2 is one-to-one because 'every value of a has only one corresponding value of b when f(a) = b' (Jo). And, for f3: 'there is no f(a) which has the same value as f(a')' without specifying the relationship between a and a'. It is noteworthy that Jo's arguments carry on similarly across Q2.3. Another, perhaps less clear-cut, fusion of E1 with E3 can be seen in another student's, Hazel's, response to Q2.3(iv): 'the function produces all possible R outcomes and they are all unique'. The first part of Hazel's argument is her reasoning on why the function is onto. The second part, where 'they' refers presumably to 'outcomes' suggests that different inputs produce different outcomes, therefore the function is one-to-one. However Hazel does not offer this clarification. If 'unique' refers to the uniqueness of the cubic root, then Hazel's response is problematic because the cubic roots in question are 'inputs' (a word she uses elsewhere in her writing), not 'outcomes'. Statements of similarly debatable precision - such as ex is not onto 'as the graph does not extend infinitely into the negative' - are very frequent in the students' writing and reflect commendable but unsuccessful attempts at verbal explanation. A dramatic and typical fusion of E1 and E2 can be seen in Louise's response to Q2.3(ii) and of E1 and E3 in her response to Q2.3(iii):
Louise seems to recall in part (iii) that being a function entails a certain kind of full coverage; but she is not clear of which set (domain or co-domain). She even pursues a transformation of the co-domain so that f3 'would be' a function. Also (ii) is a fusion of all E1 to E3.
The ubiquity of this confusion in the students' responses indicates a matter of pedagogical urgency: E1 - E3 need to be unpacked for the students and made distinct; the concept of function needs to be discussed emphatically in terms of its domain, codomain and image in order to counterbalance previously constructed concept images of a function as simply a relationship between numbers and in order to clarify that not all relationships are functions and that image and co-domain do not always coincide.
From Informal Proceedings 21-1 (BSRLM) available at bsrlm.org.uk © the author - 53
Rowland, T. (Ed.) Proceedings of the British Society for Research into Learning Mathematics 21(1) March 2001
NOTE The title of the project is The First-Year Mathematics Undergraduate’s Problematic Transition from Informal to Formal Mathematical Writing: Foci of Caution and Action for the Teacher of Mathematics at Undergraduate Level. It is an Action Research Project (Elliot 1991). Phase 1 was conducted in 6 Cycles of Data Collection and Processing following the fortnightly submission of written work by students during a 12-week term. Within each 2-week cycle students attend lectures and problem sheets are handed out; students participate in Question Clinics, a forum of questions from the students to the lecturers; students submit written work on the problem sheet; students attend tutorials in group of six and discuss the now marked work with their tutor. Dr Iannone and I then engage in an analysis of the student’s written work. We report details of the analytical procedure in (Nardi and Iannone 2000). * Evidence for the claims made here that carry an * was presented at the conference but had to be omitted here due to limitations of space.
ACKNOWLEDGEMENT Acknowledgement and warm thanks for allowing me to use these data must go to Dr Paola Iannone, Research Associate to this project and tutor of the students whose work I am quoting here.
REFERENCES Artigue, M. & Viennot, L.: 1987. 'Some aspects of students' conceptions and difficulties about differentials', The Second International Seminar on Misconceptions and Educational Strategies in Science and Mathematics, Cornell, Vol.3, 1-7 Barnes, M. 1988.: 'Understanding the Function Concept: Some Results of Interviews With Secondary and Tertiary Students', Research in Mathematics Education in Australia(June), 24-33 Dubinsky, E. & Harel, G.: (ed.) 1992. The Concept of Function: Aspects of Epistemology and Pedagogy, Washington D.C.: Mathematical Association of America: MAA Notes No 25 Elliott, J.: 1991. Action Research for Educational Change. Buckingham: Open University Press Ferrini-Mundy, J. & Graham, K. G.: 1991. 'An overview of the calculus reform effort: issues for learning, teaching, and curriculum development.', American Mathematical Monthly, 98(7), 627-635 Iannone, P. & Nardi, E.: (submitted) 'Students, bicycles and the quirks of symbolic language in mathematical logic', submitted for review to the Mathematical Gazette Markovits, Z., Eylon, B.-S. & Bruckheimer, M. 1986.: 'Functions today and yesterday.', For the Learning of Mathematics, 6(2), 18-24 Nardi, E. 1997:. 'Coping With the Requirements for Rigour: The Novelty of University Mathematics' Proceedings of the Conference of the British Society of Research Into the Learning of Mathematics, Roehampton University, 20(3), 81-87
From Informal Proceedings 21-1 (BSRLM) available at bsrlm.org.uk © the author - 54
Rowland, T. (Ed.) Proceedings of the British Society for Research into Learning Mathematics 21(1) March 2001
Nardi, E. & Iannone, P.: 2000. 'Adjusting to the Norms of Mathematical Writing: Short Stories on the Journey From Cipher to Symbol', Proceedings of the Conference of the British Society of Research Into the Learning of Mathematics, Roehampton University, 20(3), 55-60
From Informal Proceedings 21-1 (BSRLM) available at bsrlm.org.uk © the author - 55
Rowland, T. (Ed.) Proceedings of the British Society for Research into Learning Mathematics 21(1) March 2001
CHARTING KEY ELEMENTS OF CHILDREN’S MATHEMATICAL ARGUMENT IN DISCUSSION: A TEACHING TOOL Julie Ryan and Julian Williams University of Manchester We investigate how children reveal and develop their understanding of mathematics through collaborative argument in group discussion. Working with eleven-year-old children who had different responses to diagnostic test items, we describe how those children developed argument across conceptual locales. The analyses of the discussions led to a chart of the key elements of argument that arose, as well as general strategies for managing such discussions productively. Such devices and strategies are presented as planning tools for classroom teachers in the next stage of our study. DISCUSSION AS A TEACHING STRATEGY It has long been ‘known’ that children’s errors and misconceptions can be the starting point for effective diagnostically-designed mathematics teaching. The seminal mathematical work on this in the UK was done in the 1980s by the ESRC Diagnostic Teaching Project (Bell et al, 1985), in which cognitive conflict was seen as the route to developing understanding. Argument in discussion is seen as one important source of such conflict. The TIMSS video study reported that Japanese mathematics teaching typically makes use of a diagnostic approach: teachers are prepared with notes on a variety of likely responses to a key lead question, with guidance as to the thinking these responses indicate, and constructive teaching suggested related to each (Schmidt et al, 1996). This teaching method has been related to the success of Japanese children’s mathematical learning and particularly their problem solving capabilities. There can be no genuine discussion or argument without a ‘problematic’, ie. an unresolved or not trivially-resolvable problem. This induces some purpose and some tension that sustains a discussion. The problematic for a particular group of children can be established through prior testing which provides a range of student responses and methods of solution. The children are then set the task of persuading each other by clear explanation and reasonable argument of the answer. The giving of clarifications, reasons, justifications and informal ‘proof’ is the rationale for the discussion. The teacher can establish rules for the children’s argument – listening, clarifying, sustaining – in order to facilitate genuine participation and group progress in discussion and can, on occasion, act as devil’s advocate for positions which may provoke improved reasoning. Mistakes and errors can then be recognised in the light of alternative position statements offered for consideration. Discussion can then provoke a demand to shift from procedural to conceptual knowledge – from the ‘knowing-how’ to the ‘knowing-that’. It induces a need to develop a mathematical From Informal Proceedings 21-1 (BSRLM) available at bsrlm.org.uk © the author - 55
Rowland, T. (Ed.) Proceedings of the British Society for Research into Learning Mathematics 21(1) March 2001
vocabulary. It locates the voice of ‘understanding’ with each individual who decides when they are persuaded. It promotes learning as a collaborative activity. Dialogic methods involve the characteristics of conversation and the rigours of reason and persuasion: (a) sustained talk and listening; (b) statements of understanding; (c) thinking-in-progress; (d) the use and consideration of evidence; (e) cognitive conflict, and (f) the making of new connections. We use the term ‘argumentation space’ to describe the collection of relevant arguments likely to be used productively in children’s arguments about a particular problematic. In this paper we show how we are beginning to chart argumentation spaces in ways that may help teachers to plan classroom discussions to develop productive arguments. In addition we outline the main strategies that we found supported productive argument in group discussions. METHODOLOGY In this study a primary school cohort of 74 Year 6 children was screened with a test of some 30 items that was designed to reveal common errors that had already been identified as relevant to their mathematics curriculum and level (Ryan and Williams, 2000). We had previously identified the most interesting errors based on the criteria that they should be: (a) common enough to reward a teacher’s attention, (b) relevant to a significant locale of the curriculum being taught at the given age level in focus and (c) significant in terms of the literature on the psychology of learning. The test items were drawn from the whole primary school curriculum. By way of an example, we will cite the case of an item called ‘Ordering’ that asked children to sort the numbers 185, 73.5, 73.32, 57, 73.64 from smallest to largest. There are two common errors expected for ‘Ordering’: • 57, 73.5, 73.32, 73.64, 185 (‘decimal point ignored’), and • 57, 73.32, 73.64, 73.5, 185 (‘longest is smallest’). These errors were identified in the APU study of the early 1980s (Assessment of Performance Unit, 1982) and are as prevalent today as then. The ‘decimal point ignored’ error is believed to have an important bearing on the development of children’s number concept, and is typical of children’s over-generalisation of whole number conceptions to the wider field of rational numbers. From each of the three Year 6 classes, we selected 4 children for each discussion group on the basis that they had provided a range of responses on the test items. There were nine groups (36 children). The children from each group were from the same class and knew each other well, though were not necessarily from the same friendship group. Their teachers advised us on the likely successful dynamics for each group. They were mixed groups of boys and girls. The children, in groups of four, recalled their test item response (an interval of a few days only) for selected items and were invited to present an argument for their
From Informal Proceedings 21-1 (BSRLM) available at bsrlm.org.uk © the author - 56
Rowland, T. (Ed.) Proceedings of the British Society for Research into Learning Mathematics 21(1) March 2001
response to the group. We, as researchers, adopted the teacher’s role in discussion. All discussions were transcribed and analysed. ANALYSIS OF TRANSCRIPTS The analysis of argument follows Toulmin’s scheme in general (developed by Cobb and Bauersfeld, 1995 and Cobb et al, 2000; Krumhauer, 1997, and others). Propositions relevant to the issue are ‘backed’ by arguments that are then subject to testing. In general children find it unnecessary to argue propositions which are believed to be shared, (i.e. taken-as-shared) so any particular discourse reflects the presumed shared points of departure, including the rules of argument in such situations. In this the Researcher as a quasi-teacher assumes the authority and seeks to ensure reasonableness, the need for the inquiry to persuade by good thinking and argument, and so on (Costello et al, 1995). An important role in productive argument may be played by tools in practice, which may provoke the formulation of connections between components of mathematical knowledge, new constructions and hence productive backing. The number line has been shown to play a significant role in many such contexts, and does so in the following example. Here we present part of one transcript for an argument about the ordering of decimals. Some commentary and analytical categories used are shown in bold to the right, these relate to the argumentation, the conceptions/language and the tools/referents. Kim:
OK. I put 57 there – …. Then I put 73.5, … Then I put 73 point thirty-two, then I put 73.64 point sixtyfour, then I put 185. Natalie: Well, I got 57 at the beginning too. And then I got 73.5. Then I got 73 point three- two Then I got 73 point six- four. Then I got 185. RES: Could you explain why you put 73.5 before 73.32 (three, two)? Natalie: Because 73.32 (three, two) has got two digits after the decimal point and 73.5 has only got one. Elise: I’m not so sure, because 73.5 is basically 73 and a half. 73.64 (six, four) is, I’m not sure if it would be over a half or under… Actually I think the same as Kim… because, like Natalie said, there are two digits there, and two digits there, and only one digit there. RES: If I had a number line… Are you used to seeing a number line? (children nod). And I had 72. 72 would be back there. 73 would be there. 74 would be there. Where would you put 73.5? Do you want to do that Richard? Richard: (puts 73.5 half way between 73 and 74)
Everyday language
Mathematical language Focus Backing: separating decimal as wholes Intro fraction referent: conflict, backing
Introduce tool: number line
Number line product
From Informal Proceedings 21-1 (BSRLM) available at bsrlm.org.uk © the author - 57
Rowland, T. (Ed.) Proceedings of the British Society for Research into Learning Mathematics 21(1) March 2001
RES: Kim:
Can anybody put any other numbers in between 73 and 74? Yeah (puts 73.64 above 73.5)
RES:
Why have you put in bigger than 73.5?
Kim:
Because it’s over a half
RES:
Any other numbers you could put on that number line? Do you want to have a go Natalie? 73 point two-five
Natalie:
RES: Natalie: RES:
Natalie:
73.25 (?), where would that go? Could you tell us why you put 73.25 just there? It’s a quarter of the number. Do you agree with that? (children nod.) So, it’s gone… why has it gone exactly there? Is that because it is halfway towards a half? Yeah.
RES:
Could you put a number on that number line Richard? Richard: Erm, 73.45… (places it between 73.25 and 73.5… places 73.75 between 73.5 and 74). RES: 73.75, right? That’s… ? Richard: Three-quarters. RES: Kim:
So you put that halfway between 73 and a half, and 74… Where do you think 73.32 should go? Before 73.5
RES:
Why?
Kim:
Because 73.5 is a half and 73.32 is just after a quarter Could you say why it’s just after a quarter?
RES: Kim:
RES:
Check alternatives Press Number line product Check backing Backing: fraction equivalent Press Number line produces new argument Focus on 0.25 Backing: fraction equivalent Check backing
Develop number line
More 2-place decimals Backing: fraction equivalence
Resolution of referents Check backing
Because a quarter is 73.25 and 73.32 is bigger than Kim sees change of 73.25 (All agree) I now think 73.32 is there, and 73.5 mind is there. You all want to change your minds now? Now why Seeks reflection
From Informal Proceedings 21-1 (BSRLM) available at bsrlm.org.uk © the author - 58
Rowland, T. (Ed.) Proceedings of the British Society for Research into Learning Mathematics 21(1) March 2001
did we go wrong in the first place? Kim:
Elise:
Because we saw them as two-digit numbers, and we thought that the two-digit numbers were more than a one-digit number. I would say that 73.25 is a quarter, and it’s less than 73.5 because that’s a half, and 73.32 is just over a quarter, so it would be just under 73.5
Making ‘new’ explicit Fraction-decimal explicit
Extracting the most productive and essential elements of this and other arguments about ‘decimal point ignored’ allow us to make a summary chart (Figure 1). This summarises the lines of argument that we found that we think teachers will find useful in preparing for a particular discussion about ‘Ordering’. In addition, we have attempted to summarise effective strategies used by researchers in generating discussion (Ryan and Williams, 2000). Decimal point ignored (DPI): … point five is less than point thirty-two because five is less than thirty-two. BUT, compare fractions
Introduce number line of known fractions
… putting known fractions and decimals on a number line 1/2
1/4 BUT, compare fractions: 0.25
0.5
and 0.32 is a bit bigger than 0.25
DPI: …but point five and point fifty aren’t really the same … because if you add zero after the five you get fifty…
Introduce cancelling or equivalent fractions
but DPI: But column headings are tenths and unitths …why do you have two different ways of writing a single number?
“Adding a zero” may not change the value… 50% or 50/100 cancels down to 5/10 and ½.
but
Introduce equivalent measures
50 millimetres is the same as 5 centimetres and 2 kilograms is 2000grams.
Figure 1. A chart of argumentation space for ‘decimal point ignored’ CONCLUSION We have shown that it is possible to use dialogue generated in research to chart an argumentation space that describes the children’s arguments in response to a From Informal Proceedings 21-1 (BSRLM) available at bsrlm.org.uk © the author - 59
Rowland, T. (Ed.) Proceedings of the British Society for Research into Learning Mathematics 21(1) March 2001
provocative diagnostic item in a conceptual locale. The concept of an argumentation space located around a diagnostic item is designed to be helpful in supporting teachers’ pedagogical content knowledge. We interpret these spaces as providing potential classroom discourses structuring potential zones of proximal development of individuals within a class. The dialogues teachers might generate in replication of the research setting might thereby provide opportunities for individuals to learn by testing their responses against those of their peers, and being given an opportunity to evaluate and shift their position accordingly. We are currently investigating and evaluating how helpful these ‘charts’ can be to teachers in practice, and whether the resulting dialogues will be successful in helping children learn. The next step in the project involves a study with teachers delivering, marking and interpreting the diagnostic test and observation of their subsequent teaching through discussions based on these argumentation spaces. REFERENCES Assessment of Performance Unit: 1982, A Review of Monitoring in Mathematics 1978-1982. London: DES. Bell, A. W., et al.: 1983, Diagnostic Teaching: Report of ESRC Project. Nottingham: Shell Centre for Mathematical Education. Cobb P. and Bauersfeld, H, (eds.): 1995, The Emergence of Mathematical Meaning: Interaction in Classroom Cultures. Hillsdale, NJ: Erlbaum. Cobb P. E., Yackel, E. and McClain, K. (eds.): 2000, Symbolizing and Communicating in Mathematics Classrooms. Mahwah, NJ: Lawrence Erlbaum. Costello, P. J. M. and Mitchell, S. (eds): 1995, Competing and Consensual Voices: The Theory and Practice of Argument. Language and Education Library Series 8. Clevedon, Avon: Multilingual Matters Ltd. Krummheuer, G.: 1997, Reflexive arguing in elementary school classes: opportunities for learning. Paper presented at the Annual Meeting of the American Education Research Association, Chicago. Ryan, J. T. and Williams, J. S.: 2000, Mathematical Discussions with Children: Exploring Methods an Misconceptions as a Teaching Strategy. Manchester: University of Manchester. Schmidt, W. H., Jorde, D., Cogan, L. S., Barrier, E., Gonzalo, I., Moser, U., Shimuzu, K., Sawada, T., Valverde, G. A., McKnight, C., Prawat, R. S., Wiley, D. E., Raizen, S. A., Britton, E. D. and Wolfe, R. G.: 1996, Characterising Pedagogical Flow: An Investigation of Mathematics and Science Teaching in Six Countries. Dordrecht: Kluwer. Toulmin, S.: 1969, The Uses of Argument. Cambridge: Cambridge University Press.
From Informal Proceedings 21-1 (BSRLM) available at bsrlm.org.uk © the author - 60
Rowland, T. (Ed.) Proceedings of the British Society for Research into Learning Mathematics 21(1) March 2001
THE EFFECT OF METACOGNITIVE TRAINING ON THE MATHEMATICAL WORD PROBLEM SOLVING OF LOWER ACHIEVERS IN A COMPUTER ENVIRONMENT Su Kwang Teong Centre for Studies in Mathematics Education, University of Leeds
This study demonstrates that explicit metacognitive training appear to benefit lower achievers’ mathematical word problem solving in a computer environment. 11 to 12year-old Singaporean students in collaborative pairs were assigned to two word problem solving groups. The first group received explicit metacognitive training before word problem solving with WordMath (treatment); and the second group undertook word problem solving with WordMath (control). Results from the analysis of pair think aloud protocol data suggest that treatment lower achievers appeared to be more successful and elicited better regulated metacognitive decisions than control lower achievers. INTRODUCTION Recently, there has been much interest in training lower achievers with a metacognitive intervention strategy and observing its influence on lower achievers’ mathematics (e.g. Maqsud, 1998; Cardelle-Elawar, 1995). For example, CardelleElawar (1995) reports that lower achievers trained in learning to monitor and control their own cognitive processes for solving mathematics problems do better than untrained students. According to Schoenfeld (1985), compared with an ‘expert’ problem solver, ‘novices’ lack essential metacognitive monitoring, assessing and decision making skills, which are essential elements that determine one’s success or failure in problem solving. This paper reports on an investigation of the effect of metacognitive training on the mathematical word problem solving of four pairs of 11 to12-year-old Singapore lower achievers in a computer learning environment. Specifically, the metacognitive training focuses on activating lower achievers’ metacognitive processes when solving word problems in a WordMath (Teong, 2000, p. 25) environment. The primary aim of the investigation is to identify the role of metacognition in lower achievers’ word problem solving in a computer environment. METHODOLOGY Eight 11 to 12-year-olds from two Singapore primary schools were involved in this intensive study over a period of eight weeks. Four lower achievers from each school, chosen according to their 1998 end-of-the-year Mathematics examination result, were assigned to two groups: a pair of lower achievers (LA) from each school had explicit metacognitive training before solving word problems with WordMath (treatment or T); and a pair of lower achievers from each school solved word problems with WordMath without metacognitive training (control or C). In each school, the lower achievers had four training sessions and the author taught each session. The training From Informal Proceedings 21-1 (BSRLM) available at bsrlm.org.uk © the author - 61
Rowland, T. (Ed.) Proceedings of the British Society for Research into Learning Mathematics 21(1) March 2001
sessions consisted of a set of learning instructions, and the students worked collaboratively with WordMath word problem solving tasks. Each pair of lower achievers had two additional training sessions in which each pair solved four word problems during each training session. These additional training sessions served as practice sessions for the lower achievers to feel comfortable talking in front of the cam-corder. A posttest was administered to treatment and control lower achievers whereby the students’ word problem solving using WordMath with/without metacognitive training was video-recorded and the data analysed. Six weeks later, due to time and logistic constraints, a delayed posttest was only administered to the treatment lower achievers where the students’ word problem solving using WordMath was video-recorded and the data analysed. ANALYSIS AND RESULTS The data analysis was undertaken to try to identify the differences the types of word problem solving behaviours shown by pairs of treatment and control lower achievers while solving mathematical word problems. The following shows the analysis procedures applied to one of the eight word problem solving protocols for two pairs of lower achievers. Analysis of the MARBLE word problem has been chosen because it best illustrates the lower achievers’ unique word problem solving behaviours and collaborative style. The MARBLE word problem context is as follows. Joe Ee, Mun Fai and Jing Hao shared 400 marbles amongst themselves. Joe Ee received 28 marbles. Jing Hao received seven times the total number of marbles Joe Ee and Mun Fai received. How many more marbles did Jing Hao receive than Mun Fai?
A modified Artzt and Armour-Thomas’ framework was used to analyse the lower achievers’ think aloud protocols. The original Artzt and Armour-Thomas’ (1992) framework aims to highlight major strategic decisions made by a group of students. The think aloud protocol is parsed into episodes, representing periods of time during which the students are engaged in unique types of word problem solving behaviour. The original Artzt and Armour-Thomas’ framework (1992) had eight episodes to partition group think aloud protocols. The author modified their framework for the purpose of analysing pair think aloud protocols. The behaviours, described in Teong (2000, p. 71-75) are: reading (cognitive); analysis (metacognitive); exploration (cognitive); exploration (metacognitive); planning (cognitive); planning (metacognitive); implementation (cognitive); implementation (metacognitive); verification (cognitive); and verification (metacognitive). The following figures, Figures 1 and 2, demonstrate the overall structure of the solution analysis for MARBLE by S1 and S2 (T/LA), and S3 and S4 (C/LA). This is followed by a display table, Table 1, which shows the time and the percentage of behaviours coded as metacognitive and cognitive for posttest and delayed posttest of the MARBLE word problem.
From Informal Proceedings 21-1 (BSRLM) available at bsrlm.org.uk © the author - 62
Rowland, T. (Ed.) Proceedings of the British Society for Research into Learning Mathematics 21(1) March 2001
Numerical representation of lower achievers’ think aloud protocol data
The following table, Table 1, demonstrates the time two pairs of lower achievers devoted to cognitive and metacognitive behaviours during posttest and delayed posttest for the MARBLE word problem. The results in Table 1 appear to indicate that treatment lower achievers devote more time to metacognitive behaviours compared with control students. For example, S1 and S2 (T/LA) devoted 73.3% and 95.9% of their time to metacognitive activities during posttest and delayed posttest respectively compared with S3 and S4(C/LA) who devoted 47.6% of their time to metacognitive activities during posttest. S1 AND S2’S (T/LA) PROGRESSION OF WORD PROBLEM SOLVING ACTIVITY The protocol for S1 and S2 (T/LA) (see Figure 1) during posttest could be summarised as an orderly progression of activity, Read Æ Analyse Æ Plan Æ Implement (cognitive) Æ Implement (metacognitive) Æ Implement (cognitive) Æ Verify (metacognitive) which led to their success in solving the word problem. They also seemed in control of their cognitive actions, as illustrated by the following exchange after the pair had drawn the diagram which represented the word problem. From Informal Proceedings 21-1 (BSRLM) available at bsrlm.org.uk © the author - 63
Rowland, T. (Ed.) Proceedings of the British Society for Research into Learning Mathematics 21(1) March 2001
S1:
The question asked how many more marbles did Jing Hao receive than Mun Fai.
S2:
So we have to find Mun Fai
S1:
Let me see (pauses for 3 seconds). This is the unknown (pointing to the diagram)/ unknown because of Mun Fai. So let say this is one small unit /
S2:
Okay Post test Behaviour Category Metacognitive Cognitive Total
Delayed Post test
S1 and S2* (T/LA)
S3 and S4 (C/LA)
S1 and S2* (T/LA)
490 (73.3)
304 (47.6)
612 (95.9)
179 (26.8) 669 (100)
335 (52.4) 639 (100)
26 (4.1) 638 (100)
* correct solution Table 1: Time in Seconds (and %) devoted to Cognitive and Metacognitive Behaviours Per Pair for MARBLE word problem during Posttest and Delayed Posttest
These strengths contributed to their success in their entire word problem solving during posttest. With respect to the MARBLE word problem, they devoted 73.3% of their time to metacognitive activities (see Table 1). During delayed posttest, the protocol for S1 and S2 (T/LA) could also be summarised as a well-regulated progression of activity, Read Æ Analyse Æ Plan Æ Implement (metacognitive) Æ Verify (metacognitive), which led to their success in solving all the word problems. The control of their word problem solving for MARBLE was again evidenced by the percentage of time they devoted to metacognitive activities: metacognitive (95.9%) and cognitive (4.1%) (see Table 1). S3 AND S4’S (C/LA) PROGRESSION OF WORD PROBLEM SOLVING ACTIVITY The protocol of S3 and S4 (C/LA) (see Figure 2) could be summarised as: 1. Reading the word problem; and 2. Exploration (cognitive), where the pair was observed to take the numbers out of the word problem context and used different operations to manipulate these numbers. S3 and S4 appeared to have limited resources to aid them in their word problem solving. They engaged in exploration and tried making local assessments at the beginning of the word problem solving session, but their metacognitive decisions were weak and they did not help them. With respect to the MARBLE word problem, From Informal Proceedings 21-1 (BSRLM) available at bsrlm.org.uk © the author - 64
Rowland, T. (Ed.) Proceedings of the British Society for Research into Learning Mathematics 21(1) March 2001
they devoted 47.6% (see Table 1) of their time to metacognitive activities. This pair was successful in 25% of their word problem solving. DISUSSION The above findings suggest that treatment lower achievers appear to be more successful in word problem solving compared with control lower achievers. In addition, there is evidence that treatment lower achievers are devoting more time to regulating and monitoring their word problem solving process even after a prolonged period of six weeks with metacognitive instruction (see Table 1). These findings concur with Cardelle-Elawar’s (1995) study. Cardelle-Elawar found that lower achievers with explicit metacognitive training outperformed control group where students still relied more on the teacher for the right answer. Cardelle-Elawar’s (1995) study suggests that metacognitive training provides a classroom structure for low achievers to think for themselves and to recognise their limitations which in turn promotes problem solving success (op cit p. 93). The analysis of the think aloud protocol also suggests that treatment and control lower achievers responded differently when they were ‘stuck’. For example, S1 and S2’s (T/LA) apparent control and monitoring strategies when they were ‘stuck’ during posttest and delayed posttest usually led them away from inappropriate paths into paths of solution. The following exchange, while the pair was solving another word problem, illustrates how the pair’s good control and monitoring strategies directed them to find alternative path of solution. S1 and S2 were exploring (metacognitive) for 179 seconds when they realised that they were ‘stuck’. S2: S1: S2: S1: S2: S1: S2: S1: S2: S1: S2: S1: S2:
It doesn’t match what! (3) This plus is extra right? We’re just doubling/doubling it (3). So, this and this is 1 dollar extra. Hm mm But this doesn’t match. This, the minus and plus sign doesn’t match. So/ what we have to do is to make this minus sign become add sign/ How do to do that? (17) Is that true/ that 4 kg is 4? 5 kg is 4 dollars? 5 kg is / how do you get the 4 dollars? 3 plus 1 5 kg is 4 dollars. Then why do you add together? Let me try. If 5 kg is 4 dollars, then 10 kg is 8 dollars (4) 5 kg is 4 dollars / yeah. 10 kg is 8 dollars. So, 8 dollars minus 3 because of [the 4 [but why do you add the 3 dollars plus 1 dollar? because one is short and one is extra/
During the 17 seconds pause, S2 was silently referring to the word problem. When she proposed that 5 kg was 4 dollars, S1 and S2 analysed this idea with reference to the diagram they had initially drawn. S2 also checked on S1’s suggestion. These
From Informal Proceedings 21-1 (BSRLM) available at bsrlm.org.uk © the author - 65
Rowland, T. (Ed.) Proceedings of the British Society for Research into Learning Mathematics 21(1) March 2001
good control and monitoring strategies appeared to have helped in S1 and S2’s (T/LA) word problem solving success. In sharp contrast, S3 and S4 (C/LA) appeared to engage in explore (cognitive) when they realised they were ‘stuck’. For example, when S3 and S4 realised that their solution was incorrect in the episode explore (metacognitive) (see Figure 2), they did not proceed to reread the word problem nor analyse the word problem based on the diagram they had drawn earlier. Instead they continued making inappropriate assumptions with regard to the relationship between the givens and the unknowns in the word problem situation. This behaviour appeared to be consistent with lower achievers’ S3 and S4 (C/LA) word problem solving. According to Kaplan and Davidson (1988), when students reach points of impasse on word problems which are novel or require unavailable knowledge, instructional intervention offering problem solving strategies and encouraging self-reflection has been found to improve problem solving performance. Hence, there is reason to suggest that S3 and S4 (C/LA) need metacognitive training so that they will be able to discern when they have to move away from inappropriate solution paths, relocate their resources so that they might effectively solve word problems by constantly monitoring their solution paths. CONCLUSION This paper supports an approach to instruction which includes metacognitive training in mathematical word problem solving in a computer environment. The metacognitive training promotes lower achievers’ metacognitive awareness by informing them about effective word problem solving strategies, and making them aware of their cognitive processes during word problem solving. As a result, the lower achievers seem more likely to be able to monitor and regulate their own thinking, which appears to contribute to their success in solving word problems. REFERENCES Artzt, A and Armour-Thomas, E: 1992, ‘Development of a cognitive-metacognitive framework for protocol analysis of mathematical problem solving in small groups.’ Cognition and Instruction, 9, 137-175. Cardella-Elawar, M: 1995, ‘Effects of Metacognitive Instruction on Low Achievers in Mathematics Problems.’ Teaching and Teacher Education, 11(1), 81-95. Maqsud, M: 1998, ‘Effects of metacognitive instruction on mathematics achievement and attitude towards mathematics of low mathematics achievers.’ Educational Research, 40(2), 237-244. Schoenfeld, A: 1995, Mathematical Problem Solving. San Diego: Academic Press. Teong, S K: 2000, The Effect of Metacognitive Training on the Mathematical Word Problem Solving of Singapore 11-12 year olds in a Computer Environment. PhD Thesis, University of Leeds. Kaplan, CA and Davidson, JE: 1988, Hatching a theory of incubation effects. Carnegie Mellon University, Department of Psychology. From Informal Proceedings 21-1 (BSRLM) available at bsrlm.org.uk © the author - 66
Rowland, T. (Ed.) Proceedings of the British Society for Research into Learning Mathematics 21(1) March 2001
PUPIL MOBILITY AND LOW ATTAINMENT IN MATHEMATICS Julia Whitburn National Institute of Economic and Social Research Levels of pupil mobility are known to vary significantly between areas and types of schools but hitherto there has been only limited evidence on the link between pupil mobility and low attainment. Recently available data from a large-scale mathematics study are used here to examine this relationship. A case study of one school is used to illustrate the considerable problems associated with high pupil mobility, including the link with deprivation and resulting social needs. This preliminary study also points out the dangers of comparing school performance in national tests without considering the impact of changing school populations. INTRODUCTION We know that changing schools at any time is a stressful and potentially damaging experience for pupils; there is well-documented evidence regarding the experience of pupils moving to different schools at the beginning of KS2 and again at KS3 (Galton & Willcocks, 1983). The effect on children who change schools within a Key Stage, when the normal arrangements made to smooth the transition do not apply, is expected to be much greater. The research questions addressed in this study are: • What is the level of pupil mobility during the primary years of schooling? • How does this vary between schools? • How does attainment in mathematics among children who have moved at least once during a Key Stage compare with the average attainment of children who have been stable during this period? • Is low attainment among 'movers' more evident in some schools? This study is in its early stages, and the results and discussion presented here are very preliminary. A great deal of further work and analysis of existing data remains to be carried out, but, by presenting preliminary findings we hope to benefit from informed discussion of the issues. WHAT DO WE MEAN BY PUPIL MOBILITY? Pupil mobility is usually defined as ' a child joining or leaving a school at a point other than the normal age at which children start or finish their education at that school' (Dobson & Henthorne, 1999). It is frequently calculated as: number of joiners + number of leavers × 100 = percentage mobility rate total number on roll (This is sometimes referred to as the JPL [joiners plus leavers] formula) We need, however, to be aware of the other side of the coin, namely, the stability of the pupil population, or the proportion of pupils who remain in a class or school. The level From Informal Proceedings 21-1 (BSRLM) available at bsrlm.org.uk © the author - 67
Rowland, T. (Ed.) Proceedings of the British Society for Research into Learning Mathematics 21(1) March 2001
of 'stability' has a significant effect on school cohesion and is also likely to affect school performance in national tests. Schools with the same level of pupil mobility may yet have very different levels of pupil stability. EXISTING EVIDENCE ON LEVELS OF PUPIL MOBILITY Existing data on pupil mobility derives from a number of difference sources and demonstrates the variability of the situation between and within LEAs. The lowest levels for pupil mobility are quoted in the Value Added National Project (VANP) which found that only 17% of Year 6 pupils in a sample of primary school in Avon had changed schools (other than changing from Infant to Junior), suggesting an annual mobility rate of about 4% (SCAA, 1997). A survey conducted mainly in Solihull and Bradford for the Performance Indicators in Primary Schools (PIPS) project found estimated annual mobility rates of 10% (Tymms & Henderson, 1995). The most recent - and important - study by Dobson & Henthorne (op. cit., also Dobson, Henthorne & Lynas, 2000) found an average annual mobility rate of 10-20% in primary schools in 'diverse urban LEAs'. A slightly earlier report by the London Research Centre (Hollis,1998) suggested that pupil mobility was higher in London than in other areas of England. The common thread running through the findings of all the surveys, however, is that levels of pupil mobility vary significantly between schools. It is equally clear that the reasons for changing school will also be diverse. These include moving for reasons of employment, moving to better housing, refugee families, Gypsy/Traveller families, children moving between parents after family break up and children in care. It is recognised that high pupil mobility in schools is strongly associated with social deprivation, family break up, use of temporary accommodation and other rented housing used by poor families (Dobson & Henthorne, op.cit.). NEW EVIDENCE ON PUPIL MOBILITY Since many of the data drawn on here derive from an initiative designed to raise standards of mathematics attainment in the primary school years, a little background information about this initiative is appropriate. For the last five years, the National Institute of Economic and Social Research (NIESR) and the London Borough of Barking and Dagenham (LBBD) have been working together to raise standards of mathematics among primary school pupils. 21 schools in LBBD have participated in the Improving Primary Mathematics project (IPM) from the beginning; at the time of writing the first cohort of pupils has reached Year 6, and will complete their primary schooling in July 2001. The data used here refer to the mobility of pupils between September 1997 (when the present Year 6 cohort entered KS2) and December 2000 (when the present Year 6 cohort were last tested). Thus the period covered is 31/3 years rather than the full four years of KS2. Figures on turnover of pupils in this single cohort for the 3 1/3 year period from September 1997 to December 2000 are shown in Table 1.
From Informal Proceedings 21-1 (BSRLM) available at bsrlm.org.uk © the author - 68
Rowland, T. (Ed.) Proceedings of the British Society for Research into Learning Mathematics 21(1) March 2001
Total no. of pupils on roll September 1997
1421
Total no. always on roll
1132
Total no. of joiners
259
Total no. of leavers
292
Total no. joining then leaving
92
JPL over 31/3 years
65%
Average Annual JPL
20%
Table 1: Turnover of pupils for the 31/3-year period from September 1997 to December 2000
This is a reasonably high average level for annual mobility, but, judged by the findings from other studies referred to earlier, by no means exceptionally high for an outer London borough. Consistent with the findings from other studies, levels of mobility were found to vary significantly between schools. While in one school pupil mobility was only 6%, in three schools it was 30% or higher. These three schools have been the subject of further study. An important factor affecting the level of mobility turnover was found to be the provision of temporary housing and/or social housing perceived as being undesirable close to each of the three schools. As families became eligible for permanent and/or preferred accommodation, they moved into a different school catchment area. ATTAINMENT IN MATHEMATICS There are obvious difficulties in measuring the progress made by pupils who move schools, since in any longitudinal study it is only possible to measure the progress of the 'stable' pupils who are present both at the beginning and the end of the study period. It is clearly difficult to track pupils who move schools during the period of a study, while those pupils who 'join' during a study will not have had their attainment measured initially, thus preventing any assessment of progress. More detailed information on attainment of 'mobile pupils' is now available from the IPM project referred to earlier. As part of this project, pupils from Year 2 in LBBD upwards have been routinely tested three times a year in order to monitor pupil attainment, school attainment, and the effectiveness of the teaching materials on individual topics. The detailed testing programme has achieved high levels of pupil participation - typically 95%. From the details of pupils on roll at the time of each test (referred to here as 'IPM' tests in order to distinguish them from national tests), we have been able to build up a very clear picture of the standards and progress achieved by pupils in project schools, and also of those pupils joining project schools. Pupils in Year 1 have not been tested as part of the project, and so little information is at present available on the progress of 'joiners' during Key Stage 1, although we are in the process of relating performance on Baseline Assessment on entry to schooling to performance in Year 2 IPM tests. The focus here, therefore, is mainly on attainment and progress in From Informal Proceedings 21-1 (BSRLM) available at bsrlm.org.uk © the author - 69
Rowland, T. (Ed.) Proceedings of the British Society for Research into Learning Mathematics 21(1) March 2001
mathematics during Key Stage 2. For example, we can examine attainment of the current cohort of Year 6 pupils in the most recent tests (December 2000) and compare the performance of pupils who have moved schools during KS 2 with that of pupils who have been 'stable' (Fig. 1). Figure 1: Percentage distribution of performance by Year 6 pupils in December 2000 100 90
% of pupils gaining more than
80 70 60 Stable in KS2
50
Joiners in KS2 40 30 20 10 0 0
10
20
30
40
50
60
70
80
90
100
% score
Clearly the results can include only 'joiners' during KS2 not 'leavers', and thus the picture of the under-attainment of the mobile population is not complete. We can see, however, that at all points in the distribution scores of the 'joiners' were below those of the 'stable' population. Overall, the mean scores of the 'stable' population and the 'joiners' were 58% and 50% respectively. As part of the project, we have been concerned with measuring low attainment, identifying its causes and finding ways of reducing it. Defining 'low attainment' and 'very low attainment' as achieving test scores of less than 40% and 25% respectively. we find that the proportions of these pupils were disproportionately high among schools with high mobility (see Table 2).
Schools of high mobility (30% or higher) Other schools
% of low attainers
% of very low attainers
Other pupils
Total
No. of pupils
38%
18%
44%
100%
180
29%
10%
71%
100%
1017
Table 2: Percentages of low-attaining pupils in Year 6 by level of school mobility
Among schools with high levels of pupil mobility, the percentages of 'joiners' who were also low attainers are even more marked (see Table 3).
Stable pupils Joiners
% of low attainers
% of very low attainers
Other pupils
Total
No. of pupils
36% 42%
16% 22%
48% 36%
100% 100%
120 60
Table 3: Low-attaining pupils in Year 6 among schools with high levels of pupil mobility
From Informal Proceedings 21-1 (BSRLM) available at bsrlm.org.uk © the author - 70
Rowland, T. (Ed.) Proceedings of the British Society for Research into Learning Mathematics 21(1) March 2001
A more detailed study is being made of the three schools with the highest levels of pupil mobility, and the ways in which they are able to respond. It is probably no coincidence that all three have more than 40% of pupils eligible for FSM and in one school this reaches 58%. CASE STUDY OF ONE SCHOOL WITH HIGH PUPIL MOBILITY Some detail is provided here in respect of just one of these schools in order to understand the problems better. This is a four-form entry 'all-through' primary school located in an area of poor housing and much temporary accommodation. It has endeavoured for a number of years to raise standards of attainment and has had considerable success in this respect. For example, during the last three years the proportions of children reaching 'expected' standards in mathematics have increased from 73% to 86% at KS1 and from 43% to 69% at KS2. It is clear, however, that relatively recently - during the last eighteen months - events have occurred that have had an additional effect on levels of pupil mobility. For example, during the school year 1999-2000, 170 pupils with refugee status (out of an 'on roll' number of 700) joined the school. Although this school has long been accustomed to a rapidly-changing pupil population (for example, out of the 135 pupils in Reception in 1994/5, only 30 are now in Year 6 - and some of those left and rejoined during the intervening years), the rate of change is now increasing During this six-month period, there has been an average of ten changes of pupils each week. New class lists are produced by the head teacher during weekends. Office staff use their best endeavours to obtain background information on pupils joining the school, by means of the 'unique pupil number' system introduced by DfEE in September 2000. This, however, is proving fallible due to the high incidence of 'temporary' pupil numbers issued by schools and the consequent difficulties of tracking these pupils. With little background information available for joining pupils, assessment of pupils' levels of attainment in core subjects on entry to the school becomes more important, yet no resources are available for this. Additionally, given the high numbers of refugee children joining the school, there is an obvious associated cost for EAL support and interpreters. At the present time among pupils attending the school and their parents, 36 different languages are spoken. The head reports that separate parents' evenings are held for different ethnic groups in order to provide appropriate interpreting support, and also in an effort to develop sound homeschool relationships through parental involvement with the school. For many of the families whose children join the school, their social needs were described as being diverse and complex. The multiple social needs of many of the 'indigenous white population' were said to be as challenging as the needs of the refugee families. The quality of temporary accommodation close to the school tends to be used to house families that have suffered family break up, domestic violence, child abuse or need family protection. With 58% FSM, levels of poverty are also high. The need for greater financial support to meet the needs of the recently increased levels of mobility was stressed by the headteacher. From Informal Proceedings 21-1 (BSRLM) available at bsrlm.org.uk © the author - 71
Rowland, T. (Ed.) Proceedings of the British Society for Research into Learning Mathematics 21(1) March 2001
Although the need for assessing children on arrival and 'settling them in' was completely acknowledged, there were no resources available for this purpose. The head also commented that, ironically, the fact that some schools with high turnover are perceived by parents as being less desirable than others is likely to lead to a greater number of 'joiners'. For example, at a popular, over-subscribed school, if a pupil leaves the vacancy created will be filled from the waiting list, consisting of pupils already resident in the catchment area. A less popular school which is not full will clearly attract a greater number of pupils moving into the area, who may well have greater needs. Schools with low pupil mobility can afford to have an effective policy with regard to the assessment and 'integration' of new pupils, and also to follow up their leaving pupils. This is regarded as a luxury by schools with high pupil mobility, however, who can do little more than cope from day-to-day with new arrivals. CONCLUSION In the context of the multiple problems associated with increasingly high levels of pupil mobility, the improvement achieved by the school in terms of NC test results during the last three years seems remarkable. Yet even this attainment is not fully appreciated, since comparisons are inevitably made with the performances of other schools where pupil populations are more stable. Head teachers argue - with some justification - that comparisons of NC test results should be made in relation to pupils present throughout the relevant Key Stage, and who were taught by the school concerned, rather than of pupils who joined the school at a later stage - and some only just prior to the test date. It seems unlikely that the new established levels of pupil mobility will decrease significantly in the foreseeable future. Schools with high pupil turnover clearly need appropriate levels of support in order to respond adequately to their pupils' needs. The head teacher whose school had made significant progress in standards of attainment, was most reasonable in his requests for support, saying that just one additional member of staff would enable him to provide a much better start for the new pupils. Greater appreciation and understanding by the government of the problems associated with pupil mobility is a top priority. REFERENCES: Dobson J. & Henthorne K.: 1999, ‘Pupil Mobility in Schools: Interim Report.’ Nottingham: DfEE Publications. Dobson J., Henthorne K. & Lynas Z.: 2000, ‘Pupil Mobility in Schools: Final Report.’ Nottingham: DfEE Publications. Galton M. & Willcocks J. (eds.): 1983, ‘Moving from the Primary Classroom.’ London: Routledge & Kegan Paul. Hollis J.: 1998, ‘Pupil Turnover: A Research Report for the Association of London Government.’ London: London Research Centre. Schools Curriculum and Assessment Authority: 1997, ‘The Value-Added National Project Final Report.’ London: SCAA. Tymms P. & Henderson B.: 1995, ‘The Value-Added National Project: Primary Technical Report.’ London, SCAA. From Informal Proceedings 21-1 (BSRLM) available at bsrlm.org.uk © the author - 72
Rowland, T. (Ed.) Proceedings of the British Society for Research into Learning Mathematics 21(1) March 2001
LEARNING PREFERENCES OF PGCE STUDENTS Derek Woodrow and Janis Jarvis Manchester Metropolitan University Institute of Education Applications for entry to Higher Education show marked differences between ethnic minority groups and marked gender preferences, particularly for mathematics. Analysing UCAS data shows that these differences are persistent. Research into learning preferences suggests that these might be one reason for these differential choices. This paper reports a study of over 417 undergraduates and 628 PGCE students, identifying clear subject differences in learning preferences. Mathematics students lie at one end of the scale and English students at the other. When UCAS first collected data in 1990 on the ethnic origins of applicants to Higher Education it posed a variety of questions about how students made their choice of subject (Taylor, 1993; Modood, 1993; Woodrow, 1996). It is clear that students from different ethnic groups have shown differential subject choices.
Medicine/Dent. Sub. allied med. Biol.sciences Maths/informatics Eng. and tech. Social studies Languages Humanities Education Combined sciences Soc.st. with arts
ASIAN Men Women 5% 5% 5% 10% 2% 6% 33% 12% 10% 2% 9% 16% 1% 3% 1% 1% 0% 3% 4% 3% 1% 3%
BLACK Men Women 1% 1% 6% 10% 2% 4% 22% 8% 12% 2% 10% 19% 1% 3% 1% 1% 1% 3% 3% 2% 2% 5%
Total Numbers
15552
4312
14567
5728
WHITE Men Women 1% 2% 5% 9% 4% 7% 13% 3% 10% 1% 10% 13% 4% 8% 4% 4% 2% 7% 2% 2% 2% 4%
TOTALS Men Women 2% 2% 5% 9% 3% 7% 16% 4% 10% 2% 9% 14% 3% 7% 3% 3% 2% 7% 3% 2% 2% 4%
110828 129298 145177 163541
Table 1: Ethnic origin of accepted applicants, by subject group, 2000 entry
The data in Table 1 (UCAS website) has been presented in terms of the percentage of applicants/acceptances from a particular group choosing a particular subject to study. Differences between the genders are similarly clear and persistent. Three times as many women study languages as men, six times as many men study engineering. There are also interesting variations within ethnic groups and gender variations also have interesting features. Applications by Asian and Black students represented only 4% of applications for education (a proportion only larger than those for Agriculture, Physical Sciences and Humanities) whereas for Maths and Informatics they represent 32%. Nearly seven times as many Black students apply for studies including aspects of Social Studies compared to Education, areas which might both superficially be From Informal Proceedings 21-1 (BSRLM) available at bsrlm.org.uk © the author - 73
Rowland, T. (Ed.) Proceedings of the British Society for Research into Learning Mathematics 21(1) March 2001
thought as related to socially involved activities. Woodrow (1996) suggests this difference might be related to the institutionalised nature of teaching and hence related to institutional racism compared to the individual support, counselling and empowerment associated with social work. Again over 22% of Asian students and 14% of Black students apply for Mathematics and Informatics compared to 7.5% of White students. This confirms a common perception that Asian students in particular are drawn to the subject. In fact the recent large increases in this subject area is almost entirely comprised of applications for computing (informatics). 2000 Men 2485
Women 1567
1999 Men 2402
Total 4052
Women 1454
Total 3856
1998 Total 3825
Table 2: Maths Recruitment
It is tempting to begin to draw speculative reasons to explain these differences, and some of these were explored in a previous article (Woodrow, 1996). The evidences are not strong, however. Clearly the cultural milieu from which the students derive will have some effects. Similarly whilst there has been a long and significant debate about gender bias in respect of mathematics, there seems little real movement, except as the proportion of students from ethnic minorities increases they perhaps do not share those biases in quite the same strengths. Woodrow (1996) suggested that learning styles have a significant influence. (By learning styles we mean preferences such as for learning alone, learning by memorising, preferring structured learning to exploratory learning, etc. rather than issues of 'cognitive style' involving dichotomies such as wholist/analyser or field (in)dependence characteristics.) Indeed, for one group relating significant to mathematics (the Chinese) Sham and Woodrow (1998, 2001) have shown that they strongly retain a very distinctive learning style to that of their White compatriots. For other groups there is little clear evidence in the U.K. relating to learning styles. In a major exploration of learning styles in the USA Dunn (1990) found that African/Caribbean students had totally reverse preferences to Chinese students in 15 out of 21 learning preferences, such as working co-operatively Learning Preferences : Chinese Americans/Afrikan Americans (after Dunn et al., 1990) 3
2
1
TE
PA
AF
M O
M
LM
K
IN
TC
VI S
V
D AU
A
AU
ST
P
R
D
M
L
T
S
0
Afrikan Americans Chinese Americans
-1
-2
-3
From Informal Proceedings 21-1 (BSRLM) available at bsrlm.org.uk © the author - 74
Rowland, T. (Ed.) Proceedings of the British Society for Research into Learning Mathematics 21(1) March 2001
On subject choice and learning styles Woodrow conjectured that the way in which Mathematics is taught and learned might well select people with particular personal characteristics - authoritative, focused and convergent personalities - which might not be the most suitable for activities such as teaching (where interpersonal skills and adaptability are paramount). A small-scale survey of 38 students at the University of Lancaster reported in a DFE (1994) relating to shortages of maths and science students also conjectured that science and technology students had different learning style from arts students. In their study of FE students, Bloomer and Hodkinson (1997) found the dispositions of students to learning were closely related to ·
Their perceptions of the nature of knowledge
·
Their views on the purposes of learning
·
Their evaluations of the learning activity as a means of acquiring knowledge
However what the subject related learning styles are and how they relate to subject variations in recruitment is still somewhat unclear. It is this aspect of the variations that the current research project described below is designed to begin to explore. LEARNING PREFERENCES AND SUBJECTS OF STUDY In order to explore this a questionnaire was developed which collected biographical details, a small number of open questions (such as what do you like best about your course'), a small number of ranking questions related to learning preferences (such as 'which do you prefer: lectures, seminars, workshops, individual research') and a 50 item Likert Scale questionnaire which asked for agreement/disagreement to questions such as 'I prefer to work on my own' or 'I learn best by listening to lectures'. Returns were obtained from 417 undergraduates and 628 PGCE students (gathered at the end of two different cohorts and at the beginning of one of these cohort to enable some specific comparisons to be made). The questionnaire was intended to explore four specific dimensions concerned with learning preferences ·
Approaches to learning
·
Epistemological beliefs
·
Motivational factors
·
Participation and interactional preferences
An overall 'learning preference score' was also calculated derived from the mean of all four dimensions. This overall score ranged between 1 and 5 with a low score indicating ·
A 'deep' (as opposed to 'surface') approach to learning
·
A relativistic (as opposed to 'objective') view of knowledge From Informal Proceedings 21-1 (BSRLM) available at bsrlm.org.uk © the author - 75
Rowland, T. (Ed.) Proceedings of the British Society for Research into Learning Mathematics 21(1) March 2001
·
Intrinsic (as opposed to extrinsic) motivation
·
Preference for a high degree of classroom interaction
It can be seen from the table that there is a general consistency amongst the students with the English and maths students operating at either end of the spectrum. Subject
No.
Mean Score
Std.Dev.
English Art Physical Edn. Social Sciences Music Science Geography Business Studies MFL Des. & Techgy. Religious Edn. Maths
88 52 9 14 11 94 32 33 36 49 16 49
2.43 2.51 2.62 2.63 2.64 2.65 2.65 2.66 2.67 2.74 2.83 2.87
0.33 0.33 0.3 0.26 0.31 0.3 0.42 0.42 0.38 0.32 0.33 0.43
Table 3: Learning Preference Scale PGCE
Approach Epistem Motivto Learning -ology ation 1 2 5 7 3= 3= 9 8 10= 10= 5 12
1 3 9 2 7 6 4 5 8 10= 12 10=
Interaction
1 2 3 7 5 10 6 12 4 8= 11 8=
1 3 4 6 10 5 8 2 7 9 12 11
Table 4: Rank orders in the four dimensions
The comparative undergraduate figures are given below. The PGCE students are on the whole at the 'deep' learning etc end of the spectrum - the 'English' end of the PGCE rankings compared to the undergraduate scale. It would therefore be expected that in subjects for which students have - a surface approach, a fixed knowledge, extrinsic motivation and non-interactive learning style - then recruitment to teaching might prove more difficult (i.e. maths, RE, D&T,MFL). There is no indication, of course, as to whether the study of a particular subject 'creates' a learning preference or whether a learning preference (e.g. for the Chinese) might determine the choice of subject. No
mean score
std.dev
English
75
2.76
0.36
Business Studies
75
2.84
0.15
Art
47
2.85
0.11
Science
89
2.87
0.29
Maths
98
3.02
0.26
Table 4 - Learning Preference Scale Undergraduate
From Informal Proceedings 21-1 (BSRLM) available at bsrlm.org.uk © the author - 76
Rowland, T. (Ed.) Proceedings of the British Society for Research into Learning Mathematics 21(1) March 2001
The data was also subject to Item Analysis and to both Oblique and Orthogonal Factor Analysis. The outcomes were consistent, but with five factors being identified: Interaction/Participation, Approach to Learning, Instructional Preferences, Epistemological Beliefs and Self-regulation. The general pattern of subject ordering remained consistent with the face validity outcomes described earlier. PGCE students were also asked a number of course related questions from which some interesting comparative data emerged. 47% of maths students chose the PGCE because they wanted a challenging/ stable/ rewarding career (c.f. the lowest 22% for PE, and highest 54% for Art). Love of their subject motivated 18% of maths (25% of RE and 9% of music). Love of children motivated 10% of maths (0% of RE and 22% of PE and Geography). 9% of maths always wanted to teach (23% English and 0% Business studies). Previous experience teaching attracted 6% maths (36% music and 3% Business studies). 16% maths sought a career change (the highest with PE at 0% the lowest). REFERENCES. Bloomer M. and Hodkinson P.: 1997, ‘Moving into FE: the voice of the learner’ London: FEDA DFE .: 1994, ‘Science and Mathematics, A Consultation Paper on the Supply and Demand on Newly Qualified Young People.’ London: H.M.S.O. Dunn R. et al.: 1990 ‘Cross cultural differences in learning styles of elementary age pupils from four ethnic backgrounds.’ Journal of Multicultural Counseling and development 18, 68-93 . Modood T.: 1993, ‘The number of ethnic minority students in higher education, some grounds for optimism.’ Oxford Review of Education, 19(2), 167-82. Sham S. and Woodrow, D.: 1998, ‘Chinese Pupils and their families in England.’ Research Papers in Education, 13(2), 203-226. Taylor P.: 1993, ‘Minority Ethnic Groups and Gender in Access to Higher Education.’ New Community, 19(3), 425-40. UCAS.: 2000 Statistical Bulletin - subject trends, www.UCAS.ac.uk. Woodrow, D.: 1996, ‘Cultural inclinations towards studying mathematics and science.’ New Community, 22(1), 23-38. Woodrow D. and Sham. S.: 2001, ‘Chinese Pupils and Their Learning Styles.’ Race, Ethnicity and Education (in press).
From Informal Proceedings 21-1 (BSRLM) available at bsrlm.org.uk © the author - 77
Rowland, T. (Ed.) Proceedings of the British Society for Research into Learning Mathematics 21(1) March 2001
From Informal Proceedings 21-1 (BSRLM) available at bsrlm.org.uk © the author - 78
Rowland, T. (Ed.) Proceedings of the British Society for Research into Learning Mathematics 21(1) March 2001
MATHEMATICS AND SOCIETY: A CONTRIBUTION TO FRAME Derek Woodrow Manchester Metropolitan University Colleagues will see from a parallel group that CoPrIME and BSRLM are working towards defining a number of questions which research in mathematics education needs to address. Amongst the collections of issues to be identified are a number drawn together under the heading of Mathematics and Society. This paper will hope to explore some of these foci. The FRAME mathematics and society group has considered concerns such as : • Addressing the standards of inclusion and participation, • Mathematics in educating a modern citizen and issues relating to mathematics as a social gatekeeper • Institutional discrimination from ‘setting and streaming’ and lack of room for individual ‘idiosyncrasy’ • Institutional discrimination relating to various social groups • Inappropriate public images of mathematics and hence ‘effective teaching ‘ in mathematics • Stereotyped public beliefs of certain learning/teaching styles in mathematics • Key skills and perceived needs This paper looks at some of these issues and possible research questions are indicated in the text and presented at the end. Comments are welcome as this agenda is intended to be a developing process. Mathematics has a special place in society, due to its long term traditional importance in all developed societies, and enhanced by its central role in science and engineering (Skovsmose, 2000). The impact of new technologies might eventually cause a reappraisal of its significance. Mathematics is likely to remain an important ingredient in the creation of informed citizenry. There are frequently made statements reporting increased demands on thinking and problem solving skills, many of which are embedded in mathematical thinking. This places mathematics at the centre of any debate about equity and inclusion, increasingly significant issues as the world becomes more ‘global’ and societies more inter-dependent. Mathematics is value–laden, it creates attitudes and assumptions which interact with human discourse and human relationships. It is critical, therefore, in any drive to increase standards of inclusion and participation. These ‘value-standards’ are at least as important as the academic standards at the centre of current education policy initiatives. This is even more vital on the global stage. At the opening session of ICME 9 serious concerns were raised in regard to the increasing technological divide which increasing dependence on the new technologies is likely to create. (Woodrow, From Informal Proceedings 21-1 (BSRLM) available at bsrlm.org.uk © the author - 79
Rowland, T. (Ed.) Proceedings of the British Society for Research into Learning Mathematics 21(1) March 2001
2001; Koblitz, 1996; Dubinsky and Noss, 1996). At a micro-level as well it does indeed increase the distance between those individual pupils with access and those for whom access in unavailable. Failure in mathematics automatically excludes from certain roles in society - a subject like mathematics which divides and tiers pupils from an early age must ensure that such institutional discrimination does not put in place exclusive practices which mitigate against certain groups of pupils. Any mathematics teaching style may serve to exclude those who find other ways of learning more suited to their particular style, and the hierarchical structure of the mathematics curriculum makes it difficult to response to the variable and individual variations in rates of development. Denvir and Brown (1986) showed how idiosyncratic the individual tracks are in the learning of mathematics, and the pace of learning varies as learners develop at different rates at different times. Another form of exclusion takes place through its use in official documentation and the media and the way in which those unable to access the mathematics within such reports feel unable to contribute to discussion and debate. Indeed one effect of general uncertainty about mathematics is not to challenge statistical information and to invest argument presented ‘mathematically’ with unreasonably validity. Borba and Skovsmose, 1997, and Stronach, 2001 explored the ways in which an ‘audit culture’ has set about converting educational values into measurable outcomes to create a market in reputations (‘league tables’, the RAE culture). Its outcomes can be seen in the TTA description of the mathematics which teachers need as that required to read PANDAs and other measures with little intrinsic meaning, provided as a rationale for the QTS tests in numeracy. The varying achievements in education in England of pupils from differing ethnic groups have been well charted by Gillborn and Gipps (1998), Gillborn and Mirza (2000) and Pathak (2000). There is little research in U.K. on the reasons for the differences in attainment by pupils of different ethnic origins. Gillborn and Mirza indicate that for some LEAs Afrikan Caribbean pupils actually perform well at primary level but their performance seems to deteriorate during secondary education, clearly a matter for enquiry. Gillborn and Mirza point out, in passing, that the threetier system of examination in mathematics severely limits the achievement of lower classified groups, disproportionately made up of pupils from non-European ethnic origins. Boaler, Wiliam and Brown (2000) indicate the generally negative effects of ability grouping in mathematics and comment on the social factors which help determine those groups. Mathematics education can encourage inequitable opportunities through the public/social commitment to setting and streaming, persistently ignoring research which demonstrates its ineffectiveness (Harlen, 1997; Boaler et al., 2000). Specific ethnic-origin data for GCSE/A-level needs to be reviewed but the differing preference for mathematics and information technology amongst students can be seen in the UCCA statistics. Of Asian applications to H.E. 30% apply for ‘Mathematics From Informal Proceedings 21-1 (BSRLM) available at bsrlm.org.uk © the author - 80
Rowland, T. (Ed.) Proceedings of the British Society for Research into Learning Mathematics 21(1) March 2001
and I.T'. compared to 12% of the White applicants and 19% of the Black applications. These percentages hide significant details – especially differential gender attraction. Ethnic origin of only Maths applicants is not provided, however the overall figures do suggest that specifically mathematics recruitment is somewhat different. In 2000 the Maths Applicants numbered 3925, comprising 2421 Men and 1504 Women. This represents 1.3% of all men applicants and 0.7% of all women applicants. Oldknow and Taylor (1999) indicate that currently about 25% of the 16-year-old cohort gain high grades in mathematics, but that less than 10% enter for A-level mathematics of whom almost 66% are successful, and indeed about 1% of A-level students actually enter University to study mathematics. Men Women
BlCarrib'n BlAfrikan 17 21 4 9
Bl Other 16 4
Indian 31 11
PakistaniBaBangladesh Chinese 34 30 25 11 10 9
W hite 12 2
Maths. and I.T. Applicants 2000 (% of Ethnic Group)
The continued comparative lack of interest from female members of whatever ethnic origin remains a clear cause for concern since it does represent a reduction in real opportunity and disadvantage. Alongside these concerns for gender and ethnicity there is a rekindling of interest in the effects of social class and poverty; Povey and Boylan (1998), Dunne and Cooper (2000) have written about mathematics and social class in U.K. and Payne and Bidle (2000) in the USA have connected poor achievement with poverty in both schools and pupils home context. Given the more prescriptive curriculum of the National Numeracy Strategy it is important to consider ways of matching teaching to pupils learning styles. The research which does exist tends to show a need for variety of presentation and method. There are issues related to the inclusion of pupils with S.E.N. into a curriculum whose teaching styles may be inappropriate and disadvantageous to their individual needs. There is an ‘old fashioned’ assumption about the skills required by people in modern society – old fashioned in the sense that in many occupations (as in everyday life) the impact of modern technology has changed the knowledge and skills demanded. Different appreciations are now necessary and these need mapping onto the school syllabus to provide an accurate and believable ‘shopping list’ of what young people should be required to learn. Dench et al. (1998) explored employers perceived key skill requirements, but there was confusion between key skills and basic skills. There is a need too to explore employees perceptions. Galbraith and Haines (1999) explored the context of key numeracy skills and found that the use of spreadsheets was more important than other calculation contexts (mental arithmetic, pen and paper methods, calculators, graphic calculators or specialist software). Dench et al. (1998) in a large ESRC project also From Informal Proceedings 21-1 (BSRLM) available at bsrlm.org.uk © the author - 81
Rowland, T. (Ed.) Proceedings of the British Society for Research into Learning Mathematics 21(1) March 2001
found that computer skills were the major influence on pay levels. They found that professional communication, problem solving and verbal skills had some influence but that numerical skills had little influence. Such findings support the major promotion of computer skills launched by the government but provide little support for any extension of the exclusive focus on numeracy to be continued into Key Stages 3 and 4. RQ1: What epistemological and pedagogical criteria drive the design of digital technologies for mathematics education. What is the right ‘balance’ (for whom and when) of what can be done with the technology, and what should be done. What are the variations in pupils’ access to I.T., what are the factors which create these differences and in what ways can they be compensated. RQ2: What are the fundamental social attitudes that all education seeks to encourage and in what ways can mathematics education contribute to those developments. Ways need constructing to describe standards related to wider education principles and objectives (such as inclusion and participation) and the achievements of school mathematics in meeting these standards mapped. Research is needed on the discourses through which to present to the ‘public’ the complex issues relating to learning and teaching of mathematics. RQ3: How can central curricula models be structured to encompass local community priorities for education RQ4: More research is needed to track the individual learning careers of pupils learning mathematics. More research is needed into the reasons for gendered and ethnic group subject choices. RQ5: More research is needed into the reasons why ‘good pass’ GCSE and ‘A’-level students choose not to continue to study mathematics, encompassing attitudes, epistemological beliefs, learning preferences of students and the courses they are given. Changes to the A-level structure need to be monitored for their effects on recruitment to mathematics degree courses. RQ6: Research is needed on the learning styles perceived by pupils as being required in mathematics lessons and the match with their own preferred style. Specific research is needed into whether the NNS enables or makes more difficult the inclusion of pupils with S.E.N. Research is needed on how differences in learning preferences, learning speeds and learning pathways can be enabled within the national curriculum and especially within the National Numeracy Project.
From Informal Proceedings 21-1 (BSRLM) available at bsrlm.org.uk © the author - 82
Rowland, T. (Ed.) Proceedings of the British Society for Research into Learning Mathematics 21(1) March 2001
More analysis is needed on categories of students who benefit or not from the National Numeracy Strategy. RQ7: Further research is needed on the macro and micro hierarchical essentials in learning mathematics. RQ8: What levels of mathematics knowledge, appreciation and attitudes are required at different levels of society to enable it to function without economic disadvantage. In what ways does this knowledge functionally contribute to the economic enterprise. RQ9: Research is needed on the nature of the demands from all the stakeholders in the mathematics curriculum, a clearer assessment of keyskill needs and a mapping of ways in which the mathematics curriculum can support keyskill agendas. REFERENCES Boaler, J., Wiliam, D., and Brown, M. (2000) Student Experiences of Ability Grouping – disaffection, polarisation and the construction of failure. British Educational Research Journal 26, 631-648 Borba M. and Skovsmose O. (1997) The ideology of certainty in mathematics education. For The Learning of Mathematics 17(3) 17-23 Dench, S., Perryman, S., and Giles, L. (1998). Employers Perceptions of Key Skills. (Brighton: Institute for Employment Studies Report 349) Denvir B. and Brown M. (1986) Understanding of number concepts in low attaining 7-9 year olds. Education Studies in Mathematics 17 15-36 and 143-164 Dubinsky E. and Noss R.(1996) Some kinds of computers for some kinds of learning: a reply to Koblitz. Mathematical Intelligencer 18(1) 17-20. Dunne M. and Cooper, B. (2000) Assessing children’s mathematical knowledge: social class, sex and problem solving (Buckingham; Open University.) Galbraith, P.L. and Haines, C.R. (1999) The Key Skills Agenda: Exploring Implications for Mathematics. Submitted to International Journal of Mathematics Education for Science and Technology. Gillborn D. and Mirza H. (2000) Educational Inequality. (London; OFSTED) Gillborn D. and Gipps C. (1998), Recent Research on the Achievements of ethnic Minority Pupils’ (London;OFSTED) Harlen W. and Malcolm H. (1997) Setting and Streaming: a research review. (Edinburgh, Scottish Council for Research in Education) Koblitz, N. (1996) The case against computers in K-13 math education (kindergarten through calculus). Mathematical Intelligencer 18(1) 9-16
From Informal Proceedings 21-1 (BSRLM) available at bsrlm.org.uk © the author - 83
Rowland, T. (Ed.) Proceedings of the British Society for Research into Learning Mathematics 21(1) March 2001
Oldknow A., and Taylor, R. (1999) Engaging Mathematics. London; Technology Colleges Trust Pathak S. (2000) Research Topic Paper 1: Race Research for the Future. (London:DfEE) Payne K.J. and Biddle B.J., (1999) Poor School Funding, Child Poverty and Mathematics Achievement. Educational Researcher, August-September. Povey H. and Boylan M. (1998) Working class students and the culture of the mathematics classroom in the U.K. Proceedings of the 22nd Psychology of Mathematics Education Conference. (Stellenbosch, South Africa, July) Robinson, P. (1999) The Tyranny of League Tables in R.Alexander, P.Broadfoot and D. Phillips Learning from Comparing: new directions in comparative research. Vol 1: Contexts, Classrooms and Outcomes. (Oxford, Symposium Books) Skovsmose, O. (2000) Aporism and Critical Mathematics Education. For The Learning of Mathematics 20(1) 2-8 Stronach I. (2001) Quantifying the qualitative: contemporary fool’s gold. (Manchester, BSRLM Conference, March) drawing on ‘Shouting Theatre in a Crowded Fire’. Evaluation 5(2) pp 173-193. (1999) Woodrow, D. (2001) Cultural Determination of Curricula, Theories and Practices. Pedagogy,Culture and Society. 9(1), 5-27
From Informal Proceedings 21-1 (BSRLM) available at bsrlm.org.uk © the author - 84
Rowland, T. (Ed.) Proceedings of the British Society for Research into Learning Mathematics 21(1) March 2001
ISSUES IN MATHEMATICS TEACHING DEVELOPMENT AND TEACHERS' PROFESSIONAL DEVELOPMENT FRAME Teaching Development Group Strand Compiled by Barbara Jaworski This is a report of a special discussion group held at the BSRLM Day in Manchester on March 3rd 2001, forming a strand of three sessions throughout the day. It was organised by the FRAME Teaching Development Group for discussion of issues arising from a draft document addressing Mathematics Teaching Development and Teachers' Professional Education and Development (McNamara, Jaworski, Rowland, Hodgen, Prestage and Brown, 2001.) FRAME, standing for Formulating a Research Agenda in Mathematics Education, is an initiative undertaken jointly by CoPriME 1 and BSRLM. It has five groups, each working towards a 'chapter' for a proposed document that will present this agenda. The Teaching Development Group is Group 3 of the five2. The draft document (McNamara et al, 2001) will form the basis of the chapter from this group. In addition, the group intends to publish an elaborated version of the current draft later this year (McNamara et al, forthcoming). The purpose of this day strand was to air and discuss issues raised in the draft document. The three sessions, each of one hour, were organised to mirror the structure of the document as follows: Session 1 – Initial Teacher Training (ITT); Session 2 – Continuing Professional Development (CPD); Session 3 – Developing Communities of Inquiry. A major section of the document, on Teachers' Mathematical Knowledge (TMK), was addressed as part of Sessions 1 and 2. The final half hour was a review of the day, with considerations of future directions. The notes which follow are written to provide a flavour of the discussion, rather than to report accurately everything that was said. SESSION 1 – INITIAL TEACHER TRAINING (ITT) Olwen McNamara began by offering questions and issues relating to the ITT section of the document. These questions included the following
1 Committee of Professors in Mathematics Education 2 The others are: 1. Transitions; 2. Curriculum; 4. Learning, Teaching and Assessment; 5. Mathematics and Society From Informal Proceedings 21-1 (BSRLM) available at bsrlm.org.uk © the author - 85
Rowland, T. (Ed.) Proceedings of the British Society for Research into Learning Mathematics 21(1) March 2001
Conceptualising teacher knowledge • What is the relationship between 'academic' subject knowledge and subject knowledge for teaching? • What conceptualisation(s) of teachers' knowledge of mathematics are of practical/strategic use in teacher education? • What view of teacher knowledge and development is implicit in training programmes for the NNS? Indicators of teacher 'effectiveness' • In what ways has the link between subject knowledge and teaching been investigated and against which criteria? Beliefs and attitudes of teachers /student teachers • In what ways can students be enabled to hold on to 'the ideal' when they confront the pragmatic constraints of the classroom? • To what extent is a connectionist teacher identifiable with one with good PCK in Shulman's sense? Models of ITT • What theoretical models and ideological perspectives underpin the new Government flexible routes for ITT? • How 'effective' are the alternative routes? • What particular costs/benefits do they pose for mathematics education? • What models of professionalism are inherent? ITT is too prescriptive and intensive • How can/do we as educators balance the competing demands of individual professional automony and collective state/student entitlement Beliefs/Assessment • What effect does decontextualised testing have on students' attitudes, beliefs and feelings about mathematics? • In what ways can students be enabled to hold on to 'the ideal' when they confront the pragmatic constraints of classroom placements? Mentoring • What different models of mentoring are there? • What criteria are applied to effective mentoring? • How can we address issues of subject mentoring in primary ITT? • How 'effectively' do other 'sharing of best practice models such as AST and leading teachers operate.
From Informal Proceedings 21-1 (BSRLM) available at bsrlm.org.uk © the author - 86
Rowland, T. (Ed.) Proceedings of the British Society for Research into Learning Mathematics 21(1) March 2001
Initial discussion addressed the meaning of 'effectiveness' and the complex range of issues we address when considering where and whether learning and teaching are effective. One focus was on 'target setting'; what are realistic targets to set and who sets them? These include targets for children learning mathematics, and targets for student teachers learning to teach. One person suggested a question to ask is, "how do you connect with 30 people in a room so that someone learns something?" Laurinda Brown offered a definition of effectiveness as "good for" from Maturana and Varela (1987) who "characterise cognition as 'effective action', an action that allows a living being to sustain its existence in a certain environment as it reproduces its world - no more no less" (pages 44-45). From this definition we, as researchers, teachers, and teacher educators, would be paying attention to how students act in their world. The focus would not be on trying to find out what goes on in the students' minds but observing how they act and when this is not effective action supporting them in breaking out into a new way of acting. For instance: - a student has effectively worked with the idea of dividing by a number making the answer smaller until they try to divide by a fractional quantity and are challenged by the answer becoming larger; a student, having previously only met linear proportion, applies this idea to a problem of finding similar areas; - a student teacher responds to a hand up by telling the student in the class what they think the student wants to know and is then greeted by a blank stare. Often in these instances the way through is by action, inviting the student to draw diagrams or use a calculator or look in more detail so that they see more complexity. The use of 'good enough for' in relation to 'effective action' indicates that there are many possible ways of acting which will be effective in the situation and any of them will do. A discussion followed on notions of 'lifelong learning'. With an establishment rhetoric of lifelong learning, how do we reconcile statutory emphases on short term goals and standards, pre-packaged approaches, and content based structures? There are issues of student entitlement with regard to conceptualisation of the curriculum. In evaluating effectiveness we need to ask 'what is evident', and 'what is heard'? Discussion moved onto the language of educational systems versus that of establishment rhetoric. Because language use is very varied, must we define effectiveness relative to differing worlds or discourses? Who controls the language? Is it possible or appropriate to resist government forms of language? What research should we be doing in these areas to become more aware of what we mean by effectiveness of provision for teaching and teacher education? In persuading government of the need for more effective programmes than we have currently, the lack of good recruits to the profession of teaching might be a lever. CONTINUING PROFESSIONAL DEVELOPMENT This was introduced by Jeremy Hodgen, offering questions and issues from the CPD section of the document. Jeremy highlighted difficulties of the broader FRAME 'what we know / don't know' framework within which the document was conceived. This tends to blur disagreements and nuances. What we 'know' is not a neat, uncontested package nor is 'what we don't know' neatly defined by 'what we know'. Moreover, re-reading the From Informal Proceedings 21-1 (BSRLM) available at bsrlm.org.uk © the author - 87
Rowland, T. (Ed.) Proceedings of the British Society for Research into Learning Mathematics 21(1) March 2001
document for the presentation, it felt more authoritative than we perhaps meant. Much of 'what we know' is fragmentary and tentative. However, this is how the document is structured, so the presentation was structured in a similar way: What we 'know' • Teacher change is unpredictable – different teachers change and develop in different ways and teacher education is not a process of 'doing things' to teachers • Long-term CPD is associated with 'effective' teaching • There are problems with the cascade model • Learning communities – teacher change seems to be better thought of as a shared rather than an individual process Research questions (or what we don't 'know') We identified the following broad areas for investigation: • The relationship between teacher change & CPD experiences. • What is distinctive about mathematics teacher education? • What can we learn from the NNS? • Models of CPD – documenting & researching what models of CPD have been used in mathematics education in the UK over the past 20 years. • We know very little about the professional development of teacher educators. Some criticisms of the draft document: The document was written to a very tight deadline and it is inevitable that there are some weaknesses: • There is a danger of adopting a deficit view of teaching, simply seeing the problem in terms of knowledge that teachers don't have. • There is little distinguishing the phases in CPD – what is different about CPD in primary, secondary, adult education? • It is parochial – there is very little about CPD beyond the UK. • The focus is on formal CPD initiatives – with little on teacher change as an informal or continuous process. • Critique of government policy and wider contextual issues is limited. Questions for the discussion: How could we make the document more useful: • to the mathematics education community? • to teacher educators? • to policy makers? • to CPD planners and providers? • to others? Should we structure it in a different way? What is missing? Are the research questions helpful?
From Informal Proceedings 21-1 (BSRLM) available at bsrlm.org.uk © the author - 88
Rowland, T. (Ed.) Proceedings of the British Society for Research into Learning Mathematics 21(1) March 2001
The document lists a number of initiatives in CPD that have taken place over the last 20 years. There was recognition that we need different CPD for different purposes: different purposes need different models. For example, there is a difference between a 20 day course that takes place in 20 consecutive days, and one which is held on one evening a week for two years – as evidenced by the effects on the old M.A. Diploma in Education courses. A cascade model looks very different from a personal involvement model. Derek Woodrow commented, "I once categorised cascades as looking smooth at the top but being rough at the bottom – contrasted with the marsh model where the influence seeps up from the bottom (i.e. the profession) (often smelly?) – and the gusher model where intense professional needs eventually burst up when the pressure is big enough - what we want is a calm sea of quality and competence. (see Open University Occasional Papers No.7 March 1993)" Different models achieve different outcomes. More research into and documentation of models is needed to evaluate their usefulness and impact. For example, cascade models are suggested to be more effective now than when they were used in the 80s. The new green paper 'Schools building on success' reports a 99% satisfaction or better rate for numeracy training. Why is this? What are the changing views and conditions? What is being cascaded? Knowledge? Opportunity? Ways of working? Janet Duffin contrasted a 'cascade model' with a 'personal involvement model' She felt that there was evidence of better progress amongst pupils when a personal involvement model was used and quoted the experience of the CAN project (e.g., Shuard et al, 1991) where personal involvement undoubtedly contributed to children's - and teachers' – success: that is success in number competence in the children, and success in the ability to change on the part of the teachers. She mentioned that there was also evidence in other areas in which educators or researchers have worked closely with teachers. Jeremy Hodgen had referred to a deficit approach to developing teachers. Perhaps if we talk about developing teaching, rather than teachers, we might avoid such a deficit discourse. After all, is professional development not seeking fundamentally to improve the mathematical learning experiences of students in classrooms? We therefore need to concentrate on how teaching can develop. However, what about individual teachers, and their own professional development? If an individual teacher gains substantially from reading and discussing Wittgenstein, can we evaluate the contribution this makes to children's learning in classrooms? Professional development has been available through Diploma or Masters programmes, through which teachers enhance their promotional prospects. Such programmes offer opportunity to study education in its broadest sense, as well as the teaching and learning of school subjects. Sue Sanders commented that taught masters programmes in education have been available widely in the UK for well over 20 years. Little research has been undertaken to explore why teachers choose such courses but it is probable that the increasing number of graduates within the profession and the limited nature of what was called INSET during that time led some teachers to wish to enhance their promotional prospects by gaining a higher degree. What attributes does or should the holder of a masters degree in education possess? Can these be achieved in a CPD-led programme? It would be possible for a From Informal Proceedings 21-1 (BSRLM) available at bsrlm.org.uk © the author - 89
Rowland, T. (Ed.) Proceedings of the British Society for Research into Learning Mathematics 21(1) March 2001
future historian to track government initiatives by examining the changing nature of masters modules. Whilst modules on current issues such as school effectiveness are buoyant, subject specific pathways, particularly in mathematics, attract very small numbers or in some cases none at all. What is the likely impact of this on the study of mathematics education? We may well be overlooking a number of research questions raised by the shift to CPD driven masters programmes. What are teachers' motivations for undertaking masters courses? How has this changed over the last 10 years? Does the CPD element of the modules mean that the nature of the masters course has changed to be only about immediate and measurable outcomes which relate to professional performance? To what extent have masters programmes shifted from a personal development ethos to one of professional development which looks for immediacy of impact within the classroom/school? Do current masters programmes still allow for the advanced study of fundamental theories and questions in education? Is it important that they do? What is the impact of mathematics education as an academic subject if its study at masters level is merely CPD driven? There are also research questions about what it means to be a 'proper professional person'. For example, how can the community produce 'learning teachers'? Teachers' attitudes have developed over the last 15 years. How can we work on these attitudes? The OISE document evaluating the National Numeracy Programme (Earl et al., 2000), indicates that cascade models achieve certain purposes, however, it does not mention purposes NOT addressed by cascade models. Derek Woodrow pointed out that the OISE evaluation clearly signals the need for '… establishing and fostering individual and organisational capacity to respond to changing demands on a recurring basis' (p 27) 'Sustaining improvements in pupil learning will require continued attention to professional development activities…' page 40 'As the strategies move beyond the initial awareness and implementation challenges, it will not be sufficient to have high quality training and strong support from headteachers. In addition, it will be essential to create 'learning cultures' at school level' p40/41. Issues relating to the Green Paper 'Teachers: meeting the challenge of change' (DfEE, 1998) and subsequent initiatives were raised. It was felt that there was a need for a clear policy agenda within mathematics education research. What the paper does not include is what an individual teacher might wish to do for their own personal professional enhancement, rather than, say, what has to be achieved to become a deputy headteacher, or school or OFSTED priorities. There are also issues relating to the impact of initiatives such as the NNS 5-day training and teacher research bursaries. The new Green Paper 'Schools, building on success' does include best practice and individual bursaries proposals para 5.29/30/31 – we might ask for research into their four key words – observing, feedback, coaching and mentoring. There are public relations issues associated with these questions – 'how do we spin what we say'? How can we use language effectively to achieve important goals? On the issue of "spin", Ian Stevenson commented that the government and the mainly right-wing press have been very effective in neutralising the voice of teacher/teacher educators by the "trendy-leftie", "progressive", "child-centred" labels. "It seems to me that rather than rejecting documents such as 'NC for Teacher Training' we should From Informal Proceedings 21-1 (BSRLM) available at bsrlm.org.uk © the author - 90
Rowland, T. (Ed.) Proceedings of the British Society for Research into Learning Mathematics 21(1) March 2001
welcome them as an attempt to define a professional role for teachers while rejecting the 'industrial training' interpretation of competencies. This implies a re-examination of reflective practitioner models for professional development, to show how they can lead to the appropriation of a 'professional role'." Perhaps currently there is much mileage in the 'Best Practice' agenda with individual bursaries for teachers. We need to think how best to exploit this agenda to provide a framework in which teachers and teaching can develop. Perhaps best use of the BPResearch will emerge when it is coordinated into coherent messages for the profession – otherwise significant small messages will be lost. Another current model that was discussed was the NOF (New Opportunities Fund) initiative. The government has allocated £230 million pounds from the New Opportunities Fund to train all serving teachers in ICT so that they are professionally competent/confident to Level 8 in the ICT NC. There are three main areas of 'Expected Outcomes' for the training. First, teachers should develop the knowledge and understanding of the contribution that different aspects of ICT can make in teaching particular subjects (no generic software training). Secondly, they should use ICT for effective planning, including the use of ICT for lesson preparation, and the choice and organisation of ICT resources in whole class teaching and assessment of pupils' learning. Finally, they should use ICT to keep up to date, share best practice and reduce bureaucracy. Ian Stevenson commented that another issue, related to the above, is that the 'Expected Outcomes' document specifies what kinds of outcomes the training should develop. What the research on the integration of ICT into teaching indicates is that introducing technology into teaching 'opens out' the relationship between personal and professional development and makes it visible. Reflective practitioner approaches, built on the assumption that personal development = professional development, close the gap through 'ownership'. What teachers 'own', however, is very variable and difficult to predict. This is a key issue if one has to meet 'outcomes' using a competency model. The NOF training provides a site to examine models of professional development for a large cohort of teachers who are forced to change in specific ways, and, in particular, to examine the relationship between personal and professional development. In his introduction, Jeremy Hodgen had mentioned the parochial nature of the draft document in discussing and addressing the issues of CPD initiatives. To some extent the discussion here had been limited to English models. Members of the group from Scotland and Wales mentioned, briefly, models that differ there from those in England. Sue Sanders commented that in Wales masters programmes are currently funded by HEFCW. This means that there is pressure on Education Departments to register any CPD student at masters level in order to a) gain funding and b) help the university meet its taught masters targets. This is affecting the nature of the modules offered and there is some conflict between teachers' expectations of what they should be required to produce as part of a CPD programme and the University's expectations at masters level.
From Informal Proceedings 21-1 (BSRLM) available at bsrlm.org.uk © the author - 91
Rowland, T. (Ed.) Proceedings of the British Society for Research into Learning Mathematics 21(1) March 2001
DEVELOPING
COMMUNITIES OF INQUIRY (DCI) CRITICAL INTELLIGENCE
This was introduced by Steph Prestage, offering questions and issues from the DCI section of the draft document. Teachers need to be thoughtful, to have insight: i.e. to think and act intelligently. However, policy presents scripts for teaching and algorithms for planning a lesson. We might consider two triangles: The first has the following vertices: Learner
Mathematics
Mediating tool
The second has as its vertices: Learner
Mathematics Teaching
Mediating Tool
And perhaps there is a third, involving Learner
Teacher Educator
Mediating tool
Discussion focused on the meaning of the two/three triangles. What varies seems to be what is being learned in each case; i.e., mathematics in the first case, and mathematics teaching in the second - in the first case, learners are school pupils (or learners of mathematics at any level) and in the second case learners are student teachers. What are the mediating tools that allow such learning to take place? How might teachers or teacher educators think and act intelligently to devise and use such tools? The third case addresses the learning of teacher educators, with questions about the use of mediating tools, and by whom, in teacher-educator learning. The interrelated complexity of these different levels of learning was highlighted through an example: a mathematics classroom consisting of 30 pupils and their teacher who was a student-teacher from a PGCE course. Also present were the regular teacher of the class, and the tutor (teacher-educator) from the university. All were learning from this situation. Some of this learning was implicit, some explicit. For example, the mathematical learning of the students was part of the overt agenda of the classroom. The student teacher used a range of tools to mediate this learning. The learning of the student teacher was both implicit (during the teaching) and explicit during reflection and debriefing with tutor and regular teacher who used meditational tools to effect learning. The learning of the regular teacher and the teacher educator was implicit, except to the extent that each one made it explicit for her/himself through personal reflection and critique. Reflection/critique is a model for professional development that draws on the critical intelligence of the learner within a community of inquiry in which it takes place. Such notions draw attention to the dialectic of individual learner, and learner within society. There was discussion of theoretical notions of communities of practice, and how these might be seen to provide opportunities for development, or overtly to From Informal Proceedings 21-1 (BSRLM) available at bsrlm.org.uk © the author - 92
Rowland, T. (Ed.) Proceedings of the British Society for Research into Learning Mathematics 21(1) March 2001
foster development. There were differing views of such communities, some being defined according to theoretical notions of situated cognition as articulated by Lave and Wenger (1991) and others using the terms much more loosely. In Lave and Wenger's definition, there are issues about legitimate peripheral participation, and the relationships between masters and novices. What constitutes mastery in classroom learning? What is the product to which learners aspire through enculturation into the practice. The difference between communities of practice (CP) and communities of inquiry (CI) was explored. A CI might be seen to be a community in which inquiry, questioning, reflection, discussion of issues etc. is encouraged overtly by the teachers (or teacher educators) in the community. Learners are drawn into practices that involve inquiring into aspects of mathematics (or mathematics teaching). Thus the practice is fundamentally one of inquiry, and the object is the learning of all practitioners. By making such learning explicit at all levels within the community, collaborative learning can result. This does not mean that all learners are learning at the same level, e.g., mathematics, or mathematics teaching, or mathematics teacher educatorliness. However, an openness to such learning across the levels may make it more possible for learners to take responsibility at their own level. An issue was raised about normativity within certain models or practices. If the production or development of norms disadvantages certain members of the community, it can not be regarded as an effective development of practice. Perhaps, for example, students from certain social or cultural backgrounds might find an inquiry aproach one in which they are unable to participate, hence being marginalised. SUMMING UP Tony Brown offered a number of questions to encourage a critical view of the draft document, and the day's discussion of it. • To whom is the draft document being addressed and through what outlet? • Are we addressing complexity or complications? • To what extent is subject knowledge an element of complexity? • What is the discourse from which the questions on subject knowledge arise? • What happens if/when we start from different discourses? • We are not doing scientific research; it is far more complex than that. • Where do we go from here? There was little time for further discussion. Two issues raised were: • The funding of teachers to come to days such as this BSRLM conference; • The education of teacher educators. From Informal Proceedings 21-1 (BSRLM) available at bsrlm.org.uk © the author - 93
Rowland, T. (Ed.) Proceedings of the British Society for Research into Learning Mathematics 21(1) March 2001
I am grateful for the help of a number of colleagues in getting together this compilation of discussion. As well as the members of the authoring team of the draft document (Olwen McNamara, Jeremy Hodgen, Tim Rowland, Stephanie Prestage and Tony Brown), these include particularly Sue Sanders, Laurinda Brown, Derek Woodrow, Ian Stevenson, Tamara Bibby, and Janet Duffin. REFERENCES DfEE (1998) Teachers: meeting the challenge of change. London: HMSO. DfEE (2002) Schools, Building on Success.Cm 5050. Norwich, HMSO Earl, L., Fullan., Leithwood, K., and Watson, N. (2000) Watching and Learning: OISE/UT evaluation of implementation of the National Literacy and Numeracy Strategies, Toronto: Ontario Institute for Studies in Education of The University of Toronto. Lave, J. and Wenger, E (1991) Situated Learning: Legitimate Peripheral Participation. Cambridge: Cambridge University Press. McNamara, O., Jaworski, B., Rowland, T., Hodgen, J., Prestage, P., and Brown, A. (2001) Mathematics Teaching and Teachers' Professional Education and Development. Draft document for the FRAME initiative. BSRLM Web Site; http://www.warwick.ac.uk/BSRLM/ McNamara, O., Jaworski, B., Rowland, T., Hodgen, J., Prestage, P., and Brown, A. (Forthcoming) Mathematics Teaching and Teachers' Professional Education and Development. Maturana, H. R. and Varela, F. J.: 1992 (revised from 1987 edition), The tree of knowledge: The biological roots of human understanding. Boston: Shambhala. Shuard, H., Walsh, A., Goodwin, J. and Worcester, V. (1991) Calculators, Children and Mathematics: The Calculator Aware Number Curriculum. London: Simon and Schuster Whitelegg E., Cooke, H.,and Tresman, S. (eds) (1993) The shape of INSET for teachers of science and mathematics into the next century. Occasional Paper No. 7. Milton Keynes, Centre for Science and Mathematics Education, The Open University
From Informal Proceedings 21-1 (BSRLM) available at bsrlm.org.uk © the author - 94
Rowland, T. (Ed.) Proceedings of the British Society for Research into Learning Mathematics 21(1) March 2001
British Society for Research into Learning Mathematics Geometry Working Group Convenor: Keith Jones, University of Southampton, UK
GEOMETRY AND PROOF A report based on the meeting at Manchester Metropolitan University, 3rd March 2001
Keith Jones and Melissa Rodd University of Southampton and University of Leeds Is Euclidean geometry the most suitable part of the school mathematics curriculum to act as a context for work on mathematical proof? This paper examines some of the issues regarding the teaching and learning of proof and proving specifically in relation to Euclidean geometry. INTRODUCTION Up to the late 1950s, Euclidean geometry was regarded as the place in the school mathematics curriculum where students learnt proofs and were introduced to the axiomatic structure of mathematics. The other parts of the mathematics curriculum (number and algebra, at that time) were less concerned with such matters. In the wake of the launch of the Sputnik by the Soviets in 1957, a major revision of school mathematics (and science) was begun in most western countries (see Moon, 1986, for a general account and Howson, 2000 or Jones, 2001 for the impact on geometry). One of the reform ideas was to base much more of school mathematics on a set theoretic foundation, reflecting the emphasis in university mathematics at that time: maths was to be ‘modern’. From this base, it was natural to introduce functions in school mathematics which lead to calculus and linear algebra. In the UK these major changes were in the ‘O’ level (or equivalent) syllabuses, catering for about 25% of school pupils at age 16. The room for this innovation was made by reformulating all parts of the mathematics curriculum, but the practical effect was to reduce the study of solid geometry and to convert the trigonometry component into part of a course about functions. The impact of these changes was to reduce the overall amount of geometry while, at the same time, increasing the emphasis on coordinate geometry and introducing some elements of transformation geometry and topology. One consequence of these changes was that geometric proof was allocated proportionally much less curriculum time than in previous eras. Subsequently, curricula were developed that required proof and proving to permeate the whole mathematics curricula (examples of the latest versions of such curricula include the National Curriculum for England: Mathematics (DfEE, 1999) and the Standards for School Mathematics published by the US National Council of Teachers of Mathematics (NCTM, 2000)). In the UK, with the advent of GCSE in 1986, curriculum reformers were cautious about requiring deductive-style proof from the From Informal Proceedings 21-1 (BSRLM) available at bsrlm.org.uk © the author - 95
Rowland, T. (Ed.) Proceedings of the British Society for Research into Learning Mathematics 21(1) March 2001
majority of pupils and the emphasis moved to the communication of mathematical reasoning rather than production of Euclidean-style proofs. With the introduction, in England and Wales, of the National Curriculum in 1989 the issue of mathematical reasoning and justification became channelled into the attainment targets ‘Using and applying mathematics’. Explicit requirements to prove, in a traditional mathematical sense, were specified for the very highest attainers, but it is possible that these did not demand a priority in teaching. A consequence was that the main experience of proof for new mathematics undergraduates was during their A-level studies prior to University and, in the main, this was probably fairly limited. This provoked reactions from those who teach mathematics to undergraduates. In the UK, a publication spearheaded by the London Mathematical Society (LMS, 1995), a major professional association in the UK for pure mathematicians, complained about the lack of emphasis on proof in the curriculum, (as well as other things), despite the school curriculum specification that mathematical reasoning should be taught. In the US the debate (about school mathematics in general) has been so heated and, at times, acrimonious, that it has become known as the “math wars” (see, for example, Schoen et al, 1999). In terms of the geometry curriculum, there have been several calls for Euclidean-style geometry to be reinstated as a major component of school mathematics and for this to be where students gain their experience of proof and proving (see, for example, McClure, 2000, or Wu, 1996). The purpose of this paper is to review these arguments for the reinstatement of Euclidean geometry and examine some of the issues regarding the teaching and learning of proof and proving. PROOF IN EUCLIDEAN GEOMETRY McClure (2000) considers Euclidean-style geometry to be the best place to begin “a student’s serious mathematical training” (p45) because: •
It involves familiar objects that can be thought about both visually and verbally
•
The statements it makes about these objects are readily intelligible and frequently dramatic
•
The logical methods involved tend to be less subtle than those in other introductory parts of mathematics; for example, they involve fewer quantifiers
•
It is possible to do serious mathematical learning in this subject without having a perfect understanding of what axiomatic systems are and what the rules are for working with them
McClure’s interest is mathematics undergraduates, rather then school students, and he goes on to contrast geometry in the Euclidean tradition as a place to learn about proof and proving with other areas of the undergraduate mathematics curriculum, including analysis and linear algebra. In both cases he suggests that geometry in the Euclidean tradition is superior in this context. In analysis he maintains that the mathematical objects (such as limit) can only be approached by means of subtle definitions that From Informal Proceedings 21-1 (BSRLM) available at bsrlm.org.uk © the author - 96
Rowland, T. (Ed.) Proceedings of the British Society for Research into Learning Mathematics 21(1) March 2001
involve the careful use of quantifiers. In linear algebra he suggests that the proofs are too sophisticated and deal with unfamiliar objects (such as a subspace) that rely on formal definitions. Wu (1996) is similarly convinced that geometry in the Euclidean tradition is a place to learn about proof and proving but this time the focus is high school mathematics. The argument is that Euclidean-style proofs are often short, only require a few concepts (angle, line segment, etc.), are supported by a visual prop, and are quite formal in structure. Wu maintains that the only other topic available for this purpose is the real number system but claims that “anyone who has ever gone through a development of the real number system, starting from the Peano axioms or the axioms of a complete ordered field, would know that this alternative is fraught with perils. …. Moreover, the discussion would soon be dominated by continuity considerations and they are definitely out of the reach of the 10th and 11th graders ” (p227-228). DIFFICULTIES WITH PROOF IN EUCLIDEAN GEOMETRY Both McClure and Wu are University mathematicians. While McClure restricts himself to University mathematics (and outlines how Euclidean-style proofs can provide a good ‘bridging’ course for first year mathematics undergraduates), Wu ventures into school mathematics. Neither Wu nor McClure discuss the fact that a school geometry curriculum dominated by proofs in the Euclidean tradition has been tried in the past and been found to be wanting. As Howson (2000) writes, ““Euclidstyle” geometry [was] found extremely difficult (and often uninteresting) by most [school] students”. He quotes Tammadge reporting on his experiences as an examiner of the top 20% or so of English students: “Only a small percentage of candidates attempted questions on this topic and they normally regurgitated the theorem and collapsed when it came to the rider [i.e. a request to prove a corollary to the theorem]”. In similar terms, past research studies by Williams (1980) or by Senk (1985) provide evidence across a wide range of schools of how little those pupils who followed such a geometry curriculum could do at the end of their course. Such were the failures of attempts to teach such a proof-dominated geometry curricula that in 1980 Usiskin, a well-known and highly-respected curriculum developer, famously wrote, “If proof were a new idea with which we were experimenting, too few would experience success to make the idea last” (Usiskin, 1980 p427). The reasons for this lack of success in teaching proof are numerous (for a recent review, see Dreyfus, 1999). Research studies have invariably shown that students fail to see a need for proof because all too often they are asked to prove things that are obvious to them. Students also fail to distinguish between different forms of mathematical reasoning such as heuristic or argument, explanation or proof. A major gap in the research literature is how little is known about how children can be supported in shifting from “because it looks right” or “because it works in these cases” to convincing arguments which work in general. From Informal Proceedings 21-1 (BSRLM) available at bsrlm.org.uk © the author - 97
Rowland, T. (Ed.) Proceedings of the British Society for Research into Learning Mathematics 21(1) March 2001
TEACHING AND LEARNING PROOF There is some current research that may indicate positive ways forward. A range of work, such as that by de Villiers (1999) and by Hanna (1998), is suggesting that increasing the emphasis on one of the major functions of proof, that of explanation, is central to learners’ success in learning to prove. Giving explanation a higher profile, it is claimed, should help teachers connect with students’ reasoning and guard against the students experiencing learning to prove as no more than a ritual determined by the teacher. However, mathematical proof is more structurally specific than a general explanation. In particular, learning to prove involves learners taking on this precise form of reasoning as their own (Rodd, 2000: 236) such that they tend to require proof-like explanations in order to become convinced. In addition, the availability of new tools, especially computer tools such as dynamic geometry software, also has implications for the way proof and proving can be taught and learnt (see, for example, Mogetta et al, 1999, but see Hoyles and Jones 1998 for some cautionary remarks). Proof and proving can also be met in other parts of the mathematics curriculum (see Tall, 2000, or Rodd and Monaghan, 2001). In the current version of the National Curriculum for England (DfEE 1999), the programmes of study include geometrical reasoning as well as a reasoning component of the ‘Using and applying’ attainment target. Even at the ‘foundation’ level at Key Stage 4 (for the lower attaining 14-16 year olds), students are to be taught to distinguish between practical demonstrations and proofs and to show stepby-step deduction in solving a geometrical problem (DfEE 1999:78). For teachers teaching this, or a similar, curriculum, the challenge is to develop teaching methods which do not turn pupils off or get them solely to learn by rote (as appears to have been the case in the past). This will certainly require new pedagogical approaches which are likely to involve technology like dynamic geometry, as well as discursive methods of engagement and methods of assessment which reduce the pressure to rote learn. CONCLUDING COMMENTS Proof and proving are, of course, central to all mathematics. In terms of school mathematics, the NCTM standards (ibid) state that “Reasoning and proof are not special activities reserved for special times or special topics in the curriculum but should be a natural, ongoing part of classroom discussions, no matter what topic is being studied”. They go on to suggest that “in mathematically productive classroom environments, students should expect to explain and justify their conclusions. When questions such as, What are you doing? or Why does that make sense? are the norm in a mathematics classroom, students are able to clarify their thinking, to learn new ways to look at and think about situations, and to develop standards for high-quality mathematical reasoning”. This sort of language is consonant with what is known about how to teach mathematical reasoning in general, and proof and proving in
From Informal Proceedings 21-1 (BSRLM) available at bsrlm.org.uk © the author - 98
Rowland, T. (Ed.) Proceedings of the British Society for Research into Learning Mathematics 21(1) March 2001
particular. It suggests that an atmosphere of collective classroom enquiry is important generally. The NCTM standards also observe that, “Reasoning and proof cannot simply be taught in a single unit on logic, for example, or by ‘doing proofs’ in geometry”. Perhaps students at the tertiary level find proof so difficult because their previous experience is limited. If mathematical reasoning was a consistent part of students’ mathematical experience throughout the school years, then students might become accustomed to this way of thinking. Both in the UK and in the US mathematical reasoning – not just mathematical techniques or results – is considered important for all students. Nevertheless, unless teaching methods can be developed to engage all, there is a real danger of returning to the situation of non-comprehension to which Howson (ibid) refers. REFERENCES Department for Education and Employment: 1999, The National Curriculum for England: Mathematics. London: DfEE and QCA. de Villiers, M.: 1999, Rethinking Proof with Geometer's Sketchpad. Emeryville, CA, Key Curriculum Press. Dreyfus, T.: 1999, Why Johnny can’t prove, Educational Studies in Mathematics 38, 85-109. Howson, G. 2000, Geometry 1950-1970. Plenary presentation at the International Symposium: One Hundred Years of L'Enseignement Mathématique: Moments of Mathematics Education in the 20th Century, Geneva, 20-22 October 2000. To appear in a Monograph de l’Enseignement Mathématique. Hanna G. 1998, Proof as understanding in geometry, Focus on Learning Problems in Mathematics, vol. 20, No. 2&3, 4-13. Hoyles, C. and Jones, K. 1998, Proof in dynamic geometry contexts, in C. Mammana and V. Villani (eds.), Perspectives on the Teaching of Geometry for the 21st Century: an ICMI study. Dordrecht, Kluwer. Jones, K.: 2001, Issues in the teaching and learning of geometry. In Linda Haggarty (Ed), Aspects of Teaching and Learning Mathematics, Milton Keynes, Open University Press. London Mathematical Society, Institute of Mathematics and Its Applications, & The Royal Society: 1995, Tackling the Mathematics Problem. London: London Mathematical Society. Mogetta, C., Olivero, F. and Jones K.: 1999, Providing the motivation to prove in a dynamic geometry environment. Proc. of the British Society for Research into Learning Mathematics, St Martin’s University College, Lancaster, 1999, pp91-6. Moon B.: 1986, The “New Maths” Curriculum Controversy: An international story, London : Falmer Press.
From Informal Proceedings 21-1 (BSRLM) available at bsrlm.org.uk © the author - 99
Rowland, T. (Ed.) Proceedings of the British Society for Research into Learning Mathematics 21(1) March 2001
National Council of Teachers of Mathematics (2000), Principles and Standards for School Mathematics. Reston, Va.: National Council of Teachers of Mathematics. McClure, J. E.: 2000, Start where they are: Geometry as an introduction to proof, American Mathematical Monthly, 107(1), 44-52. Rodd, M. M.: 2000, On mathematical warrants, Mathematical Thinking and Learning, 2(3), 221-244. Rodd, M. M. and Monaghan, J.: 2001, School mathematics and mathematical proof, In Linda Haggarty (Ed), Aspects of Teaching and Learning Mathematics, Milton Keynes, Open University Press. Schoen, Harold L., Fey, James T., Hirsch, Christian R. and Coxford, Arthur F.: 1999, Issues and Options in the Math Wars. Phi Delta Kappan. 80(6), 444-453. Senk S. L. 1985, How well do students write geometry proofs? Mathematics Teacher, 78(6), 448-456. Tall, D.: 2000, The Cognitive Development of Proof: Is Mathematical Proof For All or For Some? Developments in School Mathematics, Vol 4. Williams, E.: 1980, An investigation of senior high school students’ understanding of the nature of mathematical proof, Journal for Research in Mathematics Education, 11, 165-166. Usiskin, Z. 1980, What should not be in the algebra and geometry curricula of average college-bound students?, Mathematics Teacher, 73(6), 413-424. Wu, H.-H.: 1996, The role of Euclidean geometry in high school, Journal of Mathematical Behavior, 15, 221-237. BSRLM Geometry Working Group The BSRLM geometry working group focuses on the teaching and learning of geometrical ideas in its widest sense. The aim of the group is to share perspectives on a range of research questions that could become the basis for further collaborative work. Suggestions of topics for discussion are always welcome. The group is open to all. Contact: Keith Jones, University of Southampton, Centre for Research in Mathematics Education, Research and Graduate School of Education, Highfield, Southampton, SO17 1BJ, UK. e-mail:
[email protected] tel: +44 (0)23 80 592449 fax: +44 (0)23 80 593556
From Informal Proceedings 21-1 (BSRLM) available at bsrlm.org.uk © the author - 100