Empirical Investigations
Validating Lung Models Using the ASL 5000 Breathing Simulator Amanda Dexter, MS, RRT, CHSE; Neil McNinch, MS, RN; Destiny Kaznoch; Teresa A. Volsko, MBA, MHHS, RRT, CMTE, FAARC
Objective: This study sought to validate pediatric models with normal and altered pulmonary mechanics. Methods: PubMed and CINAHL databases were searched for studies directly measuring pulmonary mechanics of healthy infants and children, infants with severe bronchopulmonary dysplasia and neuromuscular disease. The ASL 5000 was used to construct models using tidal volume (VT), inspiratory time (TI), respiratory rate, resistance, compliance, and esophageal pressure gleaned from literature. Data were collected for a 1-minute period and repeated three times for each model. t tests compared modeled data with data abstracted from the literature. Repeated measures analyses evaluated model performance over multiple iterations. Statistical significance was established at a P value of less than 0.05. Results: Maximum differences of means (experimental iteration mean clinical standard mean) for TI and VT are the following: term infant without lung disease (TI = 0.09 s, VT = 0.29 mL), severe bronchopulmonary dysplasia (TI = 0.08 s, VT = 0.17 mL), child without lung disease (TI = 0.10 s, VT = 0.17 mL), and child with neuromuscular disease (TI = 0.09 s, VT = 0.57 mL). One-sample testing demonstrated statistically significant differences between clinical controls and VT and TI values produced by the ASL 5000 for each iteration and model (P < 0.01). The greatest magnitude of differences was negligible (VT < 1.6%, TI = 18%) and not clinically relevant. Conclusions: Inconsistencies occurred with the models constructed on the ASL 5000. It was deemed accurate for the study purposes. It is therefore essential to test models and evaluate magnitude of differences before use. (Sim Healthcare 00:00–00, 2018)
Key Words: Pediatric, infant, pulmonary mechanics, bronchopulmonary dysplasia, neuromuscular disease, simulation, physiologic modeling.
L
aboratory evaluations are often used to examine ventilator performance because simulated models of the respiratory system carry no risk of harm and are less cumbersome to work with than using humans or animals to evaluate medical devices.1–3 Unlike human subjects, whose disease condition may worsen or improve over short or long periods, the pulmonary characteristics of models do not vary. Therefore, during ventilator performance evaluations, any differences in the observed measurements are presumed to be related only to ventilator performance and not secondary to changes in the load imposed on the mechanical ventilator during its interaction with the patient.
From the Respiratory Care Program (A.D.), Rush University, Chicago, IL; Department of Kinesiology (A.D.), University of North Carolina at Charlotte, Charlotte, NC; Rebecca D Considine Research Institute (N.M.), Akron Children's Hospital, Akron; Kent State University (D.K.), Kent; and Nursing Administration (T.A.V.), Akron Children's Hospital, Akron, OH. Reprints: Teresa A. Volsko, MBA, MHHS, RRT, CMTE, FAARC, Department of Nursing Administration, Akron Children's Hospital, Akron, OH 44308 (e‐mail:
[email protected]). A.D. was formerly employed as a clinical educator for Ingmar Medical, the manufacturer of the ASL. This work was a component of her graduate thesis work at Rush University and completed in May of 2013, before her employment at Ingmar. The manuscript, based on this work, commenced after A.D. left Ingmar Medical for a position in academia. Ingmar Medical did not have a role in this study or in her graduate work. The work was completed at Akron Children's Hospital under the mentorship of T.A.V., who does not have a relationship with Ingmar Medical. D.K.'s involvement was sponsored by the Summer Pediatric Research Student Program (SPRS), at Akron Children's Hospital. T.A.V. served as the SPRS mentor but received no compensation for the role. N.M. discloses no conflicts of interest. Presented at the American Association for Respiratory Care (AARC) International Congress, November 17, 2013, Anaheim, CA. Copyright © 2018 Society for Simulation in Healthcare DOI: 10.1097/SIH.0000000000000277
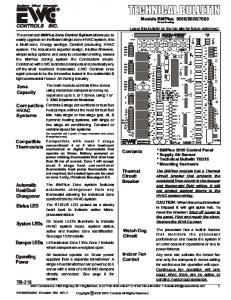
The ASL 5000 lung simulator (IngMar Medical, Pittsburgh, PA) has been used to evaluate ventilator performance and demonstrate differences in operational characteristics.4 This simulator uses a computer-driven piston to displace volume. The piston is controlled by the equation of motion, which enables the user to input values for airways resistance and pulmonary compliance to construct either a single- or double-compartment lung model (Fig. 1). The ASL 5000 can simulate passive, or no respiratory effort, and active breathing. The latter is accomplished by modeling the muscle pressure (PMUS) waveform in addition to setting the resistance and compliance for the model. A dearth of information exists in the literature using simulation to construct and validate pediatric models based on actual pulmonary mechanics in health and with pulmonary pathophysiology. Different disease states impose varying conditions of load, which can affect the manner in which respiratory equipment operates or interacts with the patient. Conditions that increase load include (1) increased airways resistance, (2) decreased compliance, (3) increased respiratory rate (RR), and (4) abnormalities in chest wall compliance. There is a need to construct and validate infant and pediatric normal and disease state models to identify whether changes in ventilator performance and/or patient-ventilator interaction will occur under varying pulmonary conditions. The purpose of this study was to construct and validate four neonatal and pediatric models. We hypothesized that the ASL 5000 will validate a simulated model for a term infant without lung disease, infant with severe bronchopulmonary
Vol. 00, Number 00, Month 2018
Copyright © 2018 by the Society for Simulation in Healthcare. Unauthorized reproduction of this article is prohibited.
1
FIGURE 1. Equation of motion. PTR(t) is the change in transrespiratory pressure, or difference between the airway opening pressure and body surface pressure as a function of time (t).This pressure is measured relative to end-expiratory airway pressure and is the pressure generated by a ventilator during an assisted breath. PMUS(t) is ventilatory muscle pressure, or the difference as a function of time (t); the theoretical chest wall transmural pressure difference that would produce movements identical to those produced by the ventilatory muscles during breathing maneuvers (positive during inspiratory effort, negative during expiratory effort. R and C are the resistance and compliance of the respiratory system.
dysplasia (BPD), child without lung disease and child with neuromuscular disease.
METHODS The ASL 5000 was used to construct and validate the pulmonary mechanics and spontaneous effort models for a term infant and child with normal lung function (healthy controls) and two disease states: infant with severe BPD and child with neuromuscular disease (Table 1). This study was independently conducted, without affiliations with the manufacturer of the ASL 5000. Although there are models available on the Ingmar Medical Web site for use with their lung simulator, the models created and validated in this study predated those currently available with the manufacturer.
PubMed and CINAHL databases were used to perform a literature search of human trials in which pulmonary mechanics were measured in infants and children without lung pathology, infants with severe bronchopulmonary dysplasia, and pediatric patients with neuromuscular disease and respiratory compromise. Key words used in the search included the following: human, English language, age of neonate to 18 years, simulation, biological models, respiratory mechanics, bronchopulmonary dysplasia, neuromuscular, mechanical ventilation, medical education, respiratory insufficiency, and airways resistance. The search returned a total of 186 results, of which 15 were relevant to the populations of interest and purposes of this study. There were two references specifically for the controls (term infant and child without lung disease), two directly related to bronchopulmonary dysplasia, and one
TABLE 1. A Description of the 4 Lung Models Tested, and the Type of Load Each Respective Model Would Impose During a Respiratory Device Evaluation Model
Description
Term infant without lung disease Infant with severe BPD
Child without lung disease Child with neuromuscular disease
2
Validating Lung Models
A baby born anytime between weeks 39 and 40 with no health-related risks. Chronic lung disease in infants, which is a common cause of respiratory insufficiency and ventilator dependence in children born prematurely. An infant 12 mo old with no health-related risks. Impairment of the central or the peripheral nervous system, which may require mechanical ventilatory assistance.
Load
No load Decreased compliance and increased pulmonary resistance increase the infant's work of breathing. No load A highly compliant chest wall is unable to endure the negative pressures generated during inspiration and may collapse inward causing inconsistent or asynchronous motion of the rib cage and abdomen, causing an increased work of breathing.
Simulation in Healthcare
Copyright © 2018 by the Society for Simulation in Healthcare. Unauthorized reproduction of this article is prohibited.
TABLE 2. The Physical Characteristics of Normal and Disease State Models Based on Demographic and Anthropometric Measures Reported in the Literature Model 5–7
Term infant without lung disease Infant with severe BPD7–9 Child without lung disease5–7 Child with neuromuscular disease7,10
Model Description
Age
Weigh, kg
Normal Disease state Normal Disease state
Newborn 2 wk 12 mo 12 mo
3.8 3.8 10.0 9.0
for neuromuscular disease. The remainder supported all models and/or study concepts. Characteristics of the respiratory system were gleaned from the literature and used to create each of the simulated models. These published reports provided a direct measurement of lung compliance and pulmonary conductance, inspiratory and expiratory flows, esophageal pressure, and functional residual capacity, which were used to construct the models. The age and weight characteristics of each simulated lung model were obtained from the Centers for Disease Control (CDC). For the term infant and child without lung disease models, weights for males and females were obtained using the CDC growth chart at 50% of the growth curve. The CDC growth chart was also used for the infant with severe BPD and child with neuromuscular disease models; however, weights for the disease state models were obtained at 25% of the growth curve, which correlated with anthropometric measures reported in the literature. Table 2 specifies the age and weight characteristics of each model. Table 3 outlines the tidal volume (VT), inspiratory time (TI), RR, airways resistance, and pulmonary compliance gleaned from patient characteristics reported in published clinical trials and used to construct each model. Muscle pressure is not typically measured in humans but was a necessary component to the script, because it was used to produce the desired VT for each of the models. Esophageal pressure provided the initial starting point for PMUS, after which adjustments to PMUS were made as needed to produce active breathing at the target VT for each model. The characteristics for each model were entered into the ASL 5000 simulation editor using a single-compartment lung model. Figure 2 illustrates the compartment settings used for the child with neuromuscular disease model. The breath configurations for each of the models of interest were manually scripted or individually programmed. Active breathing was simulated by adjusting PMUS on the ASL 5000 to produce the target VT of 7 mL/kg. The term infant and child without lung disease served as the healthy control models, which did not impose extra load during ventilatory assistance.5–7,11,12 Infant with severe BPD7–9,12–16 and child with neuromuscular disease7,10,12,17,18 were the two experimental (disease state) models that imposed
a load on respiratory equipment. The control and experimental models were individually scripted and tested (Table 4). The increase % and release % settings were adjusted to sculpt the breath with the intention of achieving a sinusoidal breath pattern and an TI, which met the specifications of the desired targets for each of the models. Before initiating the study protocol, the calibration procedure for the simulator was performed in accordance with manufacture recommendations. Before collecting data, each model ran for a 2-minute period to allow for piston stabilization. Data were then collected for a 1-minute period. This procedure was repeated three times for each model. Although the ASL 5000 provided several data output values, the variables of interest for this validation study were VT and TI. Data from the ASL 5000 were reviewed in the postrun analysis section of the software. Using the utilities option, data were exported to Excel (Microsoft, Redmond, CA) for management and SAS (Version 9.3; SAS Institute Inc, Cary, NC) for analysis. Statistical Analysis The primary outcomes of interest (VT, TI) obtained from the ASL 5000 were compared with data abstracted from the literature by a one-sample t test. Follow-up testing was performed using Wilcoxon signed rank test to account for departures from normality, with similar findings noted. For repeated measures of primary variables of interest, the Friedman test with post hoc multiple pairwise comparisons was used to assess for differences between each of the experimental iterations, for each model. Statistical significance was established at a P value of less than 0.05, unless otherwise noted. Post hoc assessment of clinical relevance, as it relates to statistical significance, was completed once all results were available.
RESULTS One-sample testing revealed evidence of statistically significant differences between published characteristics or the clinical standard used in this study and values produced by the ASL 5000 (VT and TI) for each iteration and model (P < 0.01 for all). The maximum differences of means (experimental iteration mean − clinical standard mean) are the following: term infant without lung disease (TI = 0.09 s, VT = 0.29 mL), infant with severe BPD (TI = 0.08 s, VT = 0.17 mL), child without lung disease (TI = 0.10 s, VT = 0.17 mL), and child with neuromuscular disease (TI = 0.09 s, VT = 0.57 mL). The maximum difference of means in VT noted for all models was less than 1.6% of the scripted values. The maximum difference
TABLE 3. Characteristics of the Respiratory System Gleaned From the Literature and Used to Create Each of the Simulated Models for the Validation Study Model (Patient Weight in kg)
VT, mL
RR Mean (Range) Breaths per Minute
TI, s
Inspiratory Resistance, Mean (Range), cmH2O/L/s
Expiratory Resistance, Mean (Range), cmH2O/L/s
Term infant without lung disease (3.8 kg)5–7,11,12 Infant with severe BPD (3.8 kg)7–9,12–16 Child without lung disease (10 kg)5–7,11,12 Child with neuromuscular disease (9 kg)7,10,12,17,18
26.6
50 (40–60)
0.5
52 (44–94)
70 (45–149)
7.5 (4–11)
23.4
60 (60–80)
0.4
69 (44–94)
87 (80–140)
1.8 (0.88–3)
70.0
25 (22–28)
0.8
46 (29–63)
46 (29–63)
15.0 (12–17)
7 (6–9)
37.8
25 (22–28)
0.8
46 (29–63)
46 (29–63)
14.5 (12–17)
7 (6–9)
Vol. 00, Number 00, Month 2018
Compliance, Mean (Range), mL/cmH2O
Esophageal Pressure, Mean (Range), cmH2O
7 (6–9) 11.5 (10–12)
© 2018 Society for Simulation in Healthcare
Copyright © 2018 by the Society for Simulation in Healthcare. Unauthorized reproduction of this article is prohibited.
3
FIGURE 2. An illustration of setting the resistance and compliance for the single-compartment lung model representing a child with neuromuscular disease. Rin and Rout represent airways resistance during inspiration and expiration, respectively. C represents pulmonary compliance.
of means in TI ranges was 18% for all models. Table 5 provides the summary statistics by model and iteration. The Friedman test results provided strong evidence of an overall difference in VT and TI for the infant with severe BPD model (P < 0.01 for both) and evidence of an overall difference in TI for the child with neuromuscular disease model (P = 0.03). There were no statistically significant differences in the term infant without lung disease or child without lung disease models for TI and VT (P = 0.3, 0.1, 0.9, and 0.7, respectively). Table 6 provides results of Friedman test along with Tukey multiple pairwise comparisons for each of the models. Post hoc analysis of Friedman test with multiple pairwise comparisons using Tukey adjusted α demonstrated statistically significant differences for VT between the first and second iterations (difference of medians = 0.01 mL), as well as the first and third iterations (difference of medians = 0.02 mL) in the infant with severe BPD model. Inspiratory time was significantly different, in the infant with severe BPD model, between the first and third iterations (difference of medians = 0.01 s) as well as between the second and third iterations (difference in medians < 0.01 s). In the child with neuromuscular disease model, TI was significantly different between the first and third iterations as well as between the second and third iterations (difference in medians < 0.01 s for both).
DISCUSSION Simulation studies are often used to examine device performance using models of the respiratory system19 because they carry no risk of harm and, compared with using humans or animals, are less cumbersome to work with. However, if the
simulated model is unable to consistently replicate the model characteristics, it is difficult to distinguish whether the differences in the variables of interest were due to inconsistencies in the model or differences in the operational characteristics of the devices evaluated. This study used the ASL 5000 lung simulator. The precision with which this simulator can produce consistent results is dependent on the lack of variation with which the piston moves within the casing. This variation is most likely to occur between experimental iterations.20 Therefore, time or the number of repeated iterations of each model was an important factor to consider when validating a simulated model. Repeating each script more than once enabled the researchers to determine whether the ASL 5000 was able to produce consistent breath characteristics over repeated iterations. Once the model was scripted, simulator calibration and a stabilization period were the essential steps performed before collecting our data. Although the ASL 5000 was calibrated before use and a stabilization period was provided, there exists the potential for variation in piston movement, which can affect results. A 2-minute stabilization period was used to prevent any initial disruption in piston motion, which may occur as the script was initializing, from contaminating data collection. The 2-minute period was chosen from our previous experience modeling disease states and using pediatric models to evaluate respiratory equipment.19–22 The ASL 500 has a 500-Hz sampling rate. Based on this sampling rate and our previous experience with device evaluation using simulated models, a 1-minute data collection period was considered sufficient to obtain respiratory breath data.19–22 With respect to this study, the inconsistencies or variation in VT
TABLE 4. A Script of the Pulmonary Characteristics of Each Model Used in the Validation Study
Model (Weight in kg)
Increase %* Release %*
Term infant without lung disease (3.8 kg) Infant with severe BPD (3.8 kg) Child without lung disease (10 kg) Child with neuromuscular disease (9 kg)
Pmax, cmH2O
Inspiratory Expiratory Uncompensated Resistance, Mean, Resistance, Mean, Compliance, Mean, Spontaneous Rate, mL/cmH2O Breaths per Minute Residual Capacity, mL cmH2O/L/s cmH2O/L/s
42
42
9.8
52
70
7.5
50
50
41 25
41 25
16.5 9.0
69 46
87 46
1.8 15.0
60 25
50 177
25
25
5.0
46
46
14.5
25
207
*“Increase %” and “release %” settings were adjusted to sculpt the breath and obtain a sinusoidal breath pattern. The settings reported were those used to produce an TI that most closely resembled the TI reported in the literature, for each of the models.
4
Validating Lung Models
Simulation in Healthcare
Copyright © 2018 by the Society for Simulation in Healthcare. Unauthorized reproduction of this article is prohibited.
TABLE 5. Summary Statistics by Model and Iteration, With One-Sample t Test Results Iteration
Variable
Term infant without lung disease 1 I time, s Insp VT, mL 2 I time, s Insp VT, mL 3 I time, s Insp VT, mL Infant with severe BPD 1 I time, s Insp VT, mL 2 I time, s Insp VT, mL 3 I time, s Insp VT, mL Child without lung disease 1 I time, s Insp VT, mL 2 I time, s Insp VT, mL 3 I time, s Insp VT, mL Child with neuromuscular disease 1 I time, s Insp VT, mL 2 I time, s Insp VT, mL 3 I time, s Insp VT, mL
n
Mean
SD
Median
Min
Max
Test Location
One-Sample t Test, P
53 53 55 55 51 51
0.59 26.88 0.59 26.86 0.59 26.89
0.02 2.81 0.02 2.75 0.02 2.87
0.59 26.48 0.59 26.46 0.59 26.46
0.58 26.42 0.58 26.43 0.58 26.41
0.72 46.88 0.72 46.88 0.72 46.93
0.50 26.60 0.50 26.60 0.50 26.60