Validating the SUE Inspection Technique A. De Angeli*, M. Matera+, M.F. Costabile°, F. Garzotto+, P. Paolini+ * Dipartimento di Psicologia, Università di Trieste, Italy +
Dipartimento di Elettronica e Informazione, Politecnico di Milano, Italy ° Dipartimento di Informatica, Università di Bari, Italy
[email protected], {matera, garzotto, paolini}@elet.polimi.it,
[email protected]
ABSTRACT In the usability inspection of complex hypermedia a great deal is left to the skills, experience, and ability of the inspectors. The SUE inspection technique has been proposed to help usability inspectors share and transfer their evaluation know-how, make easier the hypermedia inspection process for newcomers, and achieve more effective and efficient evaluations. The SUE inspection is based on the use of evaluation patterns, called Abstract Tasks, which precisely describe the activities to be performed by evaluators during inspection. This paper presents an empirical validation of this inspection technique: two groups of novice inspectors have been asked to evaluate a commercial hypermedia CD-ROM applying the SUE inspection or the traditional heuristic evaluation technique. Results have shown a clear advantage of the SUE inspection over the heuristic evaluation, demonstrating that Abstract Tasks are efficient tools to drive evaluator's performance.
Keywords Usability Evaluation Methods, Hypermedia Usability, Controlled Experiments.
1. INTRODUCTION Usability of interactive systems is currently receiving much attention. In particular, in industry it is now recognised the importance of adopting usability methods during the development cycle for increasing the acceptability of new products on the market [17]. However, one of the main complains of industry is that cost-effective usability evaluation tools are still lacking. This inhibits most companies from actually performing usability evaluation, with the consequent result that a lot of software is still poorly designed and unusable. Usability inspection methods are
emerging as preferred evaluation methods, being less costly than traditional lab-based usability evaluation. It is indubitable that usability inspection of complex applications, such as hypermedia, is still an "art", in the sense that a great deal is left to the skills, experience, and ability of the inspectors. Moreover, training inspectors is difficult and often quite expensive. As part of an overall methodology for usability evaluation called SUE (Systematic Usability Evaluation) [2], a novel inspection technique has been proposed, to help usability inspectors share and transfer their evaluation know-how, make it easier the hypermedia inspection process for newcomers, and achieve more effective and efficient evaluations. As described in previous papers [3, 7, 8], the inspection proposed by SUE is based on the use of evaluation patterns, called Abstract Tasks, which precisely describe the evaluator's activities to be performed during inspection. This paper presents an empirical validation of the SUE inspection technique. Two groups of novice inspectors have been asked to evaluate a commercial hypermedia CD-ROM applying the SUE inspection or the traditional heuristic technique. The comparison was based on three major dimensions: effectiveness, efficiency, and satisfaction. Results showed a clear advantage of the SUE inspection over the heuristic evaluation on all dimensions, demonstrating that Abstract Tasks are efficient tools to drive evaluator's performance. The paper has the following organisation. Section 2 describes the current situation of usability inspection by surveying related works, and provides the rationale for the SUE inspection. Section 3 outlines the SUE inspection. Section 4 is the core of the paper, since it describes the experiment that has been performed in order to validate the SUE inspection. Finally, Section 5 gives the conclusions.
2. BACKGROUND Usability inspection refers to a set of methods in which evaluators examine usability-related aspects of an application and provide judgements based on their knowledge. Examples of usability inspection methods are heuristic evaluation, cognitive walkthrough, guideline review, and formal usability inspection [25]. With respect to other usability evaluation methods, such as userbased evaluation, usability inspection methods are more
subjective. They are strongly dependent upon the inspector skills, and therefore it may happen that different inspectors produce non comparable outcomes. However, usability inspection methods “save users” [14], and do not require special equipment, nor lab facilities. In addition, experts can detect problems and possible future faults of a complex system in a limited amount of time. For all these reasons, inspection methods have seen an increasing widespread use in recent years, especially in industrial environments [22]. Among usability inspection methods, the most commonly used is heuristic evaluation [21, 23]. It prescribes to have a small set of experts inspecting the system, and evaluating its interface against a list of recognised usability principles - the heuristics. Experts can be usability specialists, experts of the specific domain of the application to be evaluated, or (preferably) double experts, with both usability and domain experience. Heuristic evaluation is one of the “discount usability” methods [21, 22]. In fact, some researches have shown that it is a very efficient usability engineering method [13], with a high benefitcost ratio [22]. It is especially valuable when time and resources are short, because skilled evaluators, without needing the involvement of representative users, can produce high quality results in a limited amount of time [16]. Heuristic evaluation has however a number of drawbacks. As highlighted in [4, 14, 16], its major drawback is its high dependence upon the skills and experiences of the evaluators. In a case-study, Nielsen found that novice evaluators with no usability expertise were poor evaluators, usability experts were 1.8 times as good as novices, and application domain and usability experts (the double experts) were 2.7 as good as novices, and 1.5 as good as usability experts [20]. This means that the specific experience with the specific category of applications really improves the evaluators’ performance. Unfortunately, usability specialists may lack domain expertise, and domain specialists are rarely trained or experienced in usability methodologies. In order to overcome this problem for the evaluation of hypermedia, the SUE inspection technique has been introduced. It uses evaluation patterns, called Abstract Tasks, for guiding the inspector activity. Abstract Tasks precisely describe which objects of the hypermedia application to look for, and which actions the evaluators must perform in order to analyse such objects. In this way, also less experienced evaluators, with lack of expertise in usability and/or hypermedia, are able to come out whit more complete and precise results. The SUE inspection technique solves a further heuristic evaluation drawback, which is reported in [4]: not always heuristics, as they are generally formulated, are able to deeply guide the evaluators. At this proposal, first the SUE inspection framework provides a list of detailed heuristics that are specific for hypermedia (obtained by specialising general usability principles into hypermedia-oriented usability attributes). Second, Abstract Tasks provide a detailed description of the activities to be performed for detecting possible violations of such heuristics. In some recent papers [1, 11], authors highlight that there is a clear need for more focused usability inspection methods, and for a classification of usability problems, so that to support the production of inspection reports easy to read and compare. These authors have defined the User Action Framework (UAF), which is a unifying and organising framework, supporting usability inspection, design guidelines, classification and reporting of
usability problems. UAF provides a knowledge base, in which different usability problems are organised taking into account how users are affected by the design during interaction, at various points where they must accomplish cognitive or physical actions. The classification of design problems and usability concepts is a way to capitalise on past evaluation experiences. It allows evaluators to better understand the design problems they encounter during the inspection, and helps them identify precisely which physical or cognitive aspects cause the problems. Evaluators are therefore able to propose well focused redesign solutions. The motivations behind this research are similar to ours. Reusing the past evaluation experience, and making it available to less experienced people is also one of our basic goals, which we pursue through the use of Abstract Tasks. Their formulation is in fact the reflection of the experiences of some skilled evaluators. However, differently from the UAF, rather than recording problems, Abstract Tasks offer a way to keep track of the activities to be performed for discovering problems.
3. THE SUE INSPECTION TECHNIQUE The SUE inspection is based on the use of an application design model for describing the application, a set of usability attributes to be verified during the evaluation, and a set of Abstract Tasks, to be applied during the inspection phase. The term model is used in a broad sense, meaning a set of concepts, representation structures, design principles, primitives and terms, that can be used to build a description of an application. The model helps identify and describe, in a non ambiguous way, the components of the application which constitute the entities of the evaluation [5]. For evaluating hypermedia, we have adopted HDM – Hypermedia Design Model [6, 10], which focuses on structural and navigation properties, and on active media features. The usability attributes are obtained by decomposing general usability principles into finer-grained criteria, that can be better analysed. In accordance with the suggestion given in [23], namely to develop category-specific heuristics, we have therefore defined a set of usability attributes, able to capture the peculiar features of hypermedia [7, 8]. There is a correspondence between such hypermedia attributes and the ten Nielsen’s heuristics [21]. The hypermedia attributes, in fact, can be considered a specialisation for hypermedia of the Nielsen's heuristics, with the only exception of “Good Error Messages”, and “Help and Documentation”, which do not need to be further specialised. Abstract Tasks (ATs for short) are evaluation patterns which provide a detailed description of the activities to be performed by expert evaluators during inspection [8, 9]. They are formulated precisely by means of a pattern template, which provides a consistent format including the following items: • •
•
AT Classification Code and Title: these items univocally identify the AT, and succinctly convey its essence. Focus of Action: it shortly describes the context, or focus, of the AT, by listing the application constituents that are the evaluation entities. Intent: it describes the problem addressed by the AT and its rationale, trying to make clear which is the specific goal to be achieved through the AT application.
AS-1: “CONTROL ON ACTIVE SLOTS” FOCUS OF ACTION: an active slot. INTENT: to evaluate the control provided over the active slot, in terms of: A. mechanisms for the control of the active slot;
B.
mechanisms supporting the state visibility, i.e., the identification of any intermediate state of the slot activation.
ACTIVITY DESCRIPTION: given an active slot: A. execute commands such as play, suspend, continue, stop, replay, get to an intermediate state, etc.;
B. at a given instant, during the activation of the active slot, verify if it is possible to identify its current state, as well as its evolution up to the end. OUTPUT: A. a list and a short description of the set of control commands, and of the mechanisms supporting the state visibility; B. a statement saying if: • the type and number of commands is appropriate, in accordance with the intrinsic nature of the active slot; • besides the available commands, some further commands would make the active slot control more effective; • the mechanisms supporting the state visibility are evident and effective. Table 1: An AT from the library of hypermedia ATs [18]. •
Activity Description: it describes in detail the activities to be performed during the AT application.
•
Output: it describes the output of the fragment of the inspection the AT refers to.
situations while reporting troubles, so attaining a major precision in their final evaluation report.
4. THE EXPERIMENT In order to validate the SUE inspection technique, we have conducted a comparison study involving 28 senior students of a Human-Computer Interaction class at the University of Bari, Italy. The aim of the experiment was to compare the performance of evaluators carrying out the SUE inspection with the performance of evaluators carrying out the heuristic inspection, based on the use of heuristics only. For the sake of brevity, in the rest of the paper we indicate as SI the SUE Inspection, and as HI the Heuristic Inspection. As explained in more detail in Section 4.2, the validation metrics were defined along three major dimensions: effectiveness, efficiency, and user satisfaction. Such dimensions actually correspond to the principal usability factors as defined by the Standard ISO 9241-11 [12]. Therefore, we can say that the experiment has allowed us to assess the usability of the inspection technique [15]. In the defined metrics, effectiveness refers to the completeness and accuracy with which inspectors performed the evaluation. Efficiency refers to the time expended in relation to the effectiveness of the evaluation. Satisfaction refers to a number of subjective parameters, such as perceived usefulness and difficulty, acceptability and confidence with respect to the evaluation technique. For each dimension we have tested a specific hypothesis: •
Effectiveness Hypotheses. As a general hypothesis we predicted that SI should increase evaluation effectiveness as compared to HI. The advantage is related to two factors: (a) the systematic nature of the SI technique, deriving from the use of the model for precisely identifying the application constituents; (b) the use of ATs, which suggest the activity to be conducted over such objects. Since ATs directly address hypermedia applications, this prediction should be also weighted with respect to the nature of problems detected by evaluators. The hypermedia specialisation of the SI could constitute both the method advantage and its limit. Indeed, while it could be particularly effective with respect to hypermedia-specific problems, it could neglect other flaws related to presentation and content. In other words, the limit of ATs could be that of taking evaluators away from defects not specifically addressed by the AT activity.
•
Efficiency Hypothesis. A limit of SI could be that a rigorous application of several ATs is time demanding. However, we expect that SI should not compromise inspection efficiency as compared to a less structured inspection technique. Indeed, the higher effectiveness of the SI technique should compensate for the major time demand required by its application.
•
Satisfaction Hypothesis. Although we expect that SI should be perceived as a more complex technique than HI, we hypothesise that it should enhance the evaluators’ control over the inspection process and their confidence on the obtained results.
Optionally, a comment is provided, with the aim of indicating further ATs to be applied in combination, or highlighting related usability attributes. A further advantage of the use of a model is that it provides the terminology for formulating the ATs. The forty ATs defined for hypermedia [18] have been formulated by using the HDM vocabulary. An example of such ATs is reported in Table 1; the title is “Control on Active Slot”1. The list of ATs provides a systematic guidance on how to inspect a hypermedia application. Most evaluators are very good in analysing only certain features of interactive applications; often they neglect some other features, strictly dependent on the specific application category. Exploiting a set of ATs ready for use allows evaluators with no experience in hypermedia to come up with good results. During the inspection, evaluators analyse the application, and specify a viable HDM schema, when it is not already available, for describing the application. During this activity, the different application components, i.e., the objects of the evaluation, are identified. Then, having in mind the usability criteria, evaluators apply ATs and produce a report in which the discovered problems are described. The terminology provided by the model is used by the evaluators for referring to objects and describing critical
1
In the HDM terminology, a “slot” is an atomic piece of information, such as texts, pictures, videos, sounds, etc.
In the following section we describe the experimental method adopted to test these hypotheses.
4.1 Method 4.1.1 Participants
AT Classification Code
AT Title
AS-1
Control on Active Slots
AS-6
Navigational Behaviour of Active Slots
PS-1
Control on Passive Slots
HB-N1
Complexity of Structural Navigation Patterns
HB-N4
Complexity of Applicative Navigation Patterns
AL-S1
Coverage Power of Access Structures
4.1.2 Design
AL-N1
Complexity of Collection Navigation Patterns
The inspection technique was manipulated between participants. Half of the sample was assigned to the HI condition, the other half to the SI condition.
AL-N3
Bottom-up Navigation in Index Hierarchies
AL-N11
History Collection Structure and Navigation
AL-N13
Exit Mechanisms Availability
Twenty-eight senior students from the University of Bari participated in the experiment as part of their credit for an HCI course. In this course, students received training and hands-on experience in Nielsen’s heuristic evaluation method, applying the method to paper prototypes, computer–based prototypes, and hypermedia CD-ROMs. During lectures they were also exposed to the HDM model.
4.1.3 Procedure A week before the experiment, participants were introduced to the conceptual tools to be used during the inspection. The training session lasted 2 hours and 30 minutes for the HI group, and 3 hours for the SI group. The different training time was due to the different conceptual tools used during the evaluation by the two groups, as better explained in the following. A preliminary 2-hour seminar reviewed the HDM Model, and introduced all the participants with hypermedia-specific attributes, as defined by SUE. Particular attention was devoted to inform students without influencing their expectations and attitudes towards different inspection techniques. A couple of days later, all the participants were presented with a short demo of the application, lasting almost 15 minutes. A few summary indications about the application content and the main functions were introduced, without providing, however, too many details. In this way, participants, having a limited time at their disposal, did not start their usability analysis from scratch, but had an idea (although vague) of how to get oriented in the application. Then, participants assigned to the SI group were shortly introduced to the HDM schema of the application, and to the key concepts on applying ATs. In the proposed application schema, only the main application components in-the-large (i.e., structure of entity types and applicative links for the hyperbase, collection structure and navigation for the access layer) were introduced, without revealing any detail that could give indications of usability problems. The experimental session lasted three hours. Participants were required to inspect the CD ROM applying the technique they were assigned to. All participants were provided with a list of ten SUE heuristics, summarising the usability guidelines for hypermedia2 [7, 8]. The SI group was also provided with the HDM application schema, and with ten ATs to be applied during inspection (see Table 2). The limited number of ATs was due to the limited amount of time participants had at their disposal. We selected the most basic ATs, which could guide SI inspectors in the analysis of the main application constituents. For example, we disregarded ATs addressing advanced hypermedia features.
2
By providing both groups with the same heuristic list we have been able to measure the possible added value of the systematic inspection induced by ATs, with respect to the subjective application of heuristics.
Table 2: The list of ATs submitted to inspectors. Working individually, participants had to find the maximum number of usability problems in the application, and to record them on a report booklet. The booklet differed according to the experimental conditions. In the HI group, it included ten forms, one for each of the hypermedia heuristics. The forms required information about the application point where that heuristic was violated, and a short description of the problem. The SI group was instead provided with a report booklet including ten forms, each one corresponding to an AT. Again the forms required information about the violations detected through that AT, and where they occurred. At the end of the evaluation, participants were invited to fill in an evaluator-satisfaction questionnaire, which combined several item formats to measure three main dimensions: user-satisfaction with the evaluated application, evaluator-satisfaction with the inspection technique, and evaluator-satisfaction with the results achieved.
4.1.4 The Application The evaluated application is the Italian CD ROM “Camminare nella pittura” – meaning “Walking through Painting” [19]. It is composed of two CD ROMs, each one presenting the analysis of Painting and some relevant artworks in two periods. The first CD ROM (CD1 in the following) covers the period from Cimabue to Leonardo; the second one the period from Bosch to Cezanne. The CD-ROMs are identical in the structure, and each one can be used independently from the other, thus being a distinct and "complete" application of limited size, particularly suitable for being exhaustively analysed in a limited amount of time. Therefore, CD1 only has been submitted to participants. The limited number of navigation nodes in CD1 has simplified the post-experiment analysis of the paths followed by evaluators during the inspection, and the identification of the application points were they highlighted the problems.
4.1.5 Data Coding For each participant and condition, the report booklets were analysed by three expert hypermedia designers with a strong HCI background, to assess effectiveness and efficiency of the applied evaluation technique. All reported measures had a reliability value of at least .85. Evaluator satisfaction was instead measured analysing the self-administered post experiment questionnaires. All the statements written in the report booklets were scored as
Problems or Non-Problems. Problems are actual usability flaws, which could impact on user performance. Non-Problems include: (a) observations reflecting only evaluators’ personal preferences but not real usability bugs; (b) evaluation errors, reflecting evaluators’ misjudgements or system defects due to a particular hardware configuration; (c) not understandable statements, i.e., statements not clearly reported. For each statement scored as Problem or Non-Problem of type (a), a severity rating was performed. As suggested by Nielsen [23], severity was estimated considering three factors: i) the frequency of the problem; ii) the impact of the problem on the user; iii) the persistence of the problem during interaction. The evaluation was modulated on a 5-point scale, ranging from 1 = "I don’t agree that this is a usability problem at all", to 5 = "Usability catastrophe".
HI Severity index
SI
3.66 (.12)
4.22 (.08)
Table 3: Means and standard errors for the analysis of severity. where Pi is the number of problems found by the i-th inspectors, and n is the total number of problems existing in the application (n = 38).
Each problem was further classified in one of the following dimensions, according to the nature of the problem itself:
On the average, inspectors in the SI group found 24% of all the usability defects (mean S.E. = 1.88); inspectors in the HI group 19% (mean S.E. = 1.99). As shown by a Mann-Whitney U test, the difference is statistically significant (U = 50.5, (N = 28), p < .05). It follows that the SI technique enhances evaluation completeness, allowing individual evaluators to discover a major number of usability problems.
•
Accuracy can be defined by two indexes: precision and severity.
•
•
Navigation, which includes problems related to the task of moving within the hyperspace. It refers to the appropriateness of mechanisms for accessing information, and for getting oriented in the hyperspace. Active media control, which includes problems related to the interaction with dynamic multimedia objects, such as video, animation, audio comment, etc. It refers to the appropriateness of mechanisms for controlling the dynamic behaviour of media, and of mechanisms providing feedback about the current state of the media activation. Interaction with widgets, which includes problems related to the interaction with the widgets of the visual interface, such as buttons of various types, icons, scrollbars etc. It includes problems related to the appropriateness of mechanisms for manipulating widgets, and their self-evidence.
Note that navigation and active media control are dimensions specific to hypermedia systems.
4.2 Results 4.2.1 Establishing the Standard of Comparison The total number of problems detected in the application is 38. Among these, 29 problems were discovered by the three experts hypermedia designers, through an inspection prior to the experiment, 9 additional problems were identified only by the experimental inspectors. During the experiment, inspectors reported a total number of 36 different types of Problems. They also reported 25 different types of Non-Problems (type (a) and (b)). Four inspectors reported at least one non understandable statement (Non-Problems of type (c)).
4.2.2 Effectiveness Analysis Effectiveness can be decomposed into the completeness and accuracy with which inspectors performed the evaluation. Completeness corresponds to the percentage of problems detected by a single inspectors out of the total number of problems, and is computed by the following formula:
Completeness i =
Pi * 100 n
Precision is given by the percentage of problems detected by a single inspector out of the total number of statements. For a given inspector, precision is computed by the following formula : Precisioni =
Pi * 100 si
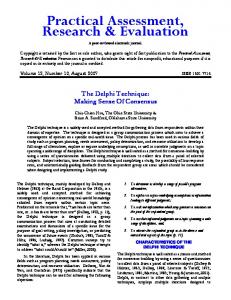
where Pi is the number of problems found by the i-th evaluator, and si is the total number of statements he/she reported (including Non-Problems). In general, the distributions of precision is affected by a severe negative skewness, with 50% of participants not committing any errors. The variable ranges from 40 to 100, with a median value of 96. In the SI group, inspectors were totally accurate (precision value = 100%), with the exception of two of them, which were slightly inaccurate, having however a precision value superior to 80%. On the contrary, in the HI group, only two participants were totally accurate. The mean value for the HI group is 77.4 (mean S.E. = 4.23), the median 77.5. Moreover, four evaluators in the HI group reported at least one nonunderstandable statement, while all the statements reported by the SI group were clearly expressed, and referred to application objects using a comprehensible and consistent terminology. This general trend, reflecting the advantage of SI over HI on effectiveness, has been confirmed also by the analysis of the severity index, which refers to the average rating of all the scored statements for each participant. A t-test analysis demonstrated that the mean rating of the two groups varied significantly (t(26)= -3.92, p < .001). Problems detected applying the ATs were scored as more serious than those detected when only the heuristics were available (means and standard errors are reported in Table 3). The effectiveness hypothesis also states that the SI group is particularly effective for detecting hypermedia-specific problems, while it could neglect other bugs related to GUI widgets. In order to test this aspect, we have analysed the distribution of problem types as a function of experimental conditions. As can be seen in the bar-chart reported in Figure 1, the most common problems detected by all the evaluators was concerned with navigation, followed by defects related to active media control. Only a minority of problems regarded interaction with widgets. In general, it is evident that the SI inspectors found more problems. However, this superiority especially emerges for
hypermedia related defects (navigation and active media control categories) t(26) = -2.70, p < .05. A slight major average number of "Interaction with widgets" problems has been found by the HI group. Anyway, a MannWhitney U test, comparing the percentage of problems in the two experimental conditions, has shown that the difference is not significant (U = 67, N = 28, p = .16). This means that differently from what we have hypothesised, the systematic inspection activity suggested by ATs does not take evaluators away from other problems not covered by the activity description. Also, we believe that supplying evaluators with layout-specific ATs, such as those presented in [3], so that to focus evaluation on presentation aspects, we could obtain a deep analysis of the graphical user interface, with the result of having a major number of “Interaction with widgets” problems found by the SI evaluators. Since the problems found by the SI group in the “Interaction with widgets” category are those having the highest severity, we can also deduce that the hypermedia ATs do not prevent evaluators from noticing usability catastrophes related to presentation aspects.
4.2.3 Efficiency Analysis Efficiency has been considered both at the individual, and at the group level. Individual efficiency refers to the number of problems extracted by a single inspector, in relation to the time spent. It is computed by the following formula:
Ind_Efficiencyi =
Pi ti
where Pi is the number of problems detected by the i-th inspector, and ti is the time spent for finding the problems. On the average, SI inspectors found 4.5 problems in 1 hour of inspection, versus the 3.6 problems per hour found by the HI inspectors. A t-test on the variable normalised by a square root transformation demonstrates that the difference is not significant (t(26) = -1.44, p = .16). Such a result confirms our efficiency hypothesis, since ATs do not compromise efficiency as compared to a less structured evaluation technique, but rather SI shows a positive tendency in finding a major number of problems per hour. This curve derives from a mathematical model which is based on the prediction formula for the number of usability problems found in a heuristic evaluation reported in the following [24]: Found(i) = n(1-(1-λ)i) where Found(i) is the number of problems found by aggregating reports from i independent evaluators, n is the total number of problems in the application, and λ is the probability of finding the average usability problem when using a single average evaluator. As suggested by the authors, one possible use of this model is the estimation of the number of the inspectors needed for identifying a given percentage of usability errors. We have therefore used the model for determining how many inspectors for the two techniques would enable the detection of a reasonable percentage of problems existent in the application. The curves calculated for the two groups are reported in Figure 2 (n=38, λHI=0.19, λSI=0.24). As emerging from the graph, ATs
6
Navigation
4 2
Active Media Control
0
Interaction with Widgets
HI
SI
Figure 1: Average number of problems as a function of experimental conditions and problem categories. tend to reach better performance with a lowest number of evaluators. Assuming the Nielsen’s 75% threshold, SI can reach it with five evaluators. The HI group needs instead seven evaluators.
4.2.4 Satisfaction Analysis With respect to an evaluation technique, satisfaction refers to many parameters, such as perceived usefulness, difficulty, and acceptability of applying the method. The post-experiment questionnaire addressed three main dimensions: user-satisfaction with the application evaluated, evaluator-satisfaction with the inspection technique, and evaluator-satisfaction with the results achieved. At a first sight it may appear that the first dimension, addressing the satisfaction of the evaluators with the application, is out of the scope of the experiment, whose main intent was to compare two inspection techniques. However, we wanted to verify in which way the used technique influenced the analysis capability of inspectors. User-satisfaction with the application evaluated was assessed by two complementary techniques. A semantic-differential scale required inspectors to judge the application on 11 couples of adjectives describing satisfaction with information systems (satisfaction index). Inspectors could modulate their evaluation on 7 points (1 means very negative, 7 very positive). The initial reliability of the satisfaction scale is moderately satisfying (α = .74), with three items (reliable – unreliable; amusing – boring; difficult – simple) presenting a corrected item-total correlation inferior to .30. Therefore, the user-satisfaction index was computed averaging scorings for the remaining 8 items (α = .79). Then, the index was analysed by a t-test. Results showed a significant effect for the Inspection group (t(26) = 2.38, p < .05). On the average, the SI inspectors evaluated the application more severely (mean = 4.37, mean S.E .= .23) than HI inspectors (mean = 5.13, mean S.E. = .22). From this difference, it can be inferred that ATs provide evaluators with a more effective framework to weight limits and benefits of the application. The hypothesis is supported by the significant correlation between the number of usability problems found by an evaluator and his/her satisfaction with the application (r = -.42, p < .05). The negative relationship indicates that as more problems were found, as less positive the evaluation was. Evaluator-satisfaction with the inspection technique was assessed by 11 couples of adjectives, modulated on 7 points. The original reliability value is .72, increasing to .75 after deletion of 3 items (tiring – restful; complex – simple; satisfying – unsatisfying). The evaluator-satisfaction index was then computed averaging scorings to the remaining 8 items. The index is highly correlated to a direct item assessing learnability of the inspection technique (r = .53, p < .001). As easiest the technique was perceived, as
•
The SUE inspection increases the evaluation effectiveness: the SI group has shown a major completeness and precision in reporting problems, and has also identified more severe problems.
•
Although more rigorous and structured, the SUE inspection does not compromise the inspection efficiency: it enhances the group efficiency, and shows a non inferior individual efficiency, with a positive tendency with respect to the heuristic inspection.
•
The SUE inspection enhances the inspectors’ control over the inspection process, and their confidence on the obtained results: SI inspectors evaluated the application more severely than HI inspectors; although SUE inspection is perceived as a more complex technique, SI inspectors have been moderately satisfied about it; finally, they have shown a major critical capability, feeling less satisfied with their performance, as if they could understand the limit of their inspection activity better than the HI inspectors.
Proportion of Usability Problems
100%
75%
50%
25% HI SI 0% 1
2
3
4
5
6
7
8
9
10 11 12 13 14 15
N umber of Evaluators
Figure 2: The cost-benefit curve showing, for each group, the proportion of usability problems found by the two techniques, using different numbers of evaluators [24]. better it was evaluated. A t-test showed no significant differences in the satisfaction with the inspection technique (t(26) = 1.19, p = .25). On the average, evaluations were moderately positive for both techniques, with a mean difference of .32 slightly favouring the heuristic inspection. To conclude, despite being objectively more demanding, SI is not evaluated worse than HI. Evaluator-satisfaction with the result achieved was assessed directly by a Likert-type item asking participants to express their gratification on a 4 point-scale (from “not at all” to “very much”), and indirectly by a percentage estimation of the number of problems found. The two variables are highly correlated (r = .57, p < .01). The more problems an inspector thinks to have found, the more satisfied he/she is with his/her performance. Consequently, the final satisfaction index was computed multiplying the two scores. A Mann-Whitney U-test showed a tendency towards a difference in favour of the HI group (U = 54.5, p = .07). Participants in the HI group felt more satisfied about their performance than those in the SI group. By considering this finding in the general framework of the experiment, it appears that ATs furnish participants with higher critical capabilities than heuristics. Indeed, despite the major effectiveness achieved by participants in the SI group, they are still less satisfied with their performance, as if they could better understand the limit of an individual evaluation.
5. CONCLUSIONS In the last decade, several techniques for evaluating the usability of software systems have been proposed. Unfortunately, research in HCI has not devoted sufficient efforts towards the validation of such techniques, and therefore some open questions persist about them [15]. The study reported in this paper has provided some answers about the effectiveness, efficiency and satisfaction of the SUE inspection technique. Our main conclusion is that the experiment seems to confirm our general hypothesis of sharp increasing of the overall quality of inspection when ATs are used. More specifically we can conclude that:
6. ACKNOWLEDGMENTS We are immensely grateful to Prof. Rex Hartson, from Virginia Tech, for his valuable suggestions. We also thank Francesca Alonzo and Alesandra Di Silvestro from the Hypermedia Open Center of Polytechnic of Milan, for the help offered during the experiment data coding.
7. REFERENCES [1] Andre, T.S., Hartson, H.R., and Williges, R.C. Expert-based Usability Inspections: Developing a Foundational Framework and Method. Proc. of the 2nd Annual Student’s Symposium on Human Factors of Complex Systems. Greensboro, NC, USA, April 1999. [2] Costabile, M.F., Garzotto, F., Matera, M., and Paolini, P. SUE: A Systematic Usability Evaluation. Technical Report 19-97, Dipartimento di Elettronica e Informazione, Politecnico di Milano, Milan, Italy, 1997. [3] Costabile, M.F., and Matera, M. Evaluating WIMP Interfaces through the SUE Approach. Proc. ICIAP’99, Venice, Italy, September 1999, IEEE Press, 1192-1197. [4] Doubleday, A., Ryan, M., Springett, M., and Sutcliffe, A. A Comparison of Usability Techniques for Evaluating Design. Proc. DIS’97, Amsterdam, NL, August 1997, ACM Press, 101-110. [5] Fenton, N.E. Software Metrics - A Rigorous Approach. Chapmann & All, London, 1991. [6] Garzotto, F., Mainetti, L., and Paolini, P. Hypermedia Design, Analysis, and Evaluation Issues. Comm. ACM, 38, 8 (August 1995), 74-86. [7] Garzotto, F., and Matera, M. A Systematic Method for Hypermedia Usability Inspection. The New Review of Hypermedia and Multimedia, 3, 1997, Taylor Graham Publ, 39-65. [8] Garzotto, F., Matera, M., and Paolini, P. Model-based Heuristic Evaluation of Hypermedia Usability. Proc. AVI’98, L’Aquila, Italy, May 1998, ACM Press, 135-145.
SIGDOC’97, Snowbird, UT, USA, 1997, ACM Press, 153160.
[9] Garzotto, F., Matera, M., and Paolini, P. Abstract Tasks: a Tool for the Inspection of Web Sites and Off-line Hypermedia. Proc. HyperText’99, Darmstadt, Germany, February 1999, ACM Press, 157-164.
[17] Madsen, K.H. Special Issue on “The Diversity of Usability Practices”. Comm. ACM, 42, 5 (May 1999).
[10] Garzotto, F., Paolini, P., and Schwabe, D. HDM - A Modelbased Approach to Hypermedia Application Design. ACM Trans. Inf. Syst., 11, 1 (January 1993), 1-26.
[18] Matera, M. SUE: a Systematic Methodology for Evaluating Hypermedia Usability. Ph.D. Thesis, Dipartimento di Elettronica e Informazione, Politecnico di Milano, 1999.
[11] Hartson, H.R., Andre, T.S., Williges, R.C., and Van Rens, L. The User Action Framework: a Theory-based Foundation for Inspection and Classification of Usability Problems. Proc. HCI International’99, Munich, Germany, August 1999, Elsevier Publ., 1058-1062.
[19] Mondadori New Media. Camminare nella Pittura. CD ROM, 1997.
[12] ISO (International Standard Organisation). ISO 9241: Ergonomics Requirements for Office Work with Visual Display terminal (VDT) - Parts 1-17, 1997. [13] Jeffries, R., and Desurvire, H.W. Usability Testing vs. Heuristic Evaluation: Was There a Context? ACM SIGCHI Bulletin, 24, 4 (October 1992) 39-41. [14] Jeffries, R., Miller, J., Wharton, C., and Uyeda, K.M. User Interface Evaluation in the Real Word: a Comparison of Four Techniques. Proc. CHI’91, New Orleans, LA, USA, 1991, ACM Press, 119-124.
[20] Nielsen, J. Finding Usability Problems through Heuristic Evaluation. Proc. CHI’92, Monterey, CA, USA, 1992, ACM Press, 373-380. [21] Nielsen, J. Usability Cambridge, MA, 1993.
Engineering.
Academic
Press,
[22] Nielsen, J. Guerrilla HCI: Using Discount Usability Engineering to Penetrate Intimidation Barrier. In CostJustifying Usability, Bias, R.G., Mayhew D.J. (eds.), Academic Press, 1994. Also available at the URL http://www.useit.com/papers/guerrilla_hci.html. [23] Nielsen, J. Heuristic Evaluation. In [25], 1994, 25-62.
[15] John, B.E. Evaluating Usability Evaluation Techniques. ACM Computing Surveys, 28, 4es, 1996.
[24] Nielsen, J., and Landauer, T. K. A Mathematical Model of The Finding of Usability Problems. Proc. INTERCHI’93, Amsterdam, NL, 1993, ACM Press, 296-213.
[16] Kantner, L., and Rosenbaum, S. Usability Studies of WWW Sites: Heuristic Evaluation vs. Laboratory Testing. Proc.
[25] Nielsen, J., and Mack, R.L. Usability Inspection Methods. John Wiley & Sons, New York, 1994.