freeâbreathing 4D lungâCT ... The clinical relevance of 4D CT lung registration is diverse. .... The grid is placed on the image domain Ω such that the second ..... followed by STM (14.8 mm), PM (10.7 mm), and by far the best NPM (5.2 mm). 5.
Validation and comparison of registration methods for free–breathing 4D lung–CT Torbjørn Vika , Sven Kabusa , Jens von Berga , Konstantin Ensa,b , Sebastian Driesa , Tobias Klindera,c and Cristian Lorenza a Philips
Research Europe – Hamburg, R¨ontgenstraße 24, 22335 Hamburg, Germany of Mathematics, University of L¨ ubeck, Wallstraße 40, 23560 L¨ ubeck, Germany c Institute of Image Processing, Leibniz University Hannover, Appelstraße 9a, 30167 Hannover, Germany
b Institute
ABSTRACT We have compared and validated image registration methods with respect to the clinically relevant use-case of lung CT max-inhale to max-exhale registration. Four fundamentally different algorithms representing main approaches for image registration were compared using clinical images. Each algorithm was assigned to a different person with extensive working knowledge of its usage. Quantitative and qualitative evaluation is performed. Whereas the methods achieve similar results in target registration error, characteristic differences come to show by closer analysis of the displacement fields.
1. DESCRIPTION OF PURPOSE The clinical relevance of 4D CT lung registration is diverse. Firstly, the estimation of respiratory motion is of diagnostic value in itself since it is related to the function of the respective organ. Secondly, motion potentially leads to image artifacts that can be reduced if the respective motion fields are estimated.1 Finally, for image guided therapies the estimation of organ motion from multi–phase images is a valuable source of information to better compensate the position uncertainty caused by organ motion. Especially, radiation therapy planning in the lung and the upper abdomen may benefit from the estimation of respiratory motion. The first objective of this study was to evaluate whether deformable registration is robust and accurate enough for application in radiotherapy by comparing accuracy to expert delineation. Generally spoken, the task of respiratory motion estimation requires the registration of images of different respiratory states of the same patient, thus establishing a correspondence between the same anatomical entity in both images. There are two main approaches towards image registration. The first identifies corresponding anatomical landmarks (points, lines, or surfaces) in both images and interpolates between these structures. The other directly deforms a complete image to minimize a similarity function defined between both images. The deformation may be defined in a parametric space, or it may be ”non–parametric” (see below). This work compares four fully automatic methods to perform the registration of inhale with exhale CT images of the lung: A point–based matching method (PBM) finds landmarks independently in the two images by evaluation of a similarity criterion based on local image information. A surface tracking method (STM) determines a fractal lung surface in one image, deforms it to fit the second image and uses the correspondence of the mesh vertices. A parametric image registration method (PM) uses B–spline deformation geometry, and a non–paramatric registration method (NPM) uses the Navier-Lam´e elasticity equation for the regularization. Both latter methods minimize the sum of squared differences (SSD) between both images. Each method has a protagonist among the authors, who adapted it for the given task and tuned the parameters. This allows a fair comparison of the methods. Validation of non-rigid registration is a difficult topic. Therefore, a second objective of this work is to explore and understand differences between the methods. In contrast to many other validation studies, this objective is not pursued in a competitive way but rather in a collaborative effort. Other comparison studies between registration methods can be found for inter-modal, rigid brain registration,2 non-rigid brain registration3 and lung radiotherapy applications.4 A similar idea to develop a bronze standard is also being developed as a multi-center grid project.5
source image
source image
vesseltree segmentation
vesseltree segmentation
bifurcation selection
bifurcation selection
match bifurcations to obtain corresponding bifurcations
outlier removal
interpolate corresponding bifurcations to obtain displacement field
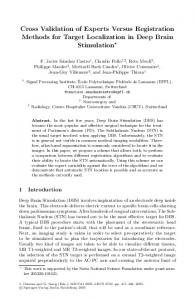
Figure 1. Flow diagram of point-based matching
2. MATERIAL AND METHODS We used ten respiratory gated biphasic thorax CT data sets acquired for radiation therapy planning of lung tumors, each reconstructed both at max inhale and max exhale state. The in–plane resolution was 0.98 mm and the slice distance was 2.5 mm. The field of view covered the whole lung in all cases. Registration was performed in both directions, i.e. from inhale state to exhale state and vice versa. Two independent experts set corresponding landmark pairs (18 and 20 pairs) at vessel- and bronchi-bifurcations in all datasets. Furthermore, the gross target volume (tumor – GTV) were manually delineated in all datasets. Different quantitative and qualitative metrics were applied and studied as described in the results section. Before applying the methods to the 10 datasets, the parameters of the methods were optimally tuned on one separate dataset by minimizing the registration error on 80 reference landmark pairs. We now give a short description of the different registration methods. More details can be found in the references therein.
2.1. Point-based matching This is a method that is representative of landmark-based registration methods. The workflow of the algorithm is depicted in Figure 1. It consists of finding landmarks independently in the images to register and then determining corresponding landmarks by evaluating a similarity criterion based on the characteristics of the landmarks. The correspondence search is performed without any kind of regularization. From the corresponding landmarks, a dense displacement field is calculated either with function interpolation or with function approximation. The method is described in detail in Hilsmann et al.6
2.2. Surface tracking Deformable surface models of an organ are a suitable method for respiratory motion estimation. As they are based on image features of the organ surface they are typically precise in the vicinity of this organ surface and less accurate inside the organ. There are some approaches to overcome this inherent deficit. The one proposed above uses additional landmarks from within the organ, others7 model the mechanics of the organ and use a finite element model to estimate organ motion inside. In our surface tracking method proposed here, we exploit the fractal nature of the lung vessels and follow their motion in addition to the outer lung surface.
Instead of using an organ model, we automatically determine the lung surface by a Hounsfield threshold at −650HU in one image and a marching cube triangulation.8 This surface not only covers the outer lung border but also the inner structures separating the parenchyma from the larger lung vessels. The number of triangles of this iso–surface range from 38,000 to 87,000. The method of deformable surface models9 is now applied on this iso–surface of the lungs to adapt it to the second image. The vertex positions of the triangular surface mesh are the parameters to be varied to minimize the energy term E = Eext + αEint .
(1)
The external energy Eext drives the mesh towards the surface points obtained in a surface detection step. The internal energy Eint restricts the flexibility by penalizing differences from the shape model. A number of such minimization steps is performed on the mesh. To speed up the optimization a discrete set of candidate displacement vectors is evaluated locally for each triangle. Details on the candidate point selection and on the calculation of the external energy can be found in von Berg et al.10 The internal energy X X 2 ((vj − vk ) − sR(ˆ vj − v ˆk )) (2) Eint = j
k∈N (j)
preserves shape similarity of all mesh vertices vi to the model vertices v ˆi from the initial iso–surface. N (j) is the set of neighbors of vertex j. The neighboring vertices are those connected by a single triangle edge. The scaling factor s and the rotational matrix R are determined by a closed–form point–based registration method based on a singular value decomposition prior to calculation of (2) to allow a similarity transformation (rigid transformation plus isotropic scaling) without effecting the internal energy. By use of all vertex displacement vectors of the deformable surface, we construct a coarse displacement field for the lungs. Interpolation by thin–plate–splines11 on a subset of these vertices is used to create a dense field from it. The subset is obtained by replacing all vertices having a neighbour closer than 10 mm. Further details on this shape–tracking method, the impact of its parameters, and its computational performance are given in von Berg et al.10
2.3. Parametric, volumetric registration This method is based on a B-spline parametrization. To prepare the setting, a grid of g1 × g2 × g3 control points with uniform spacing in each direction is defined. The grid is placed on the image domain Ω such that the second outmost layer of control points coincide with the boundary ∂Ω. This guarantees that every voxel is surrounded by a local mesh cube of size 4 × 4 × 4. Note that due to the outmost layer, each voxel on ∂Ω is embedded in such a cube and consequently, no boundary conditions have to be selected. The displacement of a single control point is encoded by βijk and β is the collection of all these vectors. Following Rueckert et al.12 the displacement u at position x ∈ Ω can be described by a tensor product u(x; β) =
g3 g2 X g1 X X
β ijk bi,3 (x1 )bj,3 (x2 )bk,3 (x3 )
(3)
i=1 j=1 k=1
where b·,3 refers to a cubic B-spline. As a result of the local support of cubic B-splines, one has to sum up 64 summands only. For a given displacement u(·, β), the quality of the match between the reference image IR and the deformed source image IS is determined by the sum of squared differences over the total number of voxels N : N
f (β) :=
1X 1 [Fv (β)]2 = kF (β)k22 , 2 v=1 2
(4)
where Fv (β) := IS (xv + u(xv ; β)) − IR (xv ) and F (β) = (F1 (β), ..., FN (β))T . Solving the optimization problem min
β∈Rg1 ×g2 ×g3
f (β)
(5)
needs special attention since the large number of parameters involved may result in high computational cost. We therefore choose an efficient non-linear optimization scheme: a Levenberg-Marquardt method generates a sequence (β m )m with starting value β0 = 0 and update rule βm+1 := β m + αm sm . Here, the parameter αm ∈ [0, 1] denotes the step-size and sm the search direction, respectively. The search direction sm is computed by solving the linear system [JF (β m )T JF (β m ) + λm E]sm = −JF (β m )T F (β m ) ,
(6)
where JF (β m ) denotes the Jacobian of F (β m ) with entries ∂Fv (βm )/∂(βim ). The identity matrix E must be added to obtain a regular linear system since JF (β m ) is usually rank deficient: voxels in areas with constant or almost constant grey values yield zero partial derivatives. The free parameter λm can be seen as a ’trust region radius’ and is adapted in each iteration. The choice of this radius has a great impact on the convergence of the scheme. If λm is chosen too small (λm = 0 coincides with a Gauß-Newton approach) instabilities of the scheme may arise, leading to a divergence of the iteration. A choice for λm which is too large (coinciding with a steepest descent approach) may result in an unnecessary slow convergence rate. In each iteration step, the matrix JF (β m )T JF (β m ) and the right hand side JF (β m )T F (β m ) of (6) is built. The partial derivatives ∂Fv (βm )/∂(βim ) are approximated by finite differences. In practice, many of the partial derivatives have a small numerical value and can be set to zero without degrading the convergence rate, but leading to a much more favorable complexity. For a given λm the linear system is solved by either a Cholesky decomposition or a conjugate gradient scheme yielding the descent direction sm . To determine λm+1 for the next iteration step the predicted reduction of the cost function is compared to the actual decrease in f . This technique avoids additional timeconsuming solving of the linear system during the trust region radius adaption. The control of λm as well as other details of the methods are described in Kabus et al.13 in detail. For all registrations we start with λ0 = 16. The iteration process is stopped if the relative reduction of the cost function is less than 2%. For stability and computational time reasons, the registration algorithm is embedded into a multi-resolution approach employing both an image pyramid and a parameter pyramid.
2.4. Non-parametric, volumetric registration This nonlinear registration scheme which is based on a variational principle14 using a parameter-free transformation description. This scheme minimize the following functional J(u; IR , IS ) = α · S(u) + D(IR , ISu )
(7)
with respect to the sought-after transformation u. The functional J in (7) consists of two main building blocks: • The distance measure D describes the similarity of the reference image IR and the image ISu , which is the template image IS , transformed with the displacement field u. The goal of image registration is to make the two images as similar as possible. The distance measure has to be chosen with respect to the underlying medical application. For monomodal registration tasks the sum of squared grey value differences (SSD) can be applied, since it assumes the same grey value structure in both images. • When only optimizing the image similarity, the problem (7) is ill-posed, since a transformation may consist of independent transformation vectors for each image pixel. In clinical applications suitable transformations have to fulfill certain smoothness constraints. Therefore a smoother S is incorporated in (7). The regularization parameter α controls the impact of the two individual ingredients with respect to the overall functional. We choose an elastic smoother as it reflects physical properties of soft tissue S(u) =
Z Ω
3 �2 λ µ X ∂xi uj + ∂xj ui + (div u)2 dx, 4 i,j=1 2
(8)
where µ and λ are so-called Lam´e-constants describing the elasticity. The distance measure D is chosen as SSD. Note, that the main work in any scheme, based upon the variational formulation (7), is the repeated solution of a linear system of equations Au = f , were A corresponds to the Gˆateaux derivative of the smoother S and f to the derivative of the distance measure D, respectively. Finally, we make use of a discretization of these equations to solve it with a fix-point iteration. Further details on this method can be found in Papenberg et al.15
3. NEW OR BREAKTHROUGH WORK The interest of the reported study is that it compares four different methods covering well the space of possible approaches towards image based respiration estimation. Each method was developed independently and it was brought to a mature state. A common framework was chosen for validation. Other similar cross–validation approaches are rather organized as a contest of different institutions not focussing so much on methods. Being an in–house contest we could assure a balanced competition between the methods and pursue collaborative efforts to compare the results.
4. RESULTS After parameter tuning on one separate dataset, all four methods were successfully applied to the 10 validation datasets. The computation for each method was completed after 5–20 minutes (Xeon 2.0GHz with 2GB RAM).
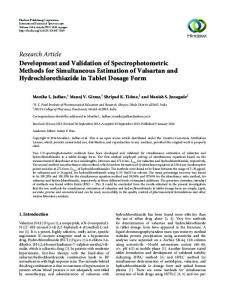
4.1. Quantitative evaluation 4.1.1. Landmark Accuracy At first, registration accuracy was assessed. The landmarks in one image were transformed using the dense deformation field resulting from the registration and compared to the reference landmarks. In Figure 2, the mean error after registration (target registration error – TRE) is displayed for each dataset and each direction of registration (first from inhale to exhale, then from exhale to inhale). The average euclidean distance between landmarks before registration is also depicted. Landmarks from two different experts were used. However, no inter-observer differences could be analyzed since the landmark pairs were not the same for the two experts. All methods show a reduced error in all cases but one. In this one case the average distance between landmarks before registration was around 3 mm. The results for STM (2.5 mm ± 2.16 mm) were slightly better than for PM (2.85 mm ± 3.06 mm), PBM (2.91 mm ± 2.68 mm) and NPM (3.31 mm ± 3.06 mm), but an overall ANOVA (analysis of variance) yielded no significant difference between the four methods. Taking into account image resolution (2.5 mm in superior-inferior direction), expert variability and errors due to image reconstruction, we believe the achieved result is a lower bound of registration accuracy for these data. It is improbable that the similarity in accuracy was reached purely by chance. We were therefore more interested in understanding issues like robustness and differences between the methods. 4.1.2. GTV Matching One application where lung inhale-exhale registration could play a role is in the radiotherapy of lung cancers. It is therefore of clinical interest to evaluate how well tumor motion can be estimated with registration. This could be used to transfer contours from one phase to another and thus enabling 4D treatment planning. For all ten data sets, one clinical expert delineated the gross tumor volume (GTV) in the inhale and the exhale images, respectively. To evaluate the registration accuracy of the GTV, the deformation fields obtained from the four methods were applied to the respective image mask to warp the corresponding GTVs. Accuracy of tumor matching was evaluated by determining two different metrics as presented for all ten datasets in Table 1: • Volumetric Overlap. This is the number of voxels in the intersection of the segmentation and the reference divided by the number of voxels in the union of both. For a perfect match, the value is 1.
12 expert 1 expert 2 PBM STM PM NPM
11 10 9
Avg error in mm
8 7 6 5 4 3 2 1 1
2
3
4
5
6 Case
7
8
9
10
Figure 2. Norm of TRE. For each case, the first value denotes the error after registration from exhale state to inhale state, the second the one from inhale to exhale.
• Average Symmetric Surface Distance. For each surface voxel, the closest voxel (euclidean distance) along the other surface is determined taking anisotropic image resolution into account. This distance is calculated in both directions, from the reference and from the segmentation, and is averaged. The value is 0 in case of a perfect segmentation.
Table 1. Evaluation of tumor matching. Deformation of all four methods are compared by applying the obtained respective deformation fields on all exhale images using backward transformations. Thus, warped exhale and original inhale GTVs are compared. The inverse process provided similar results. In addition to the four methods, the metrics (see text) are calculated for the unregistered image pairs (NR). Furthermore, an approximation of tumor motion (TM) from inhale to exhale is given for each patient. Last row (AV) gives the average of the first ten rows.
Case 1 2 3 4 5 6 7 8 9 10 AV
NR 0.77 0.58 0.44 0.75 0.76 0.07 0.85 0.61 0.80 0.59 0.62
Volumetric Overlap PBM STM PM NPM 0.47 0.70 0.70 0.70 0.76 0.85 0.86 0.83 0.55 0.67 0.67 0.59 0.60 0.68 0.83 0.78 0.70 0.76 0.75 0.74 0.65 0.55 0.70 0.60 0.51 0.44 0.43 0.39 0.68 0.81 0.82 0.73 0.60 0.68 0.80 0.79 0.22 0.58 0.62 0.54 0.57 0.67 0.72 0.67
NR 0.34 2.27 1.39 0.92 0.29 4.89 0.27 1.35 0.41 0.84 1.30
Average PBM 1.24 1.04 1.09 1.87 0.41 0.63 1.89 1.00 1.29 2.25 1.28
Distance [mm] STM PM NPM 0.48 0.61 0.44 0.51 1.41 1.61 0.56 0.56 0.86 1.41 0.54 0.68 0.29 0.30 0.32 1.17 0.51 0.72 2.61 2.52 2.84 0.46 0.67 0.72 0.90 0.47 0.43 0.87 0.76 0.99 0.93 0.84 0.96
TM [mm] 0.25 4.72 3.33 1.89 0.83 10.42 0.33 3.13 0.64 2.04
In addition to the derived metrices, we also determined the corresponding tumor motion (TM) from inhale to exhale. An approximation of the tumor motion was obtained by calculating the distance between the centers of mass of the manually delineated inhale and exhale GTVs. Surprisingly, the registration does not necessarily improve the tumor matching. Although, there are several cases (2,3,6,8) where the metrices improve after registration, there are other cases where the registration showed no significant improvement or even provided worse results. Taking the tumor motion into account, we see that an improvement correlates with the amplitude of the tumor motion. Only in these cases is the improvement in tumor position so large that it is not hidden in the variation of the metrics caused by delineation errors of the tumors and quantification errors related to the voxel-based metrics.
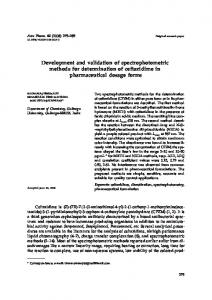
4.2. Qualitative evaluation Obtaining a similar registration accuracy for each method, greater insight can be achieved by an analysis of the resulting displacement fields. We present an analysis of the jacobian, the displacement fields in inferior-superior direction and a consistency measure. To illustrate each analysis a coronal view from case 7 (exhale to inhale, cf. Figure 3) was chosen as representative. The determinant of the jacobian of the displacement field is known as a local measure for volume change. Whereas a value of 1 means local size preservation, a value below 1 corresponds to contraction and a value above 1 to expansion. The volume preservation map for case 7 is shown in Figure 4. All fields predominantly show local contraction in the lung. STM shows the most homogeneous volume change of the four. In PM and PBM the effect of a regular and a non-regular distribution of control points can be observed. For NPM, the jacobian is not as smooth as for the other methods, caused by the many degrees of freedom of this method. It should be noted that PBM does not identify control points on the diaphragm. Further interpretation of the results in relation to physiology was not attempted. The displacement in inferior-superior direction for case 7 is shown in Figure 5 and a rendering of the amplitude of the displacement on the lung and diaphragm surface is shown in Figure 6. A general downward movement with similar amplitude can be observed for all methods. This movement is larger in lower lung regions, but is also present for upper lung regions. However, for PM and NPM the amplitude of this movement is higher closer to the bronchies and on the diaphragm than in regions close to the ribs. This can be explained by the fact that these methods are volumetric in nature and minimize a similarity function over the whole image domain. In contrast, PBM and STM do not consider image values outside the lung region and, therefore, extrapolate the displacement field. This leads to a pattern more similar to a ’rainbow’ for PM and NPM as opposed to a pattern of horizontally stacked layers in STM (and somewhat by PBM). None of the methods are currently capable of handling discontinuities in the displacement fields. In the surface renderings, NPM and PM show the most inhomogeneous characteristics. A desirable property of any registration method is to be consistent, i.e. to be independent of the chosen order of reference and target image. The consistency is determined by composing the forward (inhale to exhale) and the backward deformation fields and measuring the amplitude of the geometrical discrepancy at each position. Average and maximum error of the consistency maps inside the lung are summarized in Table 2. On average the consistency for all methods is good (less than 1.4 mm). However, as can be seen for case 7 in Figure 7 small regions can have significantly larger consistency error. Therefore, the maximum consistency error is additionally compared in Table 2. In our opinion this error better reflects clinical requirements. The PBM (19.8 mm) showed the worst results, followed by STM (14.8 mm), PM (10.7 mm), and by far the best NPM (5.2 mm).
5. CONCLUSION In this note four fully automatic methods are successfully applied to the registration of inhale to exhale CT images of the lung and therefore have proven to be robust. All the methods are developed independently and brought to a mature state, thus allowing a balanced competition between them. The resulting displacement fields are evaluated with respect to alignment of anatomical landmarks as well as by analyzing the fields themselves. All methods show a low target registration error of 2.5-3.3 mm. This seems to be a lower bound on achievable TRE error. However, the TRE seems not to be a sufficiently indicative criterion for clinical applications. In
Table 2. Evaluation of mean consistency error (in mm). Last row (AV) gives the average of the first ten rows.
Case 1 2 3 4 5 6 7 8 9 10 AV
PBM mean max 2.17 9.41 0.90 6.78 0.72 5.45 1.41 19.78 1.07 5.45 1.48 8.22 0.87 6.21 0.97 7.14 2.03 9.40 1.65 8.38 1.33
STM mean max 2.57 14.84 0.78 6.76 0.48 3.78 1.73 11.31 0.60 4.68 2.49 10.83 0.88 2.83 0.44 2.47 1.19 7.03 1.35 14.31 1.25
PM mean max 0.69 4.93 0.42 4.78 0.38 3.47 1.11 10.65 0.23 2.41 0.59 5.98 0.39 3.20 0.29 3.65 0.66 6.90 1.05 8.00 0.58
NPM mean max 0.27 4.48 0.18 2.34 0.22 2.62 0.72 5.15 0.05 0.62 0.13 1.25 0.17 1.15 0.18 2.55 0.17 1.80 0.30 2.05 0.24
Figure 3. Coronal slice from case 7: max exhale state, max inhale state, and the subtraction image (inhale minus exhale). 1.4 1.3 1.2 1.1 1 0.9 0.8 0.7 0.6
Figure 4. Volume preserving map inside the lung for case 7 (same slice as in Figure 3) for the PBM, STM, PM, and NPM (from left to right) is displayed. Blue color indicates local expansion whereas orange color values correspond to local contraction.
the same manner, we believe that the maximum consistency error is a clinically more relevant criterion than the average consistency error. Greater insight has been achieved by analyzing the resulting displacement fields. Despite the fact that from a physiological point of view there is no unique method for analysis, characteristics of the different methods become apparent through comparison.
10 8 6 4 2 0 −2
Figure 5. Inferior-superior displacement in mm inside the lung for case 7 (same slice as in Figure 3) for the PBM, STM, PM, and NPM (from left to right).
Figure 6. Amplitude of the displacement on lung and diaphragm surface for case 7 for the PBM (top left), STM (top right), PM (bottom left), and NPM (bottom right). Blue corresponds to 0 amplitude, red to 10 mm.
ACKNOWLEDGMENTS We thank Kevin Franks, Jean–Pierre Bissonette, Tom Purdie, and Andrea Bezjak, Radiation Medicine Program, Princess Margaret Hospital in Toronto, Canada and Michael Kaus, Philips Radiation Oncology Systems, for selecting the respiratory gated CT data sets and providing landmark annotations for the images.
4 3.5 3 2.5 2 1.5 1 0.5 0
Figure 7. A volume preserving map for the PBM, STM, PM, and NPM (from left to right) is displayed. A blue color indicates local expansion whereas orange color values correspond to local contraction.
REFERENCES 1. J. Ehrhardt, R. Werner, T. Frenzel, D. S¨ aring, W. Lu, D. Low, and H. Handels, “Reconstruction of 4D–CT data sets acquired during free breathing for the analysis of respiratory motion,” in Proc. of SPIE Medical Imaging, 6144, p. 614414, SPIE, 2006. 2. J. West, J. Fitzpatrick, M. Wang, B. Dawant, C. Maurer, R. Kessler, and R. Maciunas, “Comparison and evaluation of retrospective intermodality image registration techniques,” 1996. 3. P. Hellier, C. Barillot, I. Corouge, B. Gibaud, G. Le Goualher, D. Collins, A. Evans, G. Malandain, N. Ayache, G. Christensen, and H. Johnson, “Retrospective Evaluation of Inter-Subject Brain Registration,” IEEE Transactions on Medical Imaging 22, pp. 1120–1130, Feb. 2003. 4. K. Brock et al., “A Multi-Institution Deformable Registration Accuracy Study,” in I. J. Radiation Oncology, ASTRO 2007, 69(3), p. S44, 2007. 5. T. Glatard, X. Pennec, and J. Montagnat, “Performance evaluation of grid-enabled registration algorithms using bronze-standards,” in Proceedings of the Medical Image Computing and Computer-Assisted Intervention (MICCAI’06), pp. 152–160, Springer, Oct. 2006. 6. A. Hilsmann, T. Vik, M. Kaus, K. Franks, J.-P. Bissonette, T. Purdie, A. Beziak, and T. Aach, “Deformable 4dct lung registration with vessel bifurcations,” in Proc. International Conference of Computer Assisted Radiology and Surgery (CARS 2007), (Berlin, Germany), June 2007. 7. K. K. Brock, M. B. Sharpe, L. A. Dawson, S. M. Kim, and D. A. Jaffray, “Accuracy of finite element model–based multi–organ deformable image registration,” Medical Physics 32(6), pp. 1647–1659, 2005. 8. W. E. Lorensen and H. E. Cline, “Marching cubes: A high resolution 3D surface reconstruction algorithm,” Computer Graphics 21(4), pp. 163–169, 1987. 9. J. Weese, M. Kaus, C. Lorenz, S. Lobregt, R. Truyen, and V. Pekar, “Shape constrained deformable models for 3D medical image segmentation,” in Proc. of IPMI, pp. 380–387, Springer–Verlag, 2001. 10. J. von Berg, H. Barschdorf, T. Blaffert, S. Kabus, and C. Lorenz, “Surface based cardiac and respiratory motion extraction for pulmonary structures from multi-phase CT,” in Proc. of SPIE Medical Imaging, 6511, p. 65110Y, SPIE, 2007. 11. F. L. Bookstein, “Principal warps: Thin–plate splines and the decomposition of deformations,” IEEE PAMI 11(6), pp. 567–585, 1989. 12. D. Rueckert, L. Sonoda, D. Hill, M. Leach, and D. Hawkes, “Nonrigid registration using free-form deformations: Application to breast MR images,” IEEE Transactions on Medical Imaging 18(8), pp. 712–721, 1999. 13. S. Kabus, T. Netsch, B. Fischer, and J. Modersitzki, “B-Spline Registration of 3D Images with LevenbergMarquardt Optimization,” in Proc. of SPIE Medical Imaging, 5370, pp. 304–313, SPIE, 2004. 14. J. Modersitzki, Numerical methods for image registration, Oxford University Press, 2004. 15. N. Papenberg, H. Schumacher, S. Heldmann, S. Wirtz, S. Bommersheim, K. Ens, J. Modersitzki, and B. Fischer, “A fast and flexible image registration toolbox – design and implementation of the general approach,” in Proc. of BVM, pp. 106–110, Springer–Verlag, 2007.