May 1, 2005 - in Carterton district, New Zealand (Taverage=11.9-. 26.8 oC and wind speed = 75-157 km d-1) cultivated with planted with two orchards tree.
VALIDATION AND VERIFICATION OF MEINAL UNDER DIFFERENT AGRICULTURAL CONDITIONS T. K. Zin El-Abedin1 and Ramzy M.R. Hedia2 Received on: 5/1/2005
Accepted on: 9/4/2005 ABSTRACT
Meinal is a management tool that can be used to improve the decision making for the management and environmental impacts on nitrogen transformation and transport in agriculture lands. It incorporates the main processes that contribute to the level of residual soil nitrate and deep water percolation. Based on a new rating procedure, the model calculates two indices for the residual soil nitrate risk (RSNRI) and deep water percolation (DWPI). A final index of the nitrate leaching risk index (NLRI) is calculated as a weighted average of the RSNRI and DWPI. A computer program was developed for the model in both QBasic (Ver.1 for MS DOS) and in Visual Basic 6 (Ver.2 for MS Windows). It is an object oriented format, more accessible and friendly used. The model was validated using different sets of real field data using several statistical parameters and it proved to have a high predictability of the potentiality for nitrate leaching risk. Verification of the model and the performance of its logic structure were also conducted. Three case studies representing various environmental and managerial scenarios were considered. Plots of predicted RSNRI, DWPI and NLRI indices were evaluated. The model was found to be sensitive to changes in both the temperature and soil moisture factors. According to the obtained NLRI by the model, the susceptibility of the groundwater to pollution with nitrate was ranked into six classes. The model has the advantages of 1) its minimum and simple data set requirements which are readily available in any soil laboratory, 2) assessment of the impacts of several soil, environmental or management scenarios, and 3) It can help decision makers in building a national or regional database for the assessment of groundwater pollution potentialities under diverse agricultural circumstances without the need for a high experience to analyze the program outputs.
INTRODUCTION o support decision making strategies expert, precise and user friendly tools are needed. This necessitates the testing of alternative environmental and managerial scenarios which are expected to give suitable answers for a matrix of many unanswered questions. Addiscott et al. (1995), Hedia (2000) and Aggag (2001) revealed that most existing models developed to predict nitrate leaching in agricultural soils deal with one or more processes in agricultural systems. Most of these models were developed to describe the dynamics of nitrogen in the environment and its impact on groundwater pollution with nitrate leaching losses. However, such models need large arrays of data sets, sophisticated instrumentation analyses and highly technical and scientific experiences. Therefore, these models must be modified and simplified. Therefore, the MEINAL model (Hedia and Zin El-Abedin, 2005) was proposed for the evaluation of the environmental and management impacts on nitrogen pathways in agricultural lands. A new method was developed for rating the influences of the vadose zone properties, environmental and management factors on deep water percolation and soil residual nitrate and their impacts on the pollution of groundwater with nitrate. Thus, the potentiality for nitrate to travel through the unsaturated zone with deep percolating water to reach the groundwater can be assessed. The important processes that can contribute significantly to deep water percolation and nitrate leaching were assigned as the principal processes
T
considered by the MEINAL model. The extent of the influence of each factor on any process considered was given a rating ranged from 0 to 1 according to its level and mode of action. In addition, each factor was given a weight (ranged from 1 to 5) relevant to its relative importance in controlling the process of interest. An index was calculated for each principal process as the weighted average of the ratings of the controlling factors encountered. Indices of all considered processes were used to calculate the surface water runoff index (SWRI), deep water percolation index (DWPI) and soil residual nitrate index (SRNRI). From these indices, the final nitrate leaching risk index (NLRI).was calculated. However, the performance of the MEINAL model and the consistency of its logic structure need to be verified. Therefore, the objectives of this study were to: i) Formulate the MEINAL model into simple comprehensive decision making software under both the MS DOS and Windows media. ii) Validate the performance and the logic structure of the designed model by comparing the calculated indices with various real data on deep water percolation, soil nitrate storage and nitrate leaching. iii) Verify the MEINAL model for various soils, environmental and managerial conditions. iv) Establish a ranking scale for the potentiality of groundwater pollution with nitrate based on the calculated nitrate leaching risk index (NLRI).
SOFTWARE DEVELOPMENT The flowchart and algorithms of the MEINAL model (Hedia and Zin El-Abedin, 2005) were used to
design the software of the model. Two versions of this model were established: 1- MEINAL Ver. 1, for MS DOS version written using the Quick Basic packages (Microsoft, 1987). 2- MEINAL Ver. 2, for MS Windows version written using the Visual Basic 6 packages (Norton and Groh, 1998)). The DOS version has a main screen that directs the user to the following user interfaces: 1- Seven input screens which contain the input parameter required by MEINAL model as follows: a- Location data: this includes ID (number or name of the study case), Farm, Owner, E and N-coordination, depth to water table (cm), surface slope (%) and area (ha). b- Soil physical properties: this includes sand and clay contents (%), volumetric soil moisture content at field capacity and welting point (%), soil bulk density(Mgm-3), basic infiltration rate (cm hr-1) and harmonic mean of the hydraulic conductivity of the soil profile (m d-1). c- Soil chemical properties: this includes soil pH, soil organic matter and CaCO3 contents (%), cation exchange capacity (cmolc kg-1) and residual soil nitrate content (kg N ha-1). d- Weather data: this includes minimum and maximum soil temperatures (oC), wind speed (km h-1), rainfall (mm/season). e- Crop data: this includes effective crop root depth (cm), maximum ETcrop (mm d-1), crop N- requirement (kg N ha-1) and its growth period (d). f- Irrigation management data: this includes water depletion (%), type of irrigation system, depth of irrigation water (mm), sprinkler precipitation rate (mm h-1), emitter discharge (l h-1), number emitter per plant and effective irrigation time (h). g- Fertilization management data: this includes NO3-N concentration in irrigation water (ppm), rate of N-fertilizer application (kg N ha-1), number of N-fertilizer doses, Nfertilizer type, method of N-fertilizer application, type, C/N ratio and application rate (m3 ha-1) of organic fertilizer. 2- Seven screens for the modification of the input data for alternative scenarios. 3- Screens for the evaluation results. 4- A screen for creating input and tabulated output data files.
5- A screen about the authors, development and running the model.
The windows version of the MEINAL model (Figure 1) is a menu driven application that facilitates the use of the program and the flexibility to move between the entries and the ability to store and retrieve the input data through the built in database query. This application written by the Visual Basic 6 packages contains the following main menu and commands: 1- File Menu: this includes New Data, Import Data, Save Inputs, Save Outputs, Print and Exit commands. 2- Data Menu: this includes Location, Soil Properties, Weather, Crop, Irrigation, Fertilization commands for data entry. 3- Calculations: this includes the Evaluation command to begin calculations. 4- Database: this includes Previous Record, Next Record and Delete Record commands to manipulate the database. 5- Help: this includes the About MEINAL and About Us commands to present information about the model and the programmers, respectively. RUNNING THE MEINAL MODEL On running the MEINAL program, the user enters the requested input data through the aforementioned screens (Ver.1) or forms (Ver.2). All entries are checked by the program through its built in controls to assure that each entry falls within the acceptable normal range. Any empty and /or zero entry is checked by the program to avoid run time errors. The visual basic version (Ver.2) has the advantages of i) option, check and combo boxes facilities for direct selection of irrigation and fertilization management entries, ii) on spot editing of input data ii) the possibility of database build up and iv) graphic presentations of the calculated indices. The program initiates four temperature intervals (ranging from the minimum and maximum temperature) and four soil moisture intervals (ranging from the soil moisture content at irrigation to 0.8 of soil porosity) at which sixteen ratings of the all considered factors are calculated. This could help in the simulation of the variable conditions of soil moisture levels during each irrigation interval. In addition, averages of the ratings and indices are calculated over the runs executed by the program.
Figure (1): The main window for MEINAL Ver.2
Figure (2): An example of the MEINAL output report.
The output report of the MEIANL program at the simulated 16 soil temperatures and moisture contents and their averages can be displayed on screen and stored in an ASCII files. A sample output report of the program is shown in Figure (2). The output report is divided into three sections: a) The upper section (A) presents the calculated values of the ratings of the surface slope, crop cover, soil moisture and infiltration rate factors from which the surface water runoff index (SWRFI) is calculated. Rating of the irrigation interval, conductance and water balance factors and their corresponding deep water percolation indices (DWPI). b) The middle section (B) presents the calculated ratings of the major soil, management and environmental factors (soil moisture, pH, temperature, organic matter, etc.) impacts on the main processes involved the nitrogen cycle in soils. From these values nitrification, denitrification, volatilization, mineralization and plant uptake indices are calculated. c) The lower section (C) presents the calculated final residual soil nitrate (RSNRI) and nitrate leaching (NLRI) risk indices. VALIDATION OF MEINAL To validate the MEINAL model, real data on input parameters and field measurements of deep water percolation, soil nitrate storage and the amount nitrate leaching under different conditions were utilized. Data from four field studies conducted by Madramootoo et al. (1999), Aggag (2001), Mahmood et al. (2002) and Hanson et al. (2004) were used to represent different combinations of soil, environmental and managerial scenarios as follows: 1- Madramootoo et al. (1999) validated DRAINMOD-N model by comparing simulated results with measurements of water table depth, drain flow, soil nitrate content, cumulative nitrate leaching from conventional drainage and surface irrigation field plots cultivated corn. A field study was conducted during the 1994 growing season on a 4.2-ha site located in Soulanges County, Quebec (Taverage=10-20 oC and wind speed = 274-343 km d-1). The soil was a clay loam (clay= 31%, sand= 35%, BD= 1.43 Mg m-3, Ks= 0.34 cm h-1, WP= 0.17 cm3 cm-3 and FC= 0.31 cm3 cm-3). The soil surface slope was < 0.5% in average. Two cropping systems, monocropped corn (Zea mays L., cv. Pioneer 3921) and corn intercropped with annual Italian ryegrass (Lolium multiflorum L. cv. Barmultra), were factorially combined with three water table depth treatments (1.0, 0.75 and 0.5 m depth). These six treatments received three application rates of N-fertilizer (0, 180 and 270 kg N ha-1).
2- Aggag (2001) on coarse sandy soil (sand= 96%, CaCO3= 5.4%, BD= 1.7 Mg m-3, WP= 5%v , FC= 11%v pH=8.01, CEC= 4.1 cmolc kg-1, SOM= 0.06% and Ks = 11.2 cm h-1) in El-Bostan region (Taverage=11.9-26.8 oC and wind speed = 75-157 km d-1) cultivated with groundnut (Giza 5, ETcrop= 6.4 mm d-1) and sesame (Giza 32, ETcrop= 6.01 mm d-1) under fixed sprinkler system (14 mm h-1) during two seasons (1997 and 1998). Three irrigation treatments (100, 150 and 200% of ETcrop) and three mineral N-fertilizer levels (47.6, 95.2 and 142.9 kg N ha-1) for groundnut were applied. For sesame, two methods of N-fertilizer application (broadcast and fertigation) were investigated under the same irrigation treatments. Measurements of soil moisture storage, applied irrigation water and ETcrop were used to calculate the amount of deep water percolation using the water balance approach. Measured soil nitrate storage and plant N-uptake were used to calculate the amount of leached nitrate below the root zone. 3- Mahmood et al. (2002) on a silt loam soil (clay = FC= 16%, sand= 31%, WP= 11%v, 27%v,pH=7.01, BD= 1.42 Mg m-3, CEC= 12.4 cmolc kg-1, SOM= 2.5-4.5% and Ks = 1.48 cm h-1) in Carterton district, New Zealand (Taverage=11.926.8 oC and wind speed = 75-157 km d-1) cultivated with planted with two orchards tree species (Eucalyptus nitens and Eucalyptus ovata) and pasture. Three irrigation treatments under drip irrigation system were applied (30, 45 and 100 mm/ week). Emitter discharge was 2.88 l h-1 with 0.25 m spacing. Soil moisture profiles, volume and nitrate concentration of the leachate were monitored. Yields and N-uptake were also measured. 4- Hanson et al. (2004) on three soil types: sandy loam (clay=11%, sand= 64%, WP= 9%v, FC= 20%v, Ks= 2.33 cm h-1, BD= 1.55 Mg m-3) loam (clay=20%, sand= 43%, WP= 13%v, FC= 26%v, Ks= 0.84 cm h-1, BD= 1.41 Mg m-3) and silt clay (clay=46%, sand= 9%, WP= 26%v, FC= 43%v, Ks= 0.27 cm h-1, BD= 1.23 Mg m-3) under different fertigation strategies (N doses and timing) for micro-sprinkler (discharge rate 26 l h-1) and drip (emitter discharge 3.7 l h-1) irrigation systems. The effects of different irrigation and fertilizer treatments on water and nutrient use efficiencies and nitrate leaching were examined. Distributions of nitrate and soil water of the root zone were evaluated. Since DWPI, RSNRI and NLRI indices are the ultimate outputs of the MEINAL model, comparison and correlation between these predicted indices and the corresponding field measurements from these studies were carried out. Field data on deep water percolation were transformed as a fraction of the total amount of water received. Soil nitrate contents and the
amounts of nitrate leaching were also transformed as a fraction of the total amount of applied N-fertilizer. Several statistical parameters were used in the evaluation process (Zin El-Abdin and Ismail, 1999). A linear relationship between the predicted indices by MEINAL and the corresponding observed data was established. The regression equation was in the form ∧
∧
Y = λ Yo
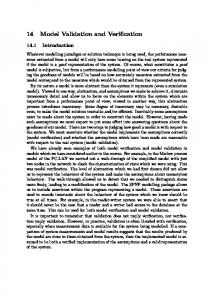
Where Y and Yo are the predicted and observed data, respectively. λ is the regression coefficient. The parameters used in the evaluation were as follows: 1- The coefficient of determination (R2) which represents the scatter of points about the regression equation. 2- The regression coefficient (λ) which generally indicates the overall trend of prediction (under or over prediction). 3- The absolute value of average prediction error based on regression fit (Er) in percent, given by the relation: Er = |1- λ| 100, which shows the error based on the overall trend of the majority of data. 4- The correlation coefficient (Corr) which represents the association between the predicted and observed data. The obtained linear relationships between the predicted DWPI, RSNRI and NLRI indices and the observed data obtained by Madramootoo et al. (1999), Aggag (2001) and Hanson et al. (2004) are presented
in Figures 3, 4 and 5, respectively. For deep water percolation, R2 values ranged from 0.77 to 0.97 depending on the type of irrigation systems and the amount of water applied. The lowest R2 was obtained with surface irrigation system (higher field variability). For the residual soil nitrate risk (R2 range 0.75-0.80), similar trend was also obtained like that of deep water percolation. The highest R2 value obtained with drip irrigation is may be due to the better N-fertilizer distribution through fertigation. The nitrate leaching risk generally recorded the lowest R2 values (range 0.62 – 0.72). This was expected because of the complex multi-directional interacting processes that contribute to leaching. The calculated parameters λ, Er and Corr are listed in Table (1). Slight underestimation of the NLRI by MEINAL was found with all the tested data indicated the values of λ less than one. Underestimation of RSNRI was also found for drip and sprinkler irrigation. Under sprinkler irrigation, underestimation of DWPI was also obtained. The obtained average prediction error (Er) values were low and ranged from 1.0 to 17.0%. Moreover, high association between the predicted MEINAL indices and the corresponding observed data were obtained indicated by the high values of the correlation coefficient (Corr) which ranged from 0.83 to 0.99. This reveals the validity of MEINAL to evaluate the impacts of diverse environmental and managerial scenarios on the dynamics of nitrogen in agricultural lands and to predict the potentiality of nitrate leaching risk.
Table (1): Calculated statistical evaluation parameters of the MEINAL model for prediction of RSNRI and NLRI indices. Source of Field Data Index n R2 Er λ DWPI 36 0.94 0.89 6.0 Aggag (2001) RSNRI 36 0.99 0.78 1.0 Coarse sandy soil, One irrigation methods (sprinkler), 3 NLRI 36 0.83 0.67 17.0 water treatments, 3 N-fertilizer rates, 2 crops
DWPI, Corr 0.95 0.89 0.93
Mahmood et al. (2002) Silty loam soil, One irrigation methods (drip), 3 water treatments, 1 N-fertilizer rate, 3 crops
DWPI RSNRI NLRI
18 18 18
1.06 0.94 0.94
0.97 0.80 0.72
5.7 6.0 6.0
0.99 0.90 0.85
Hanson et al. (2004) 3 soil types, 2 irrigation methods (drip), 3 N-application methods, 1 crop
DWPI RSNRI NLRI
18 18 18
1.04 0.95 0.93
0.95 0.84 0.70
4.0 5.0 7.0
0.98 0.93 0.86
Madramootoo et al. (1999) Clay loam soil, surface irrigation, 3 water table depths, 3 N-application rates, 2 crops
DWPI RSNRI NLRI
36 36 36
1.05 1.15 0.91
0.77 0.67 0.75
5.0 15.0 9.0
0.88 0.83 0.87
0.80 Predicted DWP Index
0.70
y = 1.0491x R2 = 0.7673
0.60 0.50 0.40 0.30 0.20 0.10 0.00 0.00
0.20
0.40
0.60
0.80
Deep Water Percolation as a Fraction of Applied Water
0.80
Predicted RSNR Index
0.70
y = 0.913x R2 = 0.7535
0.60 0.50 0.40 0.30 0.20 0.10 0.00 0.00
0.20
0.40
0.60
0.80
Residual Soil Nitrate as a Fraction of N-Fertilizer Applied
0.80
Predicted NLR Index
0.70
y = 1.1452x R2 = 0.6679
0.60 0.50 0.40 0.30 0.20 0.10 0.00 0.00
0.20
0.40
0.60
0.80
Nitrate Leaching as a Fraction of N-Fertilizer Applied
Fig.(3): Validation of the MEINAL predicted indices and the corresponding measured values of deep water percolation, soil residual nitrate and leached nitrate by Madramootoo et al (1999).
0.8
Predicted DWPI
0.7 0.6 0.5
y = 0.9443x R2 = 0.8922
0.4 0.3 0.2 0.1 0.0 0.0
0.1
0.2
0.3
0.4
0.5
0.6
0.7
0.8
Measured Deep Water Percolation Fraction
0.8 y = 0.9908x R2 = 0.7832
Predicted RSNRI
0.7 0.6 0.5 0.4 0.3 0.2 0.1 0.0 0.0
0.2
0.4
0.6
0.8
Measured NO3 Storage Fraction
0.8 y = 0.8292x R2 = 0.6749
0.7 Predicted NLRI
0.6 0.5 0.4 0.3 0.2 0.1 0.0 0.0
0.2
0.4
0.6
0.8
Measured NO3 Leaching Fraction
Fig.( 4): Validation of the MEINAL predicted indices and the corresponding measured values of percolation, soil residual nitrate and leached nitrate by Aggag (2001).
deep water
Predinted DWP Index
0.8 y = 1.0565x R 2 = 0.9736
0.7 0.6 0.5 0.4 0.3 0.2 0.1 0.0 0.0
0.1
0.2
0.3
0.4
0.5
0.6
0.7
0.8
Deep Water Percolation as a Fraction of Applied Water
Predinted RSNR Index
0.8 0.7 0.6
y = 0.9358x R2 = 0.8011
0.5 0.4 0.3 0.2 0.1 0.0 0.0
0.1
0.2
0.3
0.4
0.5
0.6
0.7
0.8
Residual Soil Nitrate as a Fraction of Total Applied N-Fertilizer
0.8 y = 0.9419x R2 = 0.7148
Predinted NLRI Index
0.7 0.6 0.5 0.4 0.3 0.2 0.1 0 0.0
0.1
0.2
0.3
0.4
0.5
0.6
0.7
0.8
Nitrate Leaching as a Fraction of Total Applied N-Fertilizer
Fig.( 5): Validation of the MEINAL predicted indices and the corresponding measured values of deep water percolation, soil residual nitrate and leached nitrate by Hanson et al (2004).
VERIFICATION OF MEINAL For verification purposes, three case studies were considered to examine the performance and the logic structure of the designed model. These case studies represent different soil types, environmental conditions and managerial practices. Hence, this can be considered an evaluation of alternative management scenarios. Table (1) lists the input parameters used for running the MEINAL model. Case study 1 represents a coarse textured sandy soil in Nubaria region, 82 km southwest of Alexandria (Awad, 1994). Case study 2 represents a calcareous loamy soil in El-Bangar area,
50 km southwest of Alexandria (Hedia and El-Attar, 2004). Case study 3 represents a clayey alluvial soil of Damanhour area, 60 km east of Alexandria (ElFayoumy, 1989). Figure (6) illustrates an example of the tabulated output of the calculated indices for the considered processes and the final RSNRI and NLRI indices. The model was run for several combinations of input parameters related to the soil, management and environmental factors as listed in Table (1).
Figure (6): An example tabulated output file for the MEINAL model. The calculated risk indices were plotted against temperature at different soil moisture levels (Figures 7 through 11). The evaluation of the outputs of these runs revealed that: 1- Under all tested conditions, the model was found to be sensitive to the changes in temperature (1035 oC). It was also found that values of the final residual soil nitrate and nitrate leaching risk indices changed with changing the temperature range (Figure 7 through 11). 2- Inspection of the obtained outputs in Figures (7 through 11) also indicated that changes in soil moisture contents greatly affect the ratings of the factors affecting all processes and the calculated risk indices under the all tested conditions. 3- In general, the calculated indices took an increasing trend with decreasing the soil moisture content, where I > II > III > IV (Figure 7 through 11). 4- The highest values for the residual soil nitrate risk index (RSNRI) were obtained at temperatures very close to the optimum temperature of the soil microorganisms (25-30 oC), Figure (7 through 11).
5- RSNRI had the highest values at the highest soil moisture contents under drip irrigation compared with sprinkler and surface irrigation systems (Figure 7). 6- Changing the soil type from El-Bangar (calcareous, loamy) to Damanhour (alluvial, clayey) changed the overall behavior and trends of the calculated ratings and indices (Figure 7 A and B, respectively). The effect of the soil type is more pronounced at the highest levels moisture contents than at low levels. This of course reflects the effect of the hydrological properties of such soils. 7- When the impact of the irrigation system was tested under the loamy soil (Figure 7A), the nitrate leaching risk index can be arranged in the following order: surface continuous > surface surge = surface alternative > sprinkler > drip. Although the same trend was obtained with the clayey soil, the obtained values of the index were generally lower for this soil under all tested temperature and soil moisture conditions.
Table (2): Input parameters of the three case studies run by MEINAL model. Criteria Nubaria El-Banger Damanhour I- Location: 1- Depth to Water Table (cm) 200 100 60 2 2- Surface Slope (%) 2 2 3- Area (ha) 10 10 10 II- Soil Physical Properties: 1- Sand (%) 95 20 15 2- Clay (%) 2.5 25 40 3- Welting point (%) 4 6.0 12 4- Field Capacity (%) 8 20 35 5- Bulk density (Mg m-3) 1.7 1.4 1.25 6- Basic Infiltration (cm h-1) 20 3 0.1 7- Harmonic average K (m d-1) 5 0.7 0.02 III- Soil Chemical Properties: 1- pH 7.5 7.8 8.5 2- CaCO3 (%) 0 20 1.5 3- CEC (cmol kg-1) 4 20 40 4- O.M. (%) 0.05 2.5 5 5- Residual NO3-N (kg N ha-1) 10 20 30 IV- Weather Data: 1- Minimum T (oC) 10 10 10 2- Maximum T (oC) 35 35 35 3- Wind Speed (km h-1) 25 25 25 4- Rainfall (mm/season) 50 100 0 V- Crop Parameters:1- Effective Root Depth (cm) 40 40 40 2- Max. ETcrop (mm d-1) 7 6 8 3- Crop N- Requirement (kg N ha-1) 250 250 250 4- Growth period (d) 150 150 150 VI- Irrigation Management Data: 1- Water Depletion (%) 50 50 30 2- Type of Irrigation System Surface Surface Depth of Irrigation Water (mm) 100 100 Sprinkler Sprinkler Sprinkler Sprinkler Precipitation Rate (mm h-1) 10 10 10 Drip Drip Drip Emitter discharge (L h-1) 4 4 4 No. Emitter per plant 2 2 2 Effective Irrigation Time (h) 2 3 1 VII- Fertilization Management Data: 1- NO3-N Concentration in water (ppm) 10 10 10 2- Rate of N-Fertilizer Appl.(kg N ha-1) 250 250 250 3- N-Fertilizer Doses 3/10 3/10 3/10 4- N-Fertilizer Type NH4NO3 NH4NO3 NH4NO3 5- Method of N Application Incorpor. Broad Broad 6- Organic Fertilizer Chicken M. Chicken M. Farm M. 18 18 20 a- C/N b- Rate of Org. Fertilizer Appl.(m3 ha-1) 25 25 25 8- El-Bangar soil had higher values of both soil residual nitrate (RSNRI) and nitrate leaching (NLRI) risk indices than the Damanhour soil (clayey) under the four chosen irrigation systems (Figure 7). 9- The highest values of RSNRI were obtained with the Nubaria soil (sandy) under the sprinkler and drip irrigation systems (Figure 8 and 9). 10- Differences in the hydraulic properties of the tested soils were reflected on the calculated deep
water percolation index (DWPI) and hence on the NLRI (Figure 8 and 9). For the three studied soil types, the RSNRI was the highest under drip irrigation compared with sprinkler systems. On the other hand, the values of the NLRI were reduced due to the very low value of the DWPI under drip irrigation. This means that plants can still make use of the soil residual nitrate under drip irrigation condition.
0.7
0.7
A
IV
0.6
I
0.6
III
II
Values of indices
Values of indices
0.5 0.4 0.3 0.2 0.1
RSNRI
NLRI
Drip Sprinkler Continue Surge
B
Drip Sprinkler Contonue Surge
0.5 0.4 0.3 0.2 0.1
0.0
0.0
10 18 27 35
10 18 27 35
10 18 27 35
10 18 27 35
10 18 27 35
10 18 27 35
10 18 27 35
B
A 0.6
0.6
0.5
0.5 Values of indices
Values of indices
10 18 27 35
0.7
0.7
0.4 0.3 0.2 0.1
0.4 0.3 0.2 0.1
0.0
0.0 10 15 20 25
10 15 20 25
10 15 20 25
Soil Temperature ( oC)
10 15 20 25
10 15 20 25
10 15 20 25
10 15 20 25 o
Soil Temperature ( C)
Fig. (7): RSNRI and NLRI indices calculated at two temperature ranges and four soil moisture levels (I>II>III>IV) under three irrigation systems for two different soils, A) El-Bangar and B) Damanhour soils.
10 15 20 25
0.7
RSNRI
NLRI
Nubaria El-Bangar Damanhour
0.6
Nubaria El-Bangar Damanhour
A
V a l u e s o f i n d ic e s
0.5 0.4 0.3 0.2
I I I
III
II I
IV
0.1 0.0 10 18 27 35
10 18 27 35
10 18 27 35
10 18 27 35
0.7
B 0.6
V a lue s o f in d ic e s
0.5 0.4 0.3 0.2 0.1 0.0 10 15 20 25
10 15 20 25
10 15 20 25
10 15 20 25
Soil Temperature (oC)
Fig. (8): RSNRI and NLRI indices calculated at two temperature ranges A)10-35 and B) 10-25 oC, and four soil moisture levels (I>II>III>IV) under drip irrigation system for three different soil types.
0.7
RSNRI Nubaria ٍ◌ El-Bangar Damanhour
0.6
NLRI Nubaria El-Bangar Damanhour
A
Values fo Indic es
0.5 0.4 0.3
I
II
III
10 18 27 35
10 18 27 35
10 18 27 35
IV
0.2 0.1 0.0 10 18 27 35
0.7
B
Values of indices
0.6 0.5 0.4 0.3 0.2 0.1 0.0 10 15 20 25
10 15 20 25
10 15 20 25
10 15 20 25
Soil Temperature (oC)
Fig. (9): RSNRI and NLRI indices calculated at two temperature ranges A)10-35 and B) 10-25 oC, and four soil moisture levels (I>II>III>IV) under sprinkler irrigation system for three different soil types.
RSNRI
0.7
NLRI
200 cm 100 cm 60 cm
0.6
200 cm 100 cm 60 cm
A
Values of indices
0.5 0.4 0.3
I
II
III
IV
10 18 27 35
10 18 27 35
0.2 0.1 0.0 10 18 27 35
10 18 27 35
0.7
B 0.6
Values of indices
0.5 0.4 0.3 0.2 0.1 0.0 10 15 20 25
10 15 20 25
10 15 20 25
10 15 20 25
Soil Temperature (oC)
Fig. (10): RSNRI and NLRI indices calculated at two temperature ranges A)10-35 and B) 10-25 oC, and four soil moisture levels (I>II>III>IV) under three water table levels for El-Bangar soil.
RSNRI
0.7
NO3 form NH4 form Urea
NLRI NO3 form NH4 form Urea
A
0.6
Values of indices
0.5
0.4
0.3
I
II
III
IV
10 18 27 35
10 18 27 35
0.2
0.1
0.0 10 18 27 35
10 18 27 35
0.7
B
Values of indices
0.6 0.5 0.4 0.3 0.2 0.1 0.0 10 15 20 25
10 15 20 25
10 15 20 25
10 15 20 25
Soil Temperature (oC)
Fig. (11): RSNRI and NLRI indices calculated at two temperature ranges A)10-35 and B) 10-25 oC, and four soil moisture levels (I>II>III>IV) under three fertilizer types for El-Bangar soil.
11- The values of the NLRI index were reduced for the three soils ( NH4 NO3 > NH4 = Urea. 14- To test the maximum and minimum values of the nitrate leaching risk index which can be obtained, the model was run for two extreme theoretical case studies as follows; a- A Coarse sandy soil irrigated with high amount of water through surface continuous irrigation and high NO3–form application in winter season with a shallow water table. Surface slope was assumed even and surface cover was 20%. These conditions resulted in a nitrate leaching risk index (NLRI) of 0.6. b- A heavy clayey soil irrigated with optimum amount of water through drip irrigation and optimum amount of NH4form fertilizer in a summer season with a very deep water table. Surface slope was 2% and surface cover was 90%. These conditions resulted in a nitrate leaching risk index of < 0.1. Accordingly, the calculated NLRI by the MEINAL model was ranked as in Table (3). Table (3): Ranking groundwater vulnerability to pollution with nitrate based on the calculated NLRI. NLRI Risk Classes < 0.1 No Risk or Safe 0.10 – 0.20 Slightly Risky 0.21- 0.30 Moderately Risky 0.31- 0.40 Risky 0.41- 0.50 Very Risky > 0.50 Extremely Risky Applying this scaling on the obtained data in Figure (4) El-Bangar soil could be ranked as moderately risky (NLRI = 0.20-0.25) under surface continuous or surge irrigation system. However, this soil could be ranked as safe (NLRI