Water 2015, 7, 6616-6633; doi:10.3390/w7116616 OPEN ACCESS
water ISSN 2073-4441 www.mdpi.com/journal/water Article
Validation of a Locally Revised Topographic Index in Central New Jersey, USA Zeyuan Qiu Department of Chemistry and Environmental Science, New Jersey Institute of Technology, Newark, NJ 07102, USA; E-Mail:
[email protected]; Tel.: +1-973-596-5357; Fax: +1-973-596-3586 Academic Editor: Miklas Scholz Received: 19 August 2015 / Accepted: 12 November 2015 / Published: 18 November 2015
Abstract: Saturation excess is a major runoff process in humid regions such as the US Northeast. Topographic index (TI) is used to simulate the pattern of runoff-contributing areas following a saturation excess runoff process. Although TI is useful to delineate saturated areas, i.e., hydrologically sensitive areas, for taking spatially distinctive actions in watersheds for improving water quality, local resource management practitioners often question its applicability to local conditions. This study introduces two methods to validate a locally revised TI in humid central New Jersey, USA. The revised TI uses soil moisture deficit instead of water table depth as the state variable in simulating the saturation excess runoff process. First, the calculated TI values were compared to the soil moisture measurements sampled in two sites in Tewksbury Township in the region to evaluate their correlations. Second, a watershed model Variable Source Load Function (VSLF) that incorporates TI was applied to the Neshanic River Watershed in the region and compared to another watershed model Soil and Water Assessment Tool (SWAT) to evaluate its capability in predicting the streamflow and its runoff and baseflow components. The positive correlations between soil moisture measurements and TI suggested TI is a good indicator of runoff-generating potential. VSLF achieves a modeling efficiency comparable to SWAT in simulating watershed hydrology. Such validation gives practitioners confidence to incorporate TI pattern into watershed management practices for improving their efficiency. The results are applicable to shallow, interflow-driven watersheds in humid regions.
Water 2015, 7
6617
Keywords: variable source area hydrology; topographic Index; soil moisture; Variable Source Load Function (VLSF) Model; Soil and Water Assessment Tool; Neshanic River watershed
1. Introduction Saturation excess is a major runoff process in humid regions such as the US Northeast and can be better captured by a physical hydrology concept called Variable Source Area (VSA) hydrology [1–3]. The VSA hydrology applies a saturation-excess hydrological process to explain that runoff-carrying pollutants contribute to the stream hydrograph are primarily generated in relatively small but predictable hydrologically sensitive areas in a watershed where soils are saturated [4–6]. The VSA hydrology presents interesting insights regarding the complex hydrological connections between streams and their upland contributing areas and offers practical guidance on managing the upland contributing areas to achieve desired water quality in streams. The VSA hydrology has been closely linked to the delineation and management of critical source areas (CSAs) for achieving long-term water quality goals and the sustainability of managing water resources more efficiently and effectively [7–13]. The topographic index (TI) was first introduced as a basis for a rainfall-runoff model, the TOPography-based hydrological MODEL (TOPMODEL), which simulates the pattern of surface runoff-contributing areas following the VSA hydrology [13]. The index measures the propensity of a given point in a watershed to become saturated and act as a source area for surface runoff [14]. The index is often called a wetness index and is used to predict soil moisture distribution in the landscape [15,16]. Because of its simplicity and ability to visualize the spatial predictions, TI has been widely adopted to simulate hydrologic processes with various modifications and extensions that reflect different modeling assumptions and take account of additional natural resource conditions [17–19]. TI and its variants have been incorporated into rainfall-runoff models to predict streamflow [20–23]. TI and its variants had been subject to intensive investigation on its ability to predict the spatial pattern of runoff-contributing areas in hydrology literature. The predicted spatial patterns were compared to the measured soil moisture pattern [24–26], the shallow groundwater table [27,28], and the observed wetland occurrence [29,30]. However, the validation results were mixed. While reasonable correlation between observed soil moisture patterns and TI was found [31,32], many found a poor correlation between predicted and observed spatial patterns, especially the point-to-point correlation [33–35]. The poor correlation was not entirely unexpected because of measurement errors and varying local resource conditions [35]. One TI variant was to re-conceptualize TI using the soil moisture deficit instead of the water table depth as the state variable to make it applicable to shallow, interflow-driven watersheds in the US Northeast [36]. The revised TI has been extensively evaluated in terms of its ability to predict the spatial pattern of runoff-contributing areas, and to predict streamflow in the New York Catskill Mountains. The patterns of runoff potential as predicted by the revised TI were compared to the field soil monitored moisture pattern and to the runoff pattern predicted by a fully distributed Soil Moisture Routing (SMR) model in the Town Brook Watershed in the same region [11,37]. SMR is a
Water 2015, 7
6618
mechanistic physical-based, spatially distributed model that captures the VSA hydrology of humid, temperate regions such as the US Northeast that have highly permeable, sloping soils over a restricting layer [38]. They concluded the revised TI was a good indicator of runoff risk, especially in US Northeast. A normalized difference water index derived from medium resolution Landsat 7 Enhanced Thematic Mapper Plus (ETM+) images using an unsupervised classification method was used to delineate the saturated areas, and the delineated pattern of saturated areas matched the predictions made using the revised TI in the Town Brook watershed well [39]. A variable source loading function (VSLF) model was developed by incorporating the revised TI to modify the Soil Conservation Service curve number (SCS-CN) rainfall-runoff method in the popular General Watershed Loading Function (GWLF) model [40,41]. The VSLF model provides a much more valid spatial distribution of soil moisture and runoff generation as compared to the GWLF and other current SCS-CN-based water quality models. Consequently, using such a model could improve the simulation accuracy of pollutants transported by runoff [23]. The objective of this study is to validate this locally revised TI in central New Jersey, which is located in the humid US Northeast. Two methods were used to evaluate how well the revised TI would perform in terms of its ability to predict VSA patterns and watershed hydrology in central New Jersey. First, the soil moistures were measured using a time domain reflectometry (TDR) soil moisture meter in selected fields and the TDR measurements were compared to the TI values to evaluate their correlations. Second, the VSLF model was applied to a suburban watershed with mixed land uses located in central New Jersey and the modeling results will be compared to a distributed biophysical model called the Soil and Water Assessment Tool (SWAT), which was applied to the same watershed to evaluate its capability in predicting streamflow and its runoff and baseflow components. Located at the outskirts of the New York metropolitan area, central New Jersey has been experiencing rapid urban development as a part of suburbanization and exurbanization processes, which creates substantial stresses to natural resources. Local communities have been active in protecting their natural resources for achieving the long-term sustainability of water resources in the region. The TI validation results would help the local communities to adopt spatially targeting strategies to direct their protection efforts to CSAs and therefore achieve a greater efficiency in protection [12,13]. 2. Data and Methods 2.1. Study Area The study was conducted in Hunterdon County, which is located in central New Jersey (Figure 1). Soil moisture measurement was conducted on two sites in Tewksbury Township to validate the derived TI. The Cold Brook Preserve is a 116 hectare (ha) preserved parkland managed by the Hunterdon County Parks and Recreation Division, much of which was contracted to a local farm for active cropping activities. The Christy Hoffman Farm Park is a 69 ha community park managed by Tewksbury Township for recreation. Both sites consist of gently rolling hills, have diverse topographic variation, and are easily accessible from county roads. They were selected because of those characteristics and the close contact between the research team and the public agencies that manage these sites.
Water 2015, 7
6619
Watershed modeling was conducted in the 7897 ha Neshanic River Watershed, a suburban watershed with mixed land uses located in Hunterdon County. The watershed is comprised of 36% agriculture, 31% urban, 21% forest, and 10% wetlands, with the remaining lands both barren and in water. The climate in the region is humid with typical hot and humid summers and cold winters. The average high temperature in summer is 27–30 °C and the average low temperature in winter is −7 to −5 °C. The mean annual precipitation in the watershed is 1218 mm. Snowfall in the winter season is 120–770 mm, but varies yearly. Urban development and agricultural operation have degraded water quality in the Neshanic River, leading to impairment from dissolved oxygen, phosphorus, total suspended solids, and nitrogen [42]. Various best management practices were taken to improve water quality in the watershed [43].
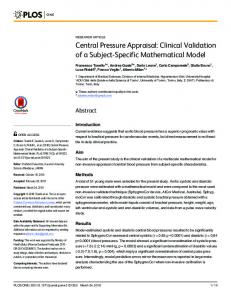
Figure 1. The location of the study sites. 2.2. Topographic Index The most common form of TI (λ) is the wetness index: λ = ln(
),
(1)
( )
where α is the upslope contributing area per unit contour length in meters to a given point in a watershed and β is the local surface slope angle in radians. The revised TI that predicts the spatial distribution of runoff-contributing areas is approximated as follows [36]: λ = ln(
( )
) = ln(
( )
) − ln(
),
(2)
Water 2015, 7
6620
where D is the local soil depth in meters to the fragipan, bedrock, or other type of restrictive layer; Ks is the mean saturated hydraulic conductivity of the soil profile in meters per day above the restrictive layer; and the other variables are defined as before. Equation (2) has two components: the wetness index, ln( ( )), and the soil water storage index, ln( ). In addition to the topography, the revised TI considers the impacts of the soil water storage capacity (KsD) above the restrictive layer. In general, the deeper the topsoil (D) and the higher the saturated hydraulic conductivity (Ks), the lower the λ value, which implies a lower likelihood of generating surface runoff. In reality, there may be several topsoil layers with different Ks values above a restrictive layer or bedrock. In this case, Ks is defined as: =
∑ ( / )
(3)
where d is total thickness of the soil above the restrictive layer; di is the thickness of layer i; ki is the saturated hydraulic conductivity of layer i [44]. The revised TI presented in Equation (2) was derived using two spatial datasets: a 10 m digital elevation model (DEM) obtained from the New Jersey Department of Environmental Protection (NJDEP) and a Soil Survey Geographic (SSURGO) soil database obtained from the US Department of Agriculture Natural Resources Conservation Service. DEM was first processed using the open source ArcGIS extension Terrain Analysis Using Digital Elevation Models (TauDEM) Version 3.1 [45] and ArcGIS Raster Calculator to obtain a wetness index grid. The soil depth (D) and the mean saturated hydraulic conductivity (Ks) were extracted for each soil type from the SSURGO soil database. The product (Ks*D) for each soil type was calculated and linked to the soil spatial distribution GIS layer. The soil layer was converted into a soil water storage index raster layer based on the value of ln( ). The converted raster layer had the same resolution as the wetness index raster layer and was also in alignment with the wetness index raster layer. The ArcGIS Raster Calculator was used to manipulate the raster layers for the wetness index derived from the DEM and the soil water storage index from the SSURGO soil data and to calculate the TI based on Equation (2). 2.3. Soil Moisture Measurement The FieldScout TDR 300 soil moisture meter with a 12 cm rod was used to measure soil moisture at the depth of 0–12 cm in the Cold Brook Reserve and Christy Hoffman Farm Park. The TDR meter converts a measured electrical signal into soil moisture content using an equation that was validated over a wide range of mineral soils. The calibration is not required for general use, and is only recommended for maximum accuracy [46]. The TDR meter has two volumetric water content (VWC) modes for measuring soil moisture: one for standard soils and the other for highly clay soils. Based on the soil conditions in the fields, the mode for standard soils was used in this study and no calibration was conducted. Locations where soil moisture was measured were recorded using a Global Positioning System (GPS) system, Trimble GeoXH handheld. The GeoXH handheld provides real-time subfoot (